
Biomass Market Size and Share
Market Overview
| Study Period | 2022 - 2032 |
|---|---|
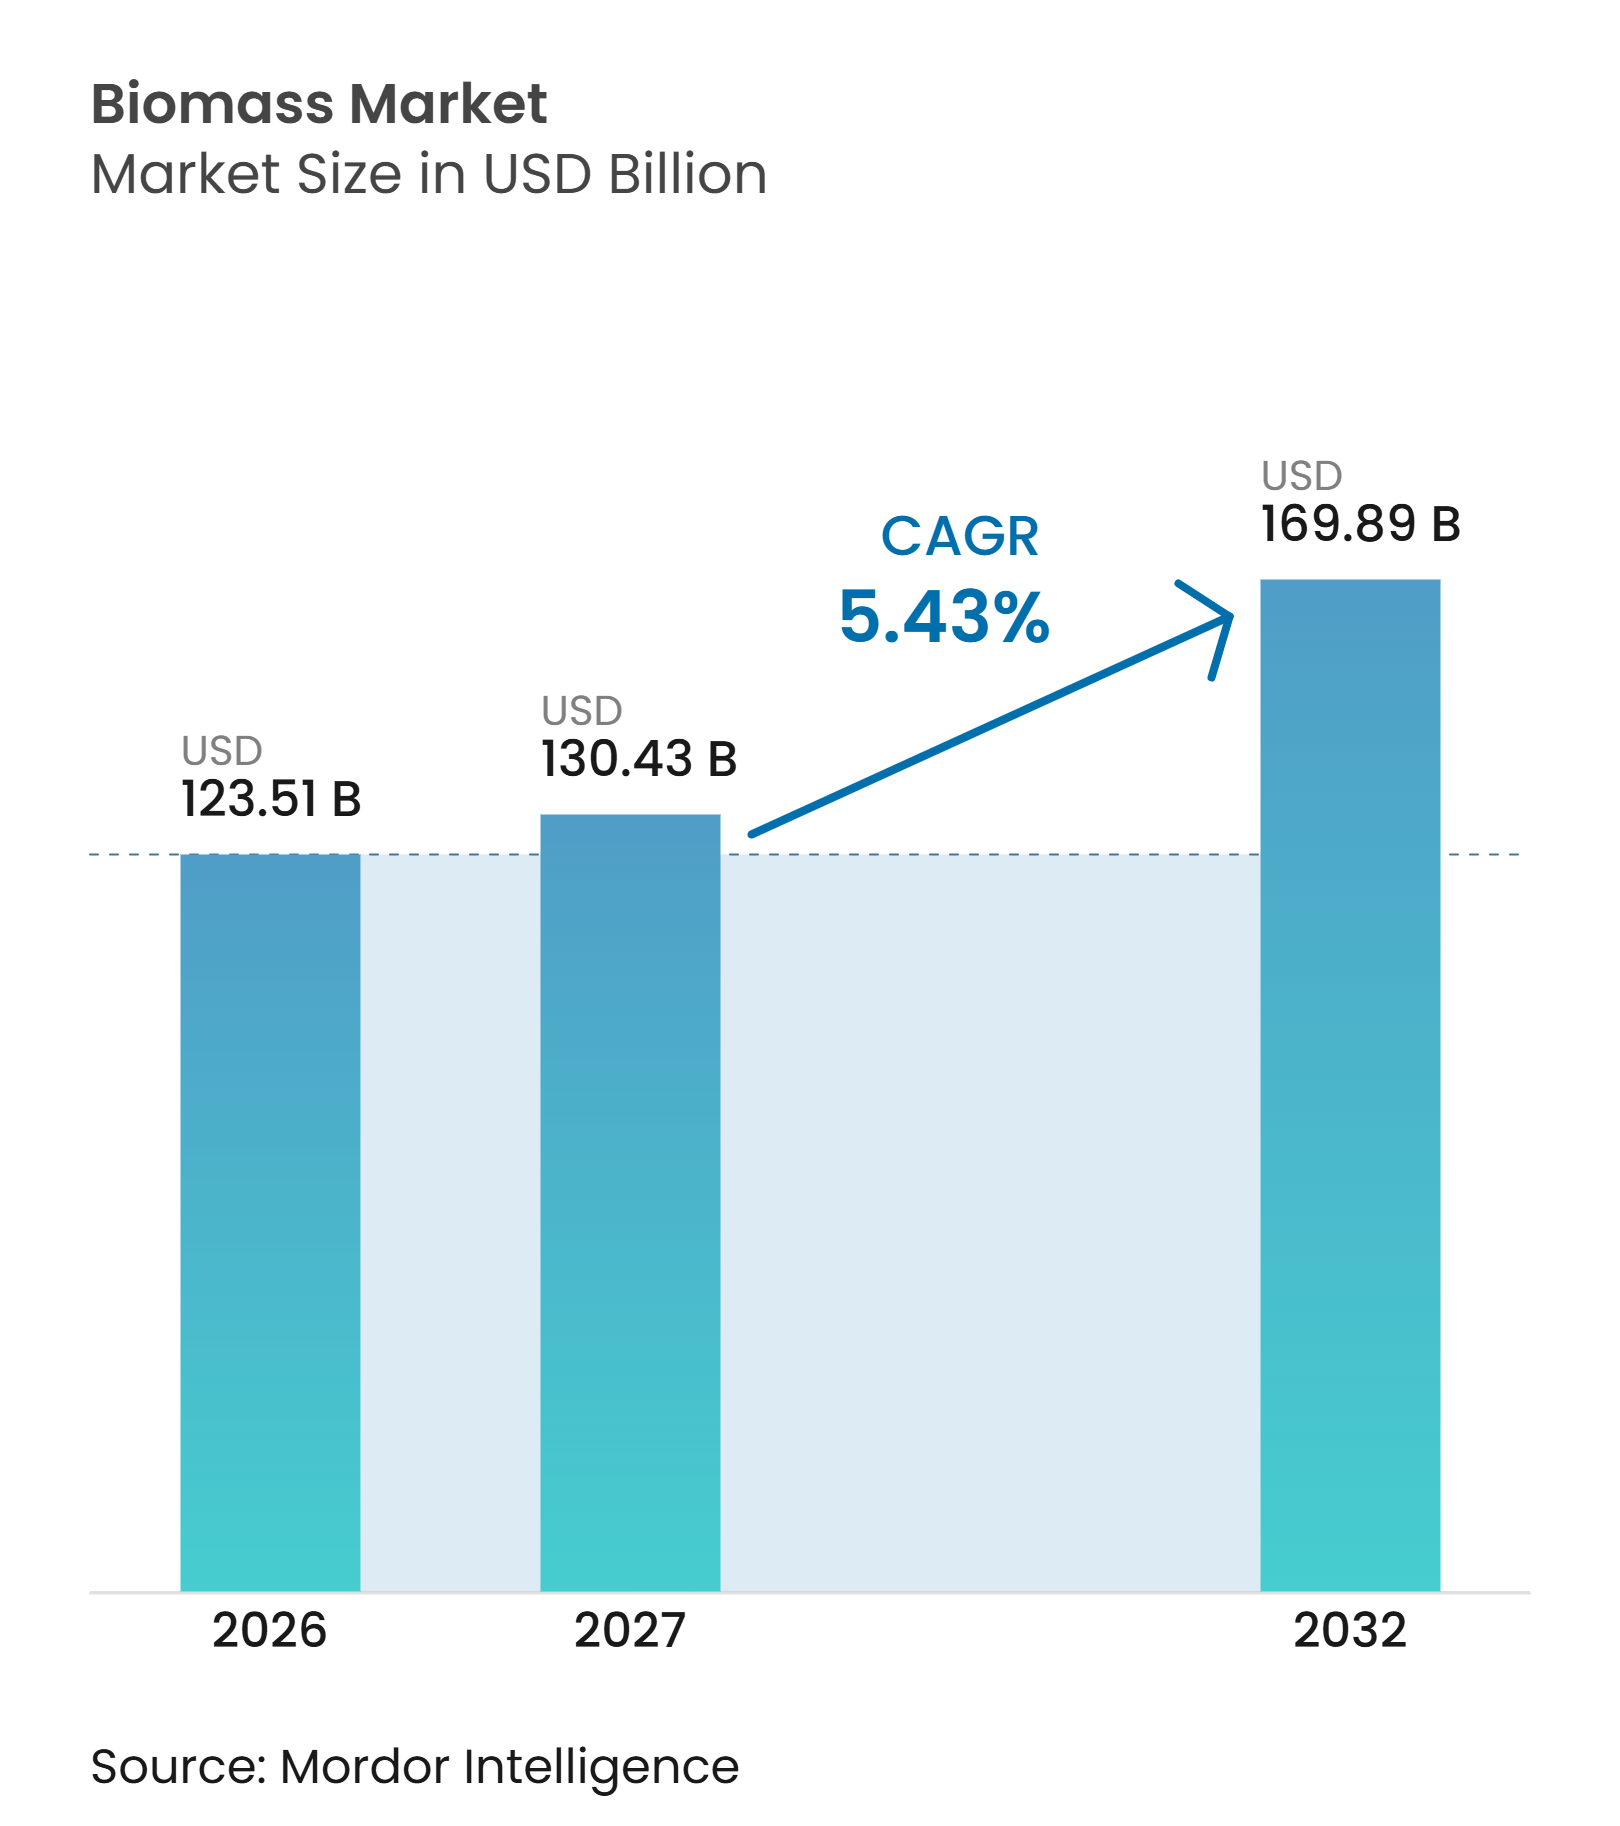
| Market Size (2027) | USD 130.43 Billion |
| Market Size (2032) | USD 169.89 Billion |
| Growth Rate (2027 - 2032) | 5.43 % |
| Fastest Growing Market | Asia-Pacific |
| Largest Market | Asia-Pacific |
| Market Concentration | Low |
Major Players *Disclaimer: Major Players sorted in no particular order Image © Mordor Intelligence. Reuse requires attribution under CC BY 4.0. | |
Biomass Market Analysis by Mordor Intelligence
The Biomass Market size is projected to be USD 123.51 billion in 2026, USD 130.43 billion in 2027, and reach USD 169.89 billion by 2032, growing at a CAGR of 5.43% from 2027 to 2032. The global biomass market is moving from supplemental fuel use toward a more established role in decarbonization plans for utilities, industrial operators, and fuel refiners. Renewable heat mandates, demand from industries that are difficult to electrify, and carbon-removal revenue from bioenergy with carbon capture and storage and biochar are supporting this shift. Modern bioenergy would need to triple by 2050 in the International Energy Agency net-zero pathway, which supports long-term demand visibility for producers and buyers.[1] The global biomass market also faces tighter feedstock competition, stricter sustainability rules, and greater scrutiny of lifecycle emissions. These conditions favor suppliers that can document feedstock origin, secure long-term supply, and meet the specifications of regulated buyers.
Key Report Takeaways
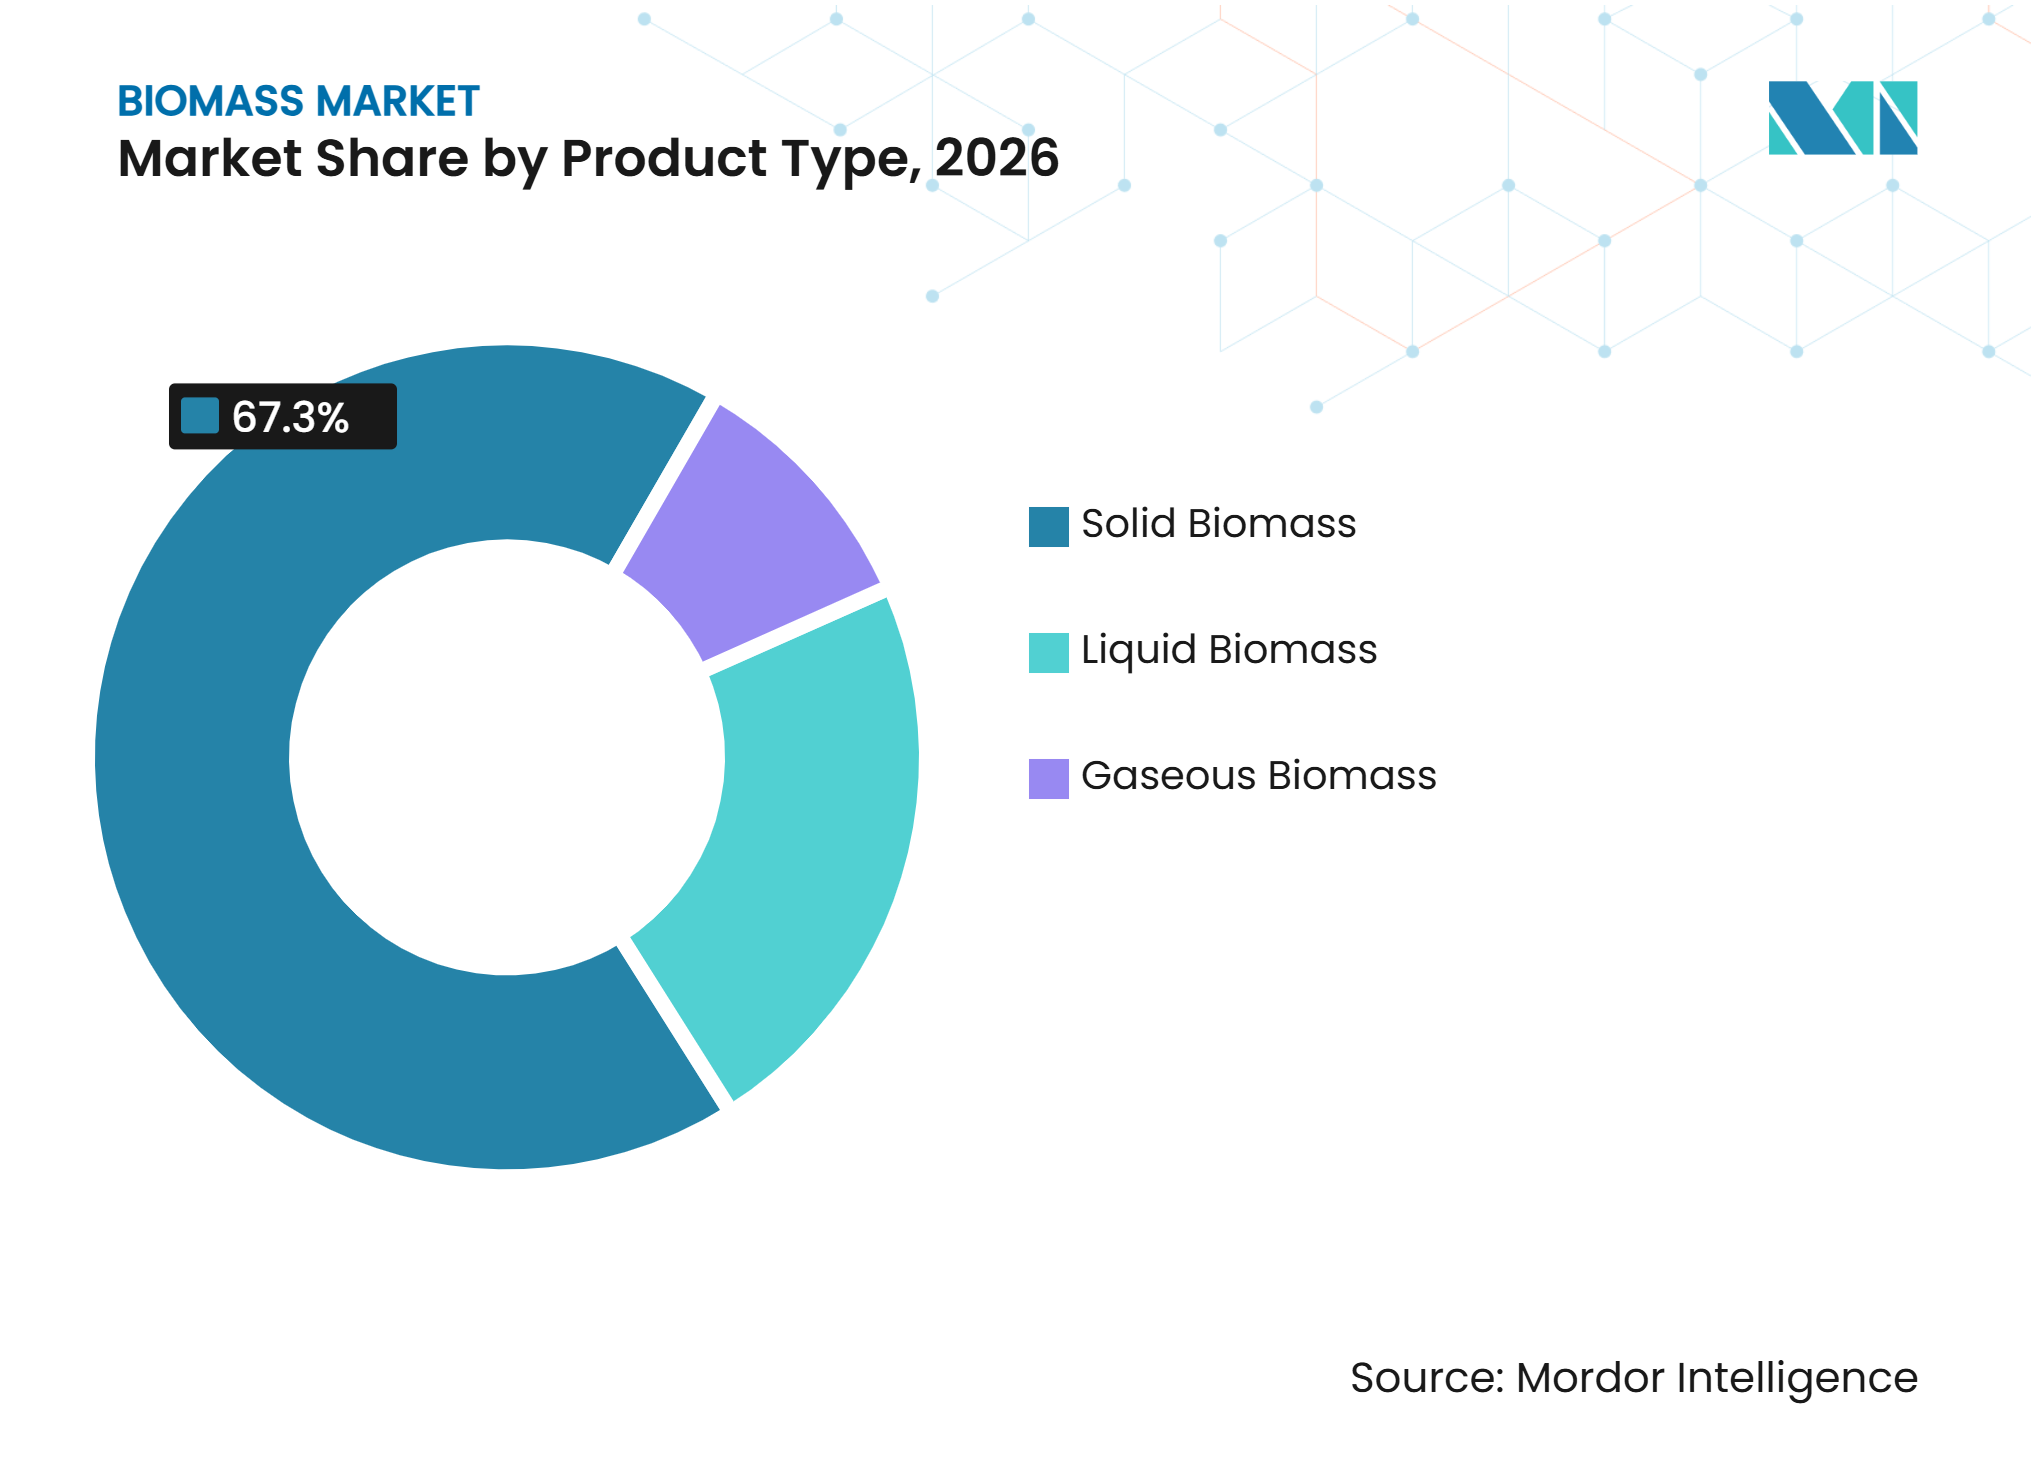
- By product type, solid biomass held 67.3% of total demand in 2026, while gaseous biomass is forecast to grow at a 6.1% CAGR through 2032.
- By technology, direct combustion accounted for 64.7% of total demand in 2026, while anaerobic digestion is forecast to grow at a 6.8% CAGR through 2032.
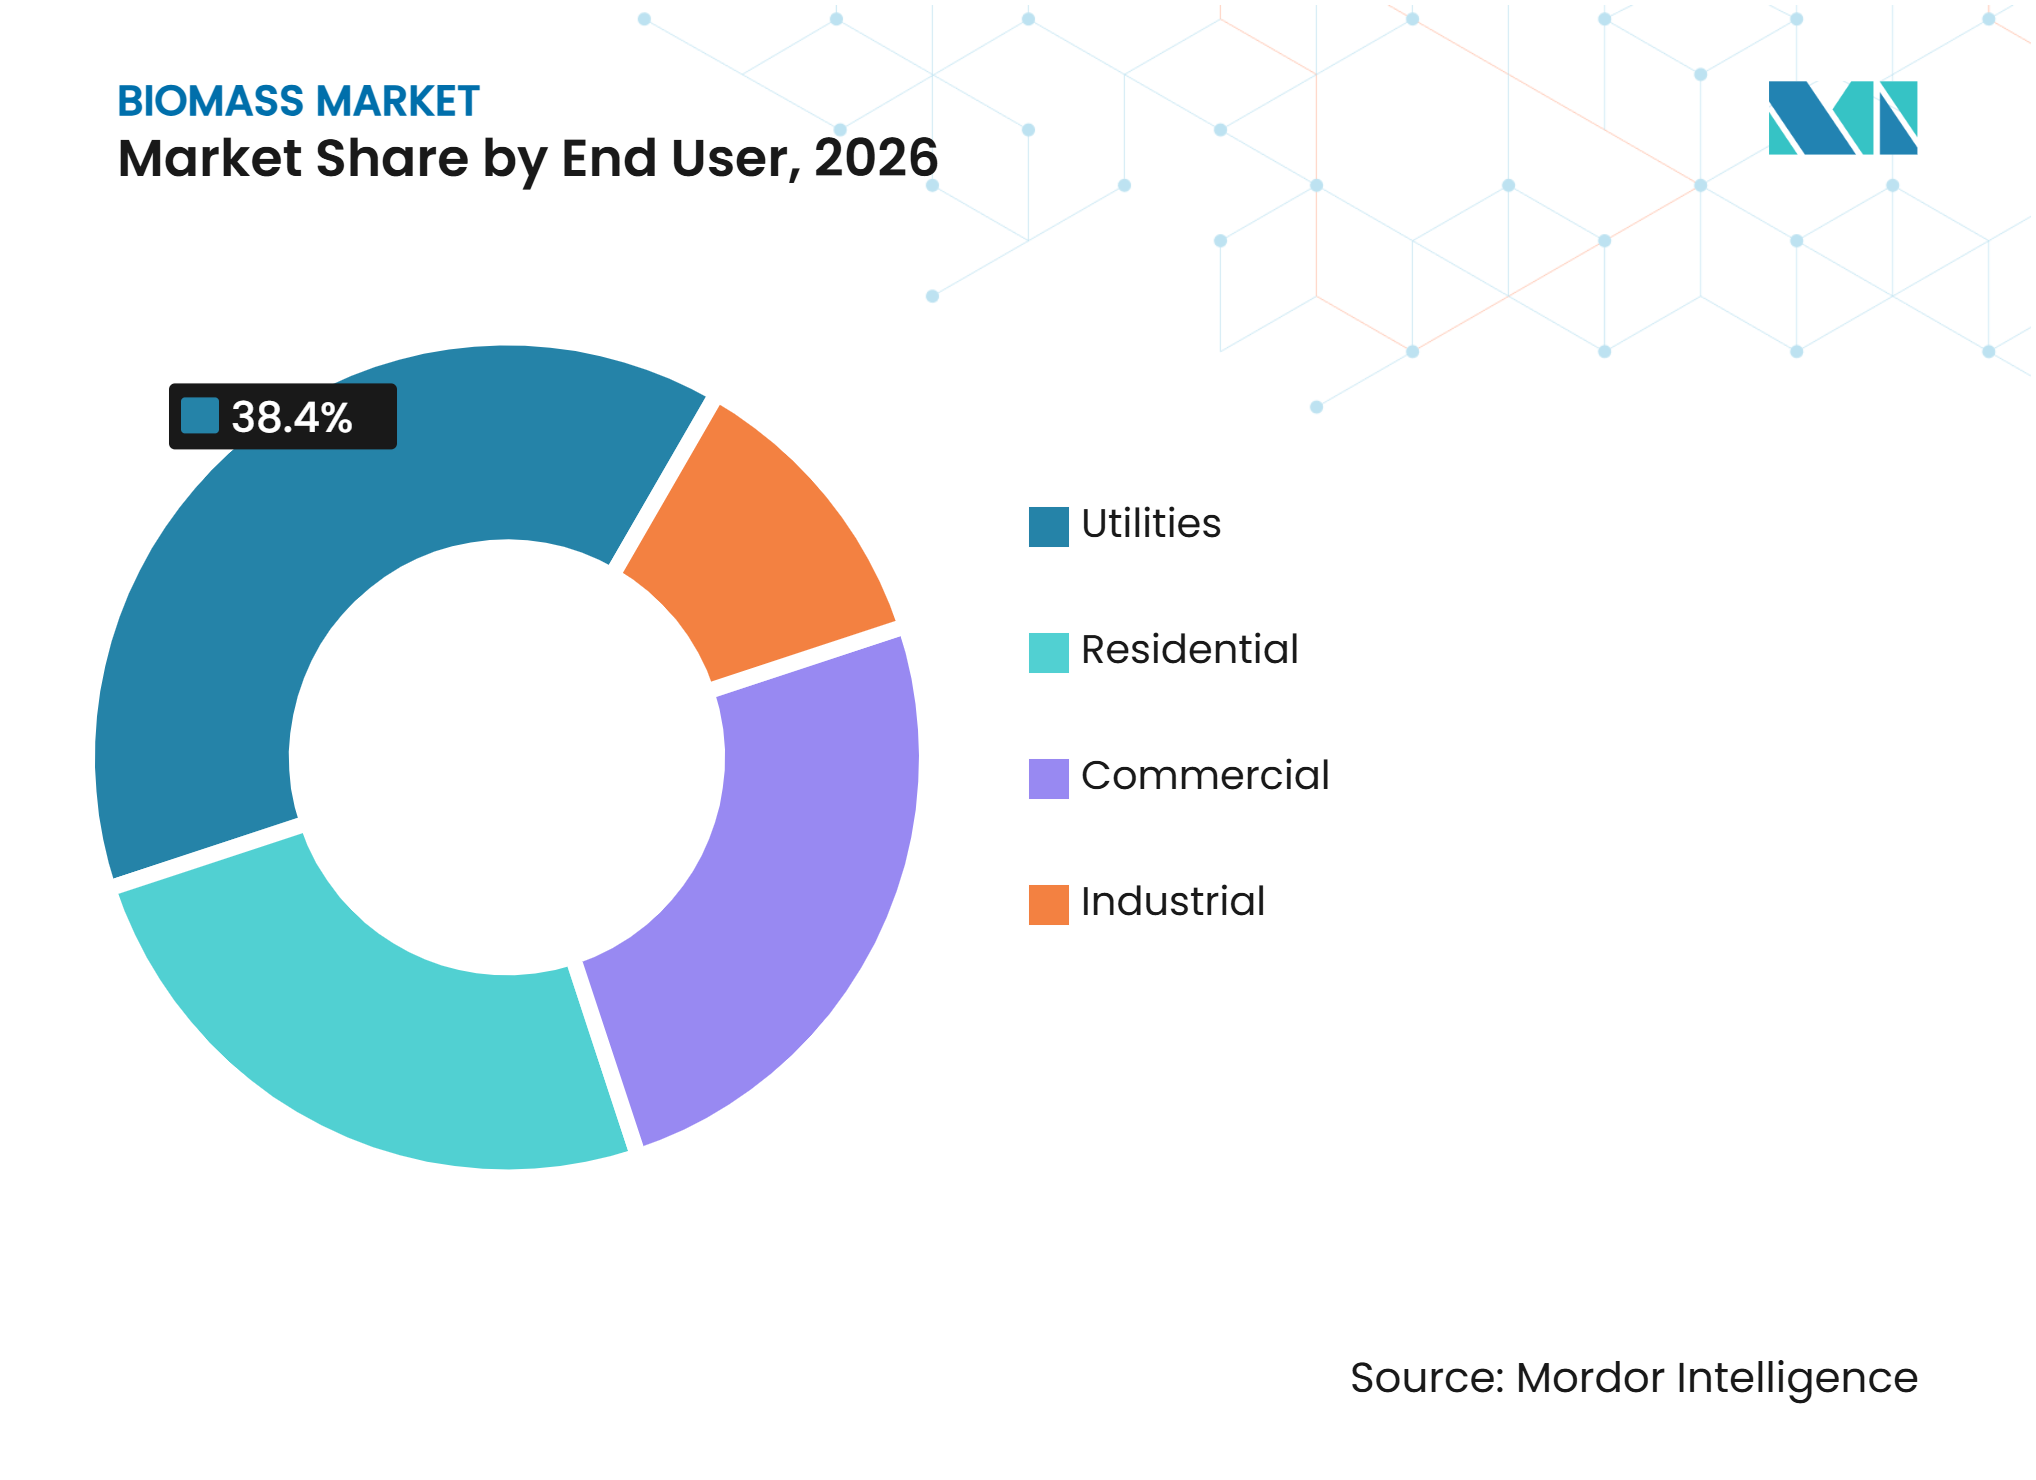
- By end user, utilities held 38.4% of demand in 2026, while the industrial segment is forecast to expand at a 5.9% CAGR through 2032.
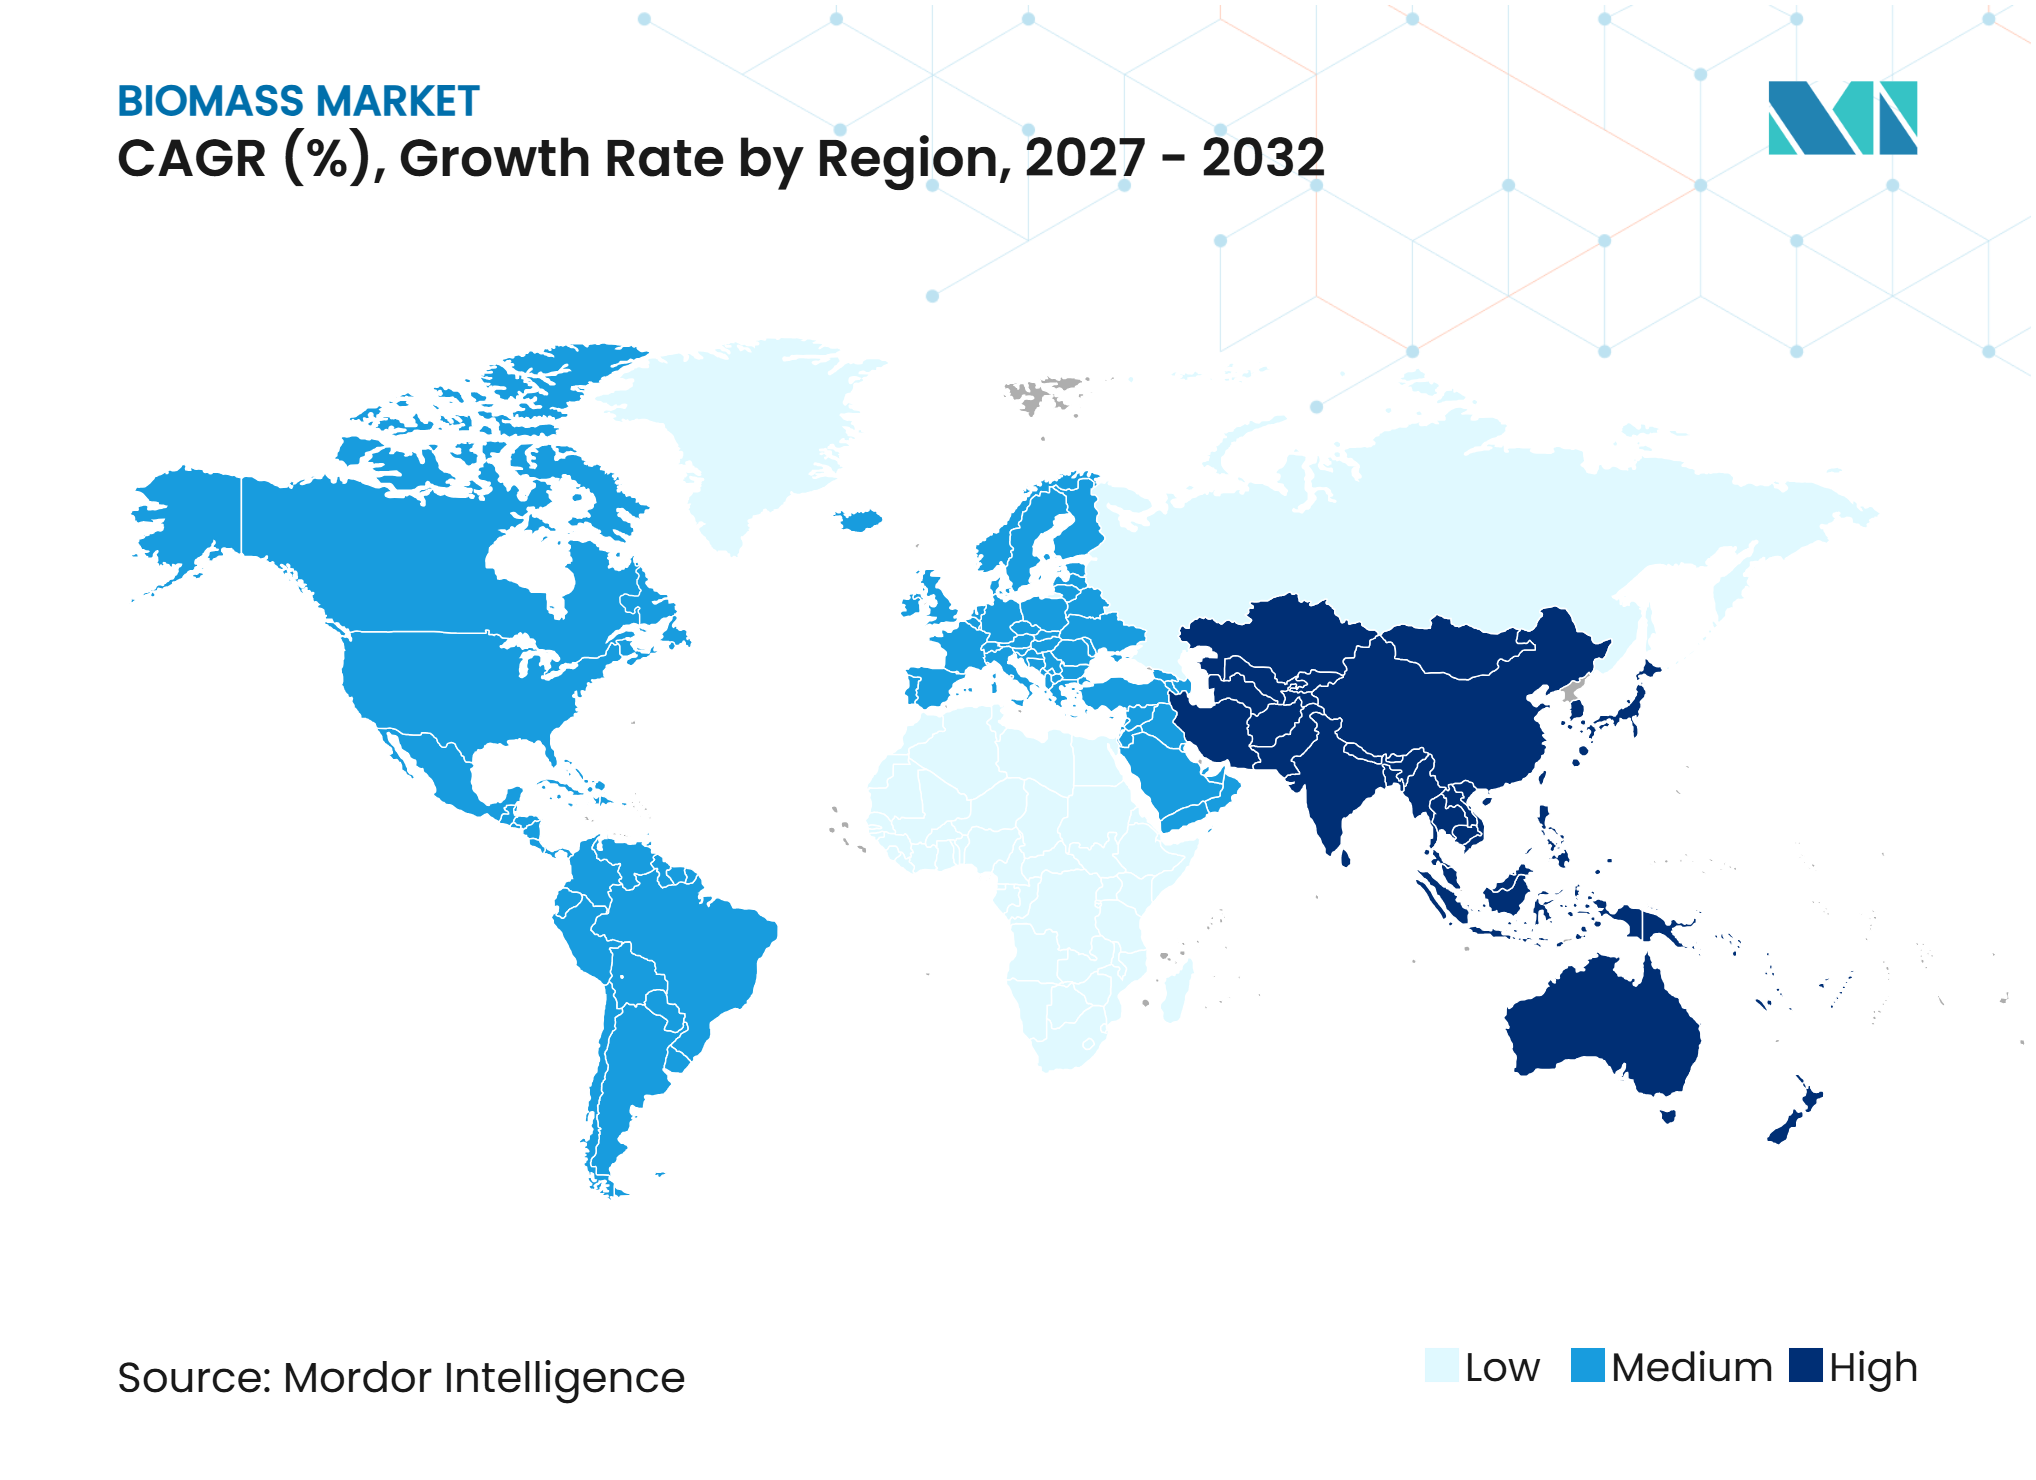
- By geography, Asia-Pacific held 42.1% of demand in 2026 and is forecast to grow at a 5.8% CAGR through 2032.
Note: Market numbers in this report are based on Mordor Intelligence's proprietary estimation framework, which combines nine months of actuals with Q4 projections for base year 2026.
Market Trends and Insights
Drivers Impact Analysis of Biomass Market*
| Driver | (~) % Impact on CAGR Forecast | Geographic Relevance | Impact Timeline |
|---|---|---|---|
| Renewable Heat, Power, and Sustainable-Fuel Demand | +1.2% | Global, with concentrated growth in the EU, Japan, and South Korea | Short term (≤ 2 years) |
| Agricultural and Forestry Residue Monetization | +0.8% | North America, South America, and Asia-Pacific | Medium term (2-4 years) |
| Waste-to-Energy and Methane-Abatement Investment | +0.7% | Europe, North America, China, and Japan | Medium term (2-4 years) |
| Biomass Conversion Flexibility for Industrial Decarbonization | +0.6% | Asia-Pacific, Europe, and North America | Medium term (2-4 years) |
| Modular Gasification and Anaerobic Digestion Deployment | +0.5% | Europe, Asia-Pacific, and North America | Long term (≥ 4 years) |
| Carbon-Removal Revenue Through BECCS and Biochar | +0.4% | Europe, North America, and emerging Asia-Pacific markets | Long term (≥ 4 years) |
| Source: Mordor Intelligence | |||
Renewable Heat, Power, and Sustainable-Fuel Demand
Demand for renewable heat and firm power is supporting the global biomass market as energy systems add more variable wind and solar generation. Global bioenergy capacity reached 155 GW in 2025.[2] Bioenergy projects commissioned in 2025 delivered electricity at a global average cost of USD 86 per MWh.[3] The EU Renewable Energy Directive III applies sustainability requirements to solid biomass heat and power installations of 7.5 MW or more. This requirement raises the importance of traceable supply chains for district-heating operators and their fuel suppliers. The global biomass market therefore gives an advantage to suppliers that can maintain recognized certification and consistent documentation across their supply base.
Biomass Conversion Flexibility for Industrial Decarbonization
Industrial users are adopting biomass where direct electrification would take longer or require major changes to high-temperature process equipment. The industrial segment is forecast to grow at a 5.9% CAGR through 2032, supported by demand from cement, steel, pulp, lime, and ceramics facilities. These buyers need consistent calorific value, low ash content, and dependable delivery, rather than only a low spot price. Suppliers that can offer torrefied pellets and gasified fuel to the same industrial site can address different fuel needs within a single customer relationship. UPM’s Lappeenranta Biorefinery has capacity to produce 130,000 tons a year of renewable diesel from crude tall oil, a wood-based feedstock that does not compete with food production.[4] In the global biomass market, feedstock selection and auditable lifecycle performance are becoming as important as conversion capacity when suppliers compete for premium industrial contracts.
Waste-to-Energy and Methane-Abatement Investment
Waste-to-energy projects use organic municipal waste and agricultural residues to reduce landfill disposal and capture value from material that can release methane. Veolia’s GreenUp program targets 8 GW of bioenergy capacity by 2030 and combines energy recovery with carbon capture in its development plans. Its Le Mans waste-to-energy site began operating an industrial carbon-capture demonstrator in 2026 with capacity to capture 10 metric tons of CO2 a day at a 90% capture rate. This model places waste operators in both energy and carbon-management roles. The global biomass market benefits when municipal service contracts provide predictable feedstock access and regulated gate fees. Waste streams can also improve project economics by combining energy sales, waste services, and potential carbon-credit revenue.
Carbon-Removal Revenue Through BECCS and Biochar
Bioenergy with Carbon Capture and Storage (BECCS) and biochar are creating additional revenue options for suppliers that can meet strict feedstock and monitoring requirements. Research published in 2025 placed sustainable biochar mitigation potential at 2.6 to 10.3 PgCO2-equivalent a year globally. Drax updated its biomass sourcing policy in 2025 to apply Renewable Energy Directive III (RED III) and Sustainable Biomass Program requirements to the biomass it sources. The company also reported that the absence of an appropriate UK framework limited the near-term case for its bioenergy carbon-capture plans. Certification under both energy and carbon-removal frameworks can support higher-value contracts for the global biomass market. The opportunity remains dependent on capital availability, carbon accounting rules, and regulatory support.
Restraints Impact Analysis of Biomass Market*
| Restraint | (~) % Impact on CAGR Forecast | Geographic Relevance | Impact Timeline |
|---|---|---|---|
| Feedstock Scarcity and Cross-Sector Residue Competition | -0.7% | Global, with greater exposure in Europe and Southeast Asia | Short term (≤ 2 years) |
| Sustainability Traceability and Lifecycle-Emission Compliance Costs | -0.5% | Europe, Japan, and South Korea | Short term (≤ 2 years) |
| Feedstock Quality, Seasonality, and Logistics Volatility | -0.4% | North America, Baltic States, and Asia-Pacific supply chains | Medium term (2-4 years) |
| Air-Quality, Land-Use, and Carbon-Debt Controversies | -0.4% | Europe, North America, and Southeast Asia | Long term (≥ 4 years) |
| Source: Mordor Intelligence | |||
Feedstock Scarcity and Cross-Sector Residue Competition
Feedstock pressure is rising as construction, packaging, biochemical, and energy users compete for forestry and agricultural residues. Graanul Invest reported that its production recovered by 15% in 2025, while raw-material availability and energy-cost volatility continued to affect production planning. Japan has excluded imported-fuel biomass power plants of 10 MW or more from new Feed-in Tariff (FIT) and Feed-in Premium (FIP) certification from fiscal year 2026. Renewable Energy Directive III (RED III) also applies a cascading-use principle that gives material uses of wood greater priority than energy uses in Europe. The global biomass market is therefore exposed to tighter availability of compliant material even where physical residue volumes remain high. Vertically integrated suppliers and operators with long-term residue agreements are better placed to manage this pressure.
Sustainability Traceability and Lifecycle-Emission Compliance Costs
Sustainability compliance is an ongoing operating requirement, particularly for suppliers using complex and long-distance supply chains. RED III requires independent verification of greenhouse-gas savings for solid biomass installations at or above 7.5 MW. Drax reported an average biomass supply-chain greenhouse-gas intensity of 93.66 kgCO2e/MWh in 2025, against the 180 kgCO2e/MWh threshold used in the United Kingdom sustainability framework. Smaller suppliers may struggle to build the data systems and assurance processes needed for audited lifecycle assessments. In the global biomass market, this raises the cost of participation and supports consolidation among suppliers with established traceability systems.
*Our forecasts treat driver/restraint impacts as directional, not additive. The impact forecasts reflect baseline growth, mix effects, and variable interactions.
Biomass Market Segment Analysis
By Product Type:
Solid Biomass Leads, While Gaseous Forms Grow FasterSolid biomass held 67.3% of global biomass market share in 2026, supported by wood pellets and agricultural briquettes used in utility co-firing, district heating, and dedicated bioenergy facilities. Deep-water export terminals, rail links, and certified supply chains give solid fuels a well-developed logistics base. These assets connect the US South with Northern Europe and connect Southeast Asian exporters with Japan. Liquid biomass retains a role in transport fuels and industrial processing, including renewable diesel from crude tall oil. Its scale is limited by the availability and sustainability profile of specialized feedstocks, including used cooking oil, agricultural lipids, and forestry co-products. The global biomass market therefore continues to rely on solid fuels for large-volume cross-border trade.
Gaseous biomass is forecast to grow at a 6.1% CAGR through 2032, the fastest rate among product types. Anaerobic digestion, biomethane grid injection, landfill gas recovery, and agricultural biogas are increasing the use of localized gas-based systems. These systems are geographically tied to feedstock sources and can support long-term agreements with gas distributors and municipal utilities. Biomethane producers can use take-or-pay arrangements linked to energy-parity pricing, which reduces direct exposure to pellet spot-price volatility. Graanul Invest reported a sourcing strategy across several Baltic regions, 12 pellet plants, and 4 carrier vessels, showing the scale needed to sustain a resilient solid-fuel supply chain. The biomass industry is thus balancing mature traded solids with faster-growing local gas pathways that use different contracts and operating models.



By Technology:
Direct Combustion Retains Scale, While Anaerobic Digestion Gains GroundDirect combustion accounted for 64.7% of the global biomass market size in 2026 because co-firing plants and industrial boilers were built to use solid fuels. This installed base supports demand for utility-grade pellets in Europe, North America, and Asia. Technology remains important for operators that cannot alter existing equipment without significant capital expenditure. Budget limits on biomass subsidies in mature markets such as the United Kingdom and Denmark can restrict incremental capacity. Co-firing remains a transitional option in Japan, South Korea, and Poland, where coal retirement follows a staged path. The global biomass market retains this large combustion base even as newer conversion routes expand.
Anaerobic digestion is forecast to grow at a 6.8% CAGR through 2032, making it the fastest-growing conversion route in the available data. It combines energy production with organic-waste management and supports biomethane use in gas networks. Environmental permits and gas-quality standards, including EN 16723-1 for compressed biogas, affect grid-injection eligibility. Gasification can use agricultural waste and municipal organic matter to produce synthetic gas and liquid fuels for higher-temperature industrial applications. Pyrolysis can generate biochar and energy co-products, while fermentation supports liquid biofuel pathways and fuel development work. UPM is qualifying crude tall oil-derived fuels for sustainable aviation use, showing the role of advanced feedstocks in premium fuel applications.
By End User:
Utilities Provide Scale, While Industry Brings Faster GrowthUtilities held 38.4% of global biomass market share in 2026, supported by long-term supply agreements that guide upstream investment. Utility procurement practices set a high standard for sustainability certification and feedstock documentation. Sustainable Biomass Program certification and RED III requirements influence producers even when their customers are outside the utility sector. Residential demand continues to benefit from pellet stoves and automated heating systems in Central and Eastern Europe. Commercial demand includes district-heating operators, hotels, and food-processing facilities that can use biogas and biomethane without managing solid-fuel storage.
The industrial segment is projected to grow at a 5.9% CAGR through 2032 and is the fastest-growing end-user group. Cement, steel, lime, and ceramics plants are using co-firing to reduce direct combustion emissions without replacing high-temperature equipment in the near term. These customers can pay a premium for fuels with verified lifecycle emissions, stable quality, and dependable logistics. Graanul Invest reported a delivered-pellet carbon intensity of 6.39 gCO2e/MJ in 2025. Such documentation can make suppliers more suitable for customers with science-based emissions targets. The global biomass market creates a distinct opportunity for suppliers that can combine fuel consistency with verified emissions performance.

Geography Analysis
Asia-Pacific Demand and Supply Dynamics
Asia-Pacific held 42.1% of the global biomass market size in 2026 and is forecast to grow at a 5.8% CAGR through 2032. China accounted for 33 GW of bioenergy capacity in 2025. Japan reached 8.1 GW of biomass installed power capacity by 2025, exceeding its 2030 target of 8.0 GW. Japan’s decision to stop new Feed-in Tariff (FIT) and Feed-in Premium (FIP) certification for imported-fuel biomass facilities of 10 MW or more from fiscal year 2026 shifts support toward smaller plants using domestic resources. This change increases the value of local feedstock management and traceability. Japan and South Korea remain established import markets, while India, Indonesia, and Australia have earlier-stage opportunities in residue collection and offtake infrastructure. The global biomass market in the region is shaped by both rapid capacity development and tightening rules for imported fuels.
Europe Policy and Feedstock Conditions
Europe remains central to renewable heat demand, and the region produced 75% of global bioheat output in the available 2025 data. RED III restricts the use of material from primary and old-growth forests, highly biodiverse forests, peatlands, and heathlands. These compliance factors reduce the range of feedstock that can meet European sustainability requirements. Graanul Invest reported a 15% increase in pellet production in 2025 as European demand recovered. UPM also reported improving regulatory conditions for advanced renewable fuels in Germany late in 2025. Europe’s regulatory influence will favor operators that can demonstrate compliant forest sourcing, lifecycle emissions control, and reliable supply to heat users.
North America, South America, Middle East, and Africa
North America combines pellet exports from the US South with domestic and export activity in forest-rich Canadian provinces. The US Environmental Protection Agency proposed total renewable fuel volumes of 24.02 billion Renewable Identification Numbers (RINs) for 2026 and 24.46 billion RINs for 2027, supporting regulatory certainty for liquid biofuels. In South America, research on Brazilian sugarcane ethanol found that integrating bioenergy with carbon capture and storage could reduce the fuel carbon intensity from positive 32.8 gCO2e/MJ to below negative 81.3 gCO2e/MJ. This supports Brazil’s role as a potential location for carbon-removal projects connected to ethanol production. The Middle East and Africa have feedstock from sugarcane bagasse, rice husk, and cotton stalk, while commercial deployment is still limited. Waste-to-energy concessions and rural electrification programs can help convert these residues into local energy supply. Saudi Arabia and the United Arab Emirates are placing biomass within wider renewable-energy diversification efforts, but capacity remains limited compared with available feedstock.
Competitive Landscape
Market Concentration
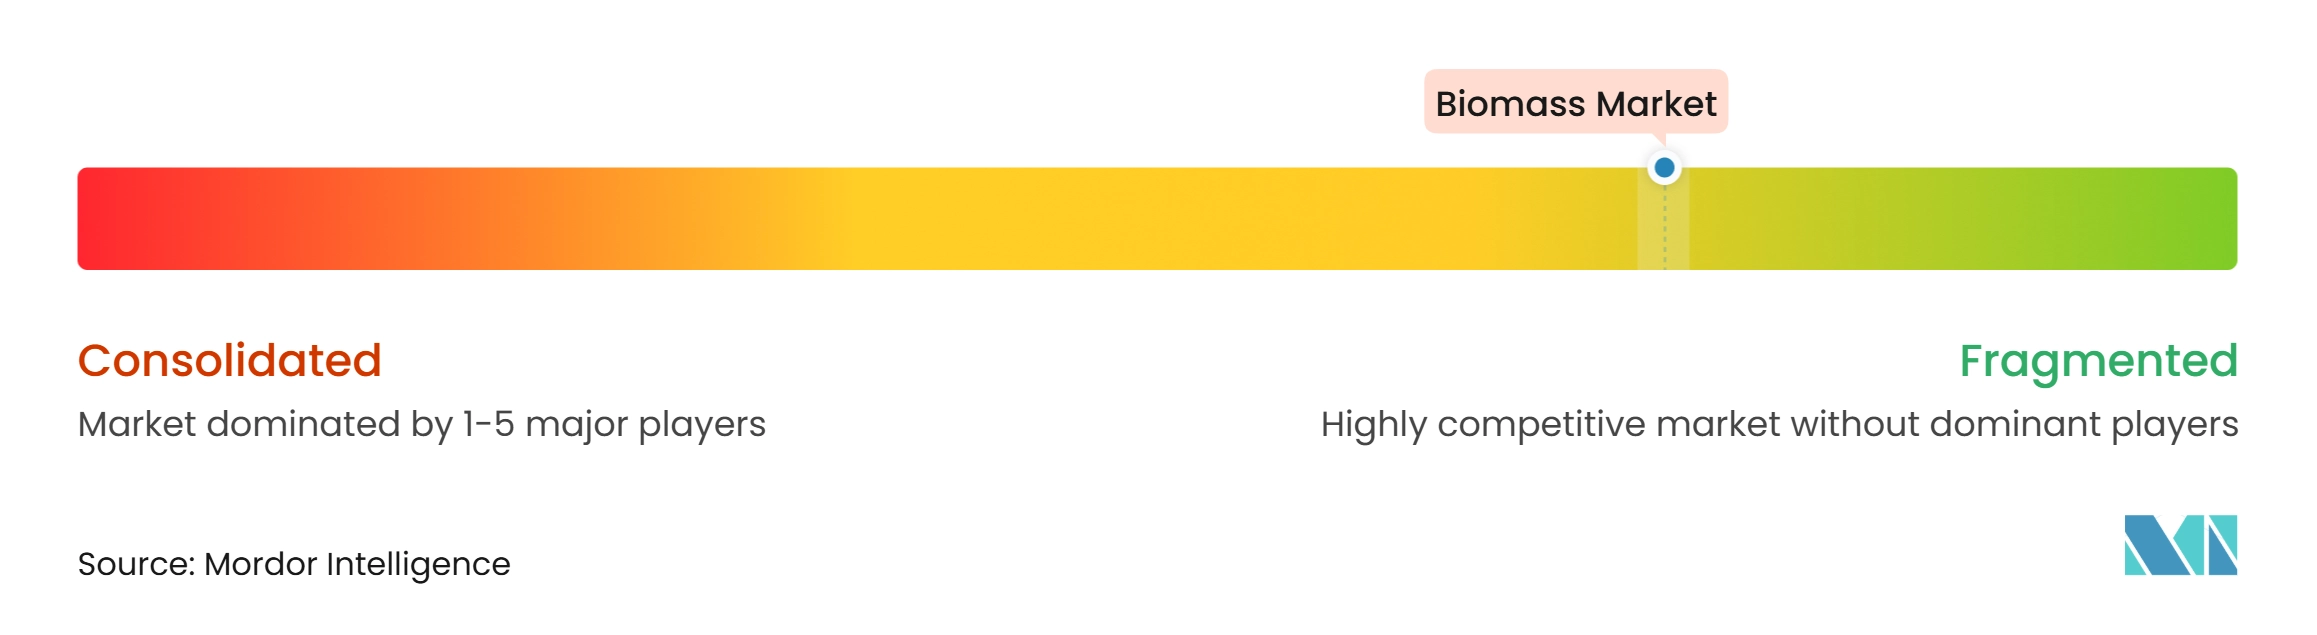
The global biomass market is fragmented, with vertically integrated pellet producers, energy companies, traders, and waste operators serving different parts of the value chain. Drax, Enviva, and Graanul Invest have meaningful industrial pellet capacity, while other companies participate through renewable fuels, waste services, regional production, or trading. Drax produced a record 4.2 million metric tons of wood pellets in 2025. It also reported that 98.62% of woody biomass used at Drax Power Station was covered by Sustainable Biomass Program-compliant claims. These certification systems require supply-chain management and third-party verification across several countries. The global biomass market is consequently becoming more dependent on compliance capabilities as well as production scale.
Competition is changing as technology and waste-management companies enter areas previously led by pellet producers. Veolia has positioned waste-to-energy assets as part of a wider carbon-management offer through its Le Mans capture project. Drax revised its 2025 biomass sourcing policy to align with RED III and Sustainable Biomass Program requirements. UPM discontinued planning for its second biomass-to-fuels refinery at Rotterdam and redirected attention to the Lappeenranta Biorefinery and sustainable aviation fuel qualification work. These actions show that companies are prioritizing regulated supply chains and higher-value fuel applications. ISO 17225 for solid biofuels and Sustainable Biomass Program requirements are becoming practical gateways for access to regulated buyers.
Opportunities remain in industrial heat and industrial CO2 abatement, where long-duration contracts and verified emissions performance can support project financing. Smaller entrants can build positions by controlling feedstock, meeting recognized certification requirements, and serving defined local customers. Suppliers without RED III or Sustainable Biomass Program traceability face narrower access to regulated tenders in Europe and Japan. The global biomass market also allows waste-service operators to secure feedstock through municipal contracts rather than compete solely in commodity markets. This difference in feedstock access may shape competition as strongly as pellet-production capacity.
Biomass Industry Leaders
-
Drax Group plc
-
Stora Enso Oyj
-
AS Graanul Invest
-
UPM-Kymmene Corporation
-
Veolia Environnement S.A.
- *Disclaimer: Major Players sorted in no particular order
Biomass Market Companies Covered in this Report
- An Viet Phat Energy Corporation
- AS Graanul Invest
- Bio Eneco Sdn. Bhd.
- CM Biomass Partners A/S
- Drax Group plc
- Energex Corporation
- Enviva Inc.
- Fram Renewable Fuels, LLC
- Groupe Savoie Inc.
- Highland Pellets, LLC
- Lignetics, Inc.
- Pfeifer Holding GmbH
- Pinnacle Renewable Energy Inc.
- Premium Pellet Ltd.
- Stora Enso Oyj
- Tanac S.A.
- UPM-Kymmene Corporation
- Veolia Environnement S.A.
- Westervelt Company
- Zilkha Biomass Energy, LLC
Recent Industry Developments in Biomass Market
- November 2026: During the 2026 harvesting season, SAEL Industries began procuring approximately 2 million tonnes of paddy straw to supply its 11 agricultural waste-to-energy plants, which have a combined generation capacity of 164.9 MW. This initiative strengthens agricultural residue collection and utilization, supports renewable electricity generation, and reduces crop-residue burning across North India.
- November 2026: Vietnam's National Assembly discussed proposed amendments to the Electricity Law to strengthen policy support for biomass energy, rooftop solar, offshore wind, and electricity transmission infrastructure. The proposed amendments aim to establish a clearer regulatory framework for renewable energy development and encourage further investment in biomass-based power generation.
- September 2026: NB Power advanced its Belledune Clean Fuel Project in New Brunswick by securing board approval and signing fuel supply agreements with Canadian suppliers of advanced biomass pellets derived from wood and agricultural hemp. The project will convert the existing coal-fired Belledune Generating Station to biomass-based generation, enabling the facility to continue operating beyond 2030 while complying with Canada’s coal phase-out requirements. The initiative is expected to support local forestry, agriculture, transportation, and logistics industries.
- August 2026: Haffner Energy and IGNIS P2X launched the AeroVerde project to develop bio-based and e-SAF production facilities in Spain using residual biomass. Haffner Energy’s thermochemical conversion technology will convert biomass into hydrogen-rich synthesis gas to produce sustainable aviation fuel through Fischer–Tropsch and Alcohol-to-Jet pathways. The project will also assess the integration of biogenic carbon dioxide with renewable hydrogen to produce e-SAF, expanding the application of biomass conversion technologies in the aviation fuel industry.
Global Biomass Market Report Scope
Biomass refers to the total mass of living or recently living organic material including plants, animals, microorganisms, and their waste within a given area or ecosystem.
The biomass market is segmented into product type, technology, end user and geography. By product type, the market is segmented into solid biomass, liquid biomass, and gaseous biomass. By technology, the market is divided into direct combustion, gasification, anaerobic digestion, pyrolysis, co-firing, fermentation, and other technologies. By end user, the market is segmented into residential, commercial, industrial, and utilities. The report also covers the market size and forecasts for the global biomass market across 22 countries in key regions. For each segment, the market sizing and forecasts have been provided on the basis of value (USD).
Segmentation Overview
| Solid Biomass |
| Liquid Biomass |
| Gaseous Biomass |
| Direct Combustion |
| Gasification |
| Anaerobic Digestion |
| Pyrolysis |
| Co-firing |
| Fermentation |
| Other Technologies |
| Residential |
| Commercial |
| Industrial |
| Utilities |
| North America | United States |
| Canada | |
| Mexico | |
| Europe | Germany |
| United Kingdom | |
| France | |
| Italy | |
| Spain | |
| Rest of Europe | |
| Asia-Pacific | China |
| India | |
| Australia | |
| Japan | |
| South Korea | |
| Indonesia | |
| Rest of Asia-Pacifc | |
| South America | Brazil |
| Argentina | |
| Rest of South America | |
| Middle East and Africa | Saudi Arabia |
| United Arab Emirates | |
| Qatar | |
| Oman | |
| Nigeria | |
| South Africa | |
| Rest of Middle East and Africa |
| By Product Type | Solid Biomass | |
| Liquid Biomass | ||
| Gaseous Biomass | ||
| By Technology | Direct Combustion | |
| Gasification | ||
| Anaerobic Digestion | ||
| Pyrolysis | ||
| Co-firing | ||
| Fermentation | ||
| Other Technologies | ||
| By End User | Residential | |
| Commercial | ||
| Industrial | ||
| Utilities | ||
| By Geography | North America | United States |
| Canada | ||
| Mexico | ||
| Europe | Germany | |
| United Kingdom | ||
| France | ||
| Italy | ||
| Spain | ||
| Rest of Europe | ||
| Asia-Pacific | China | |
| India | ||
| Australia | ||
| Japan | ||
| South Korea | ||
| Indonesia | ||
| Rest of Asia-Pacifc | ||
| South America | Brazil | |
| Argentina | ||
| Rest of South America | ||
| Middle East and Africa | Saudi Arabia | |
| United Arab Emirates | ||
| Qatar | ||
| Oman | ||
| Nigeria | ||
| South Africa | ||
| Rest of Middle East and Africa | ||
Key Questions Answered in the Report
What is the projected growth rate for biomass through 2032?
The global biomass market is projected to grow at a 5.43% CAGR from 2027 to 2032, reaching USD 169.89 billion by 2032.
Which biomass product type has the largest share?
Solid biomass led product types with a 67.3% share in 2026, supported by pellet use in power generation and district heating.
Which biomass technology is growing the fastest?
Anaerobic digestion is projected to grow at a 6.8% CAGR through 2032 because it combines waste management with energy production.
Why are industrial users increasing biomass use?
Cement, steel, lime, and ceramics plants can use biomass fuels to reduce combustion emissions without replacing high-temperature equipment in the near term.
Which region leads biomass demand?
Asia-Pacific held 42.1% of demand in 2026 and is forecast to grow at a 5.8% CAGR through 2032.
What is the main constraint on biomass suppliers?
Feedstock competition and lifecycle-emission compliance requirements are increasing costs and make traceable, long-term supply contracts more important.