
Automotive Smart Display Market Size and Share
Market Overview
| Study Period | 2020 - 2032 |
|---|---|
| Market Size (2027) | USD 15.79 Billion |
| Market Size (2032) | USD 24.81 Billion |
| Growth Rate (2027 - 2032) | 9.45 % |
| Fastest Growing Market | Asia-Pacific |
| Largest Market | Asia-Pacific |
| Market Concentration | Medium |
Major Players *Disclaimer: Major Players sorted in no particular order Image © Mordor Intelligence. Reuse requires attribution under CC BY 4.0. | |
Automotive Smart Display Market Analysis by Mordor Intelligence
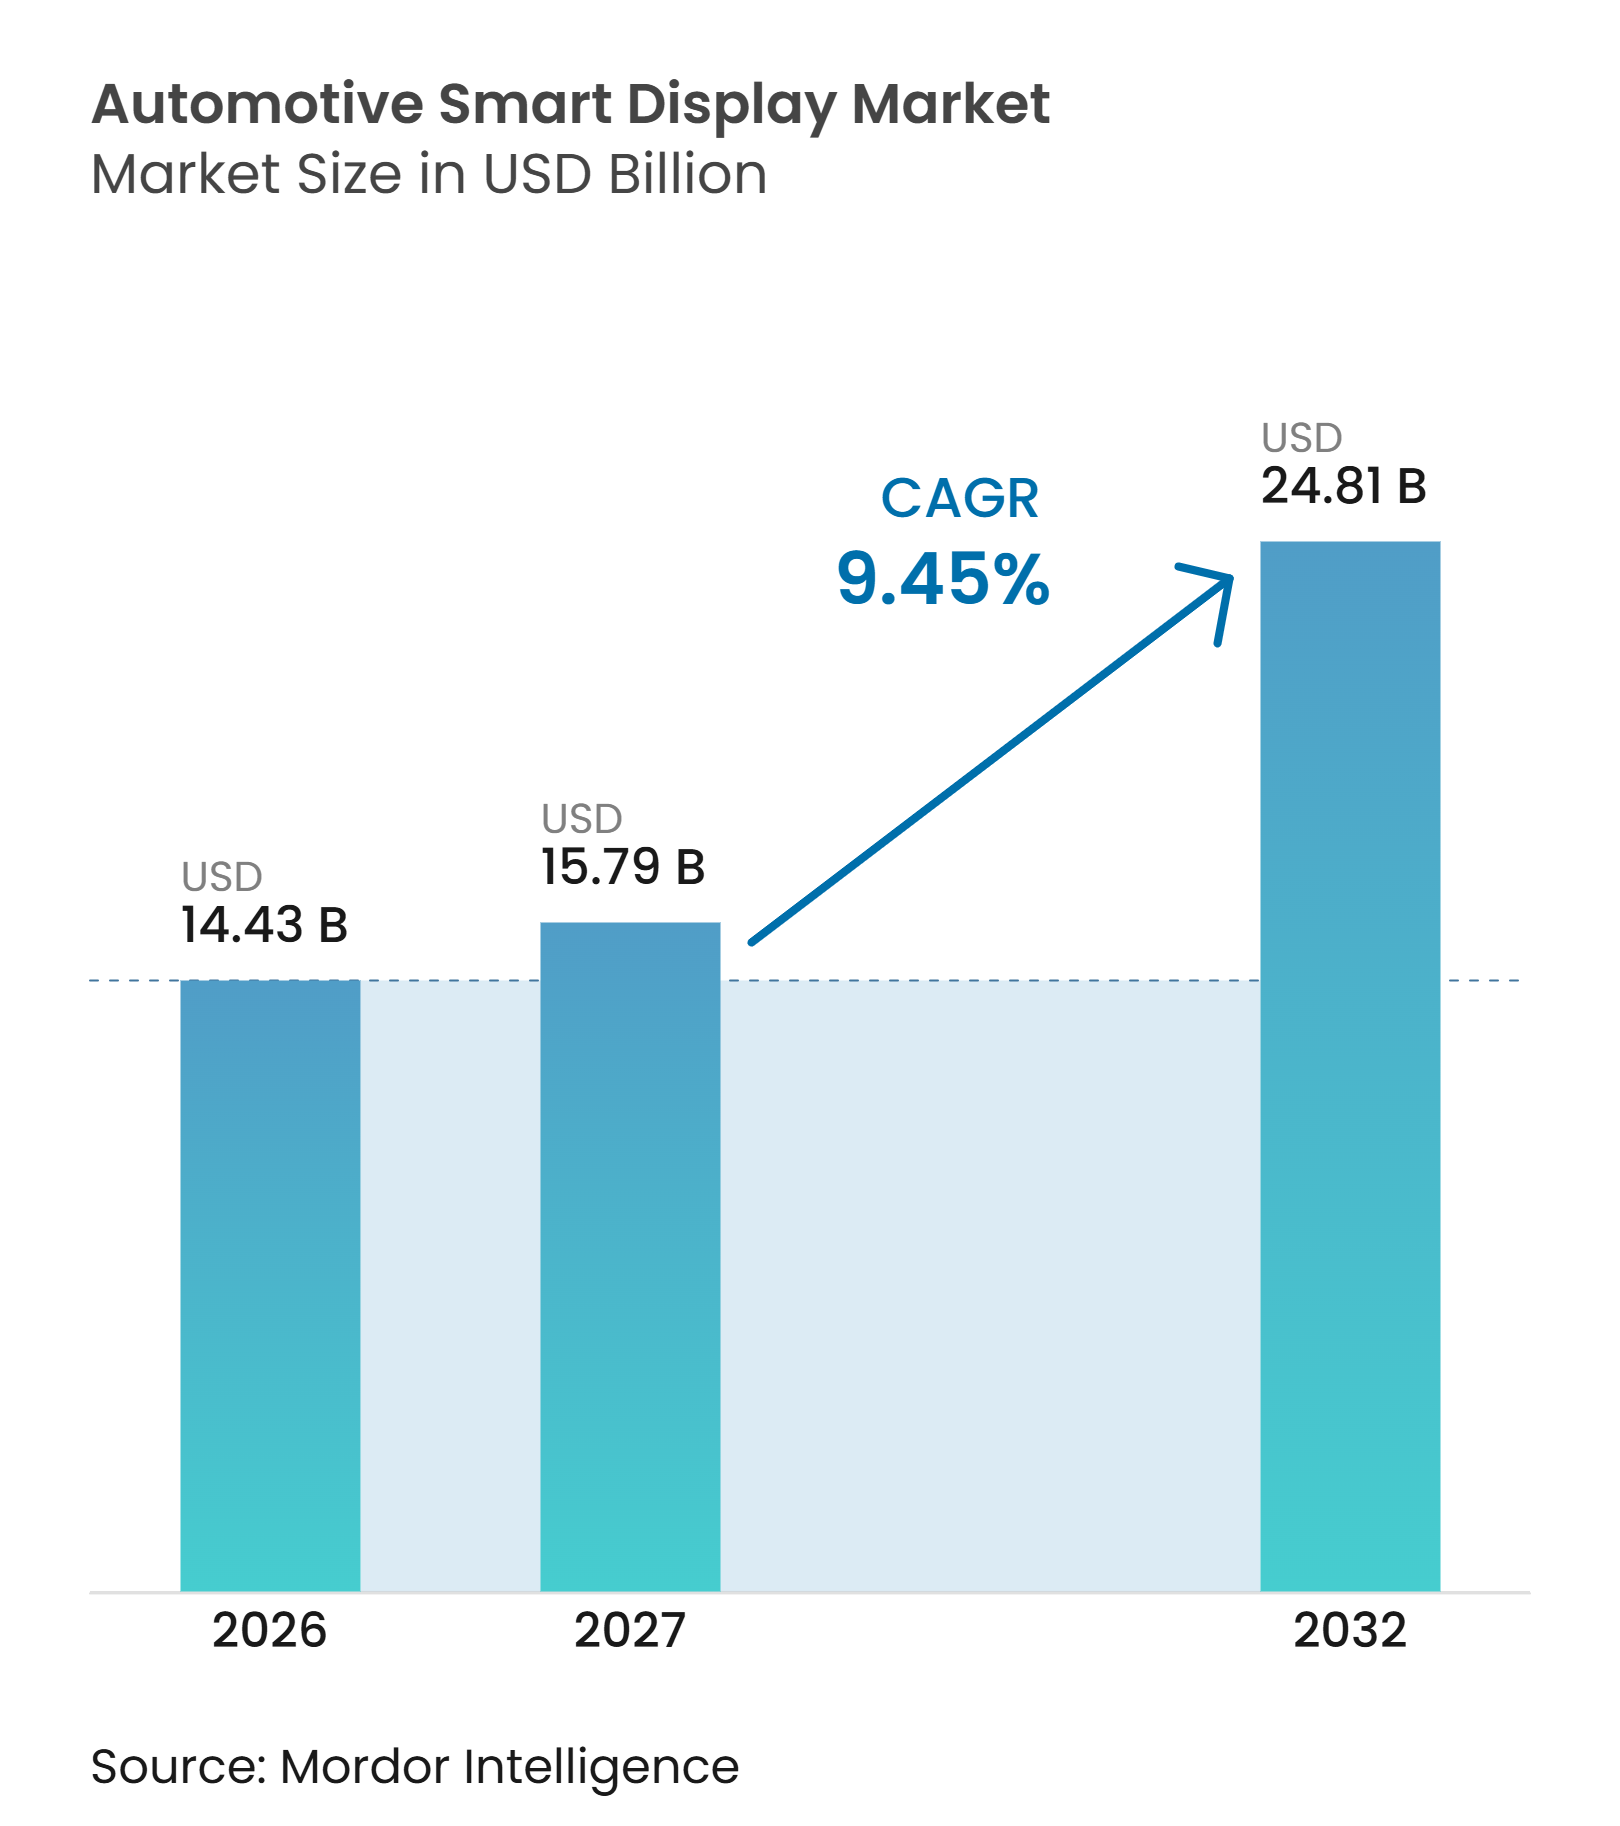
The automotive smart display market size was valued at USD 14.43 billion in 2026 and is expected to grow from USD 15.79 billion in 2027 to USD 24.81 billion by 2032, at a CAGR of 9.45% during 2027-2032. The automotive smart display market is changing as screens take a larger role in navigation, safety notifications, connectivity, and in-car entertainment. Vehicle makers are designing cabins around centralized computing, which can support several screens through a shared electronic architecture. Electric vehicle programs are helping this shift by moving information and controls onto digital surfaces. Suppliers that can combine panels, optical components, software, and cockpit electronics are better positioned for integrated sourcing programs. The automotive smart display market also faces a difficult balance between advanced display functions and the need for dependable, cost-conscious designs for high-volume vehicles.
Key Report Takeaways
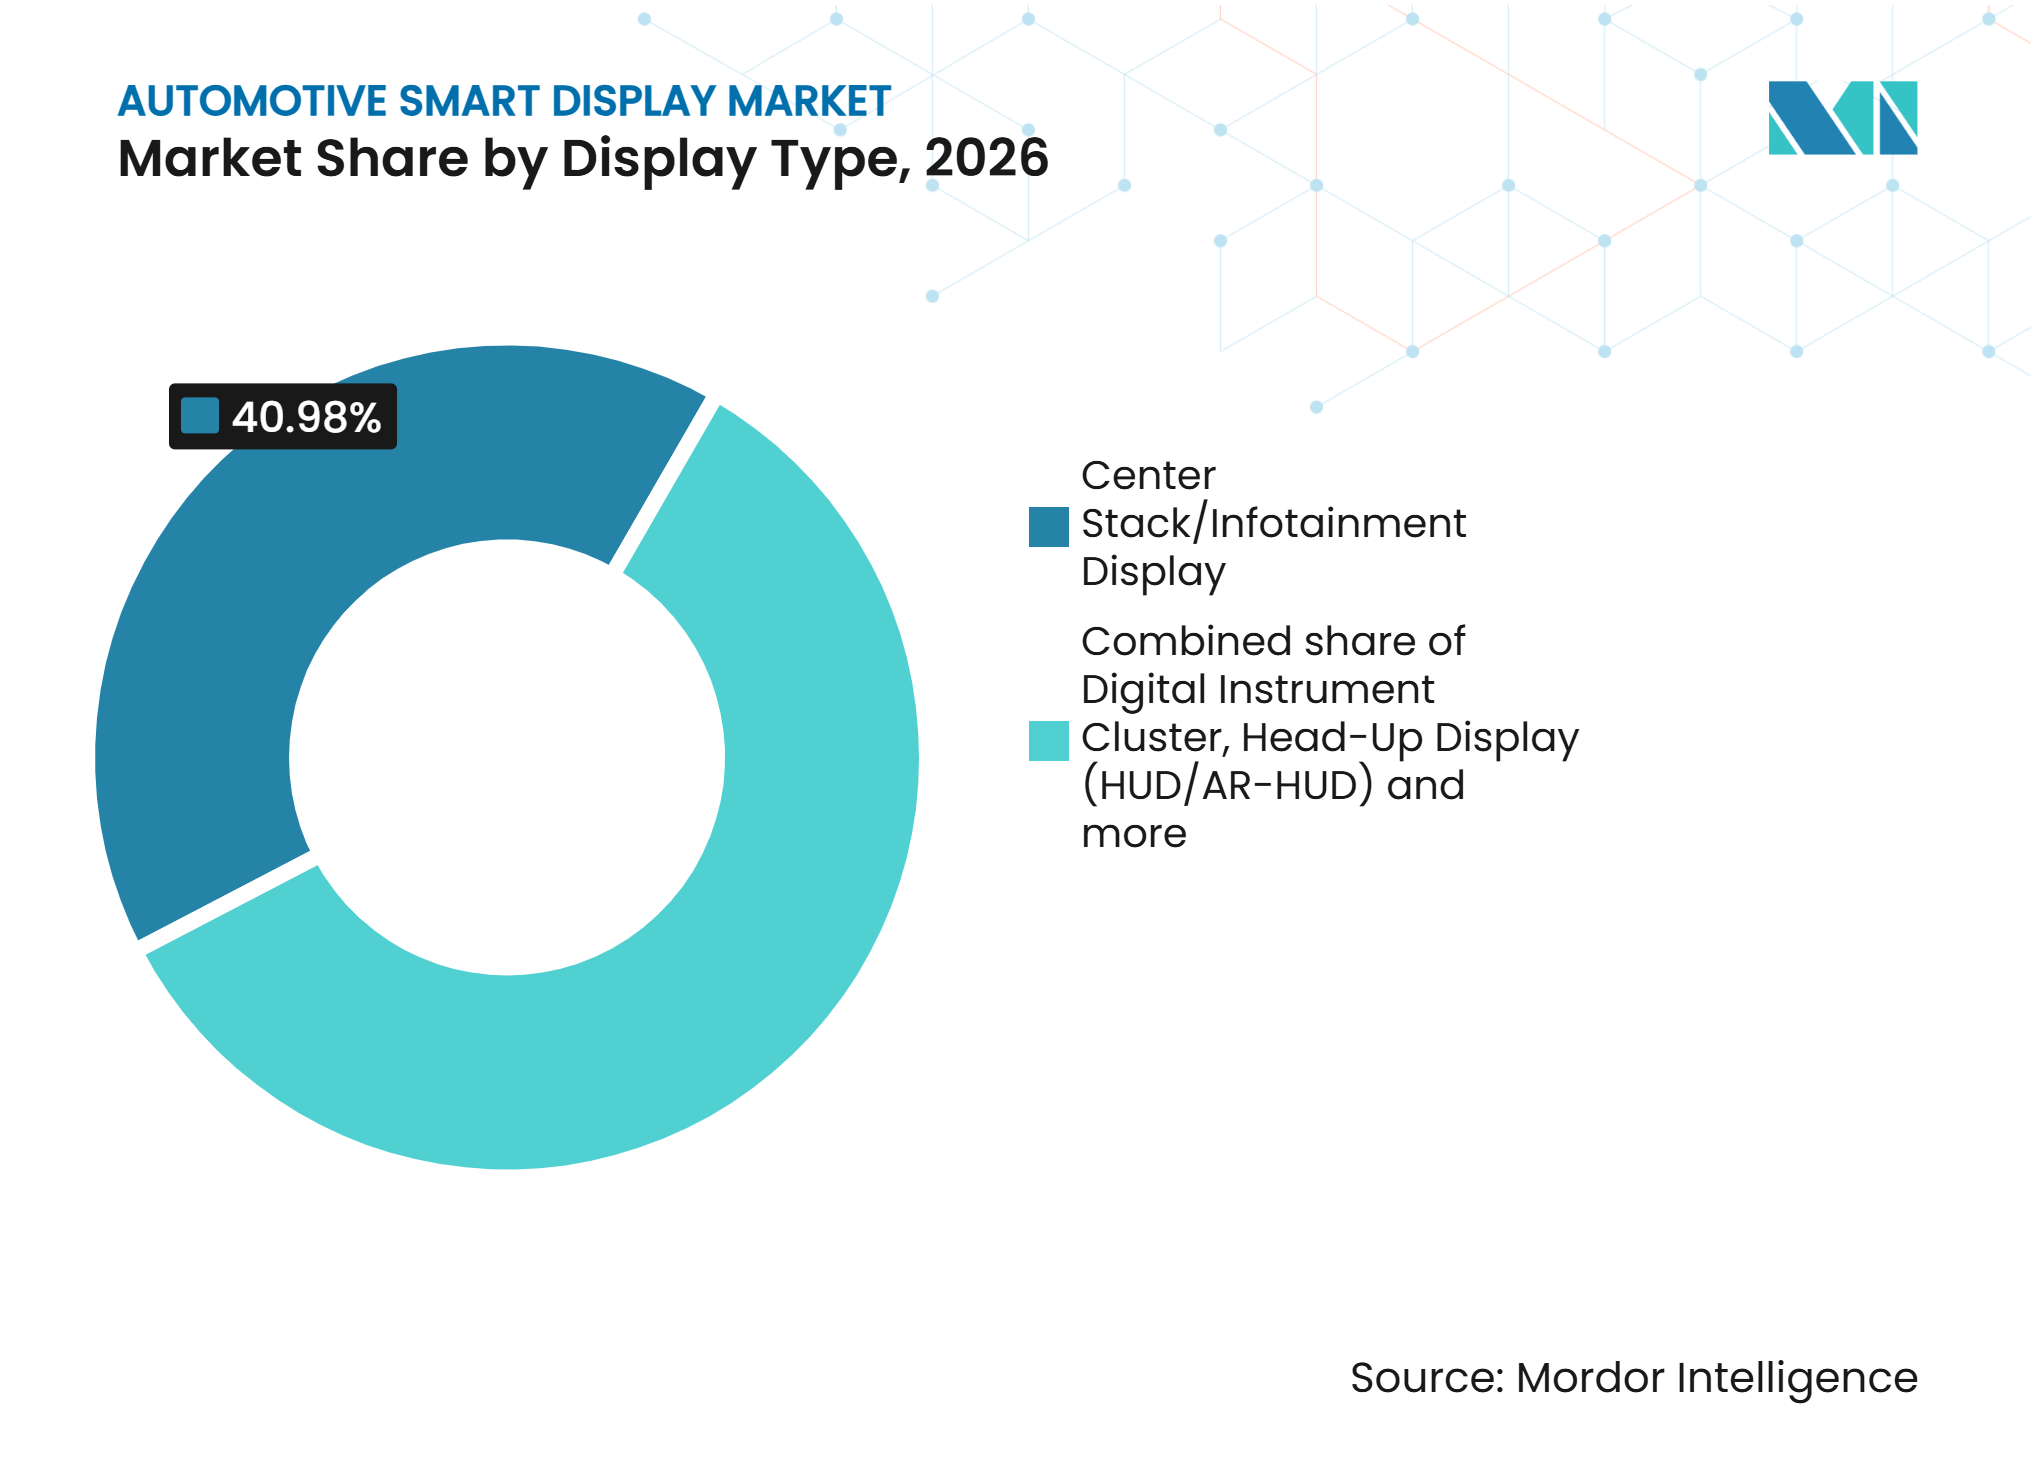
- By display type, center stack/infotainment display held 40.98% of the automotive smart display market share in 2026, while head-up display (HUD/AR-HUD) is forecast to grow at a 10.01% CAGR through 2032.
- By technology, LCD/TFT held 66.52% of the automotive smart display market share in 2026, while OLED is forecast to grow at a 10.64% CAGR through 2032.
- By screen size, 5 to 10 inches held 56.59% of the automotive smart display market share in 2026, while displays above 10 inches are forecast to grow at an 11.14% CAGR through 2032.
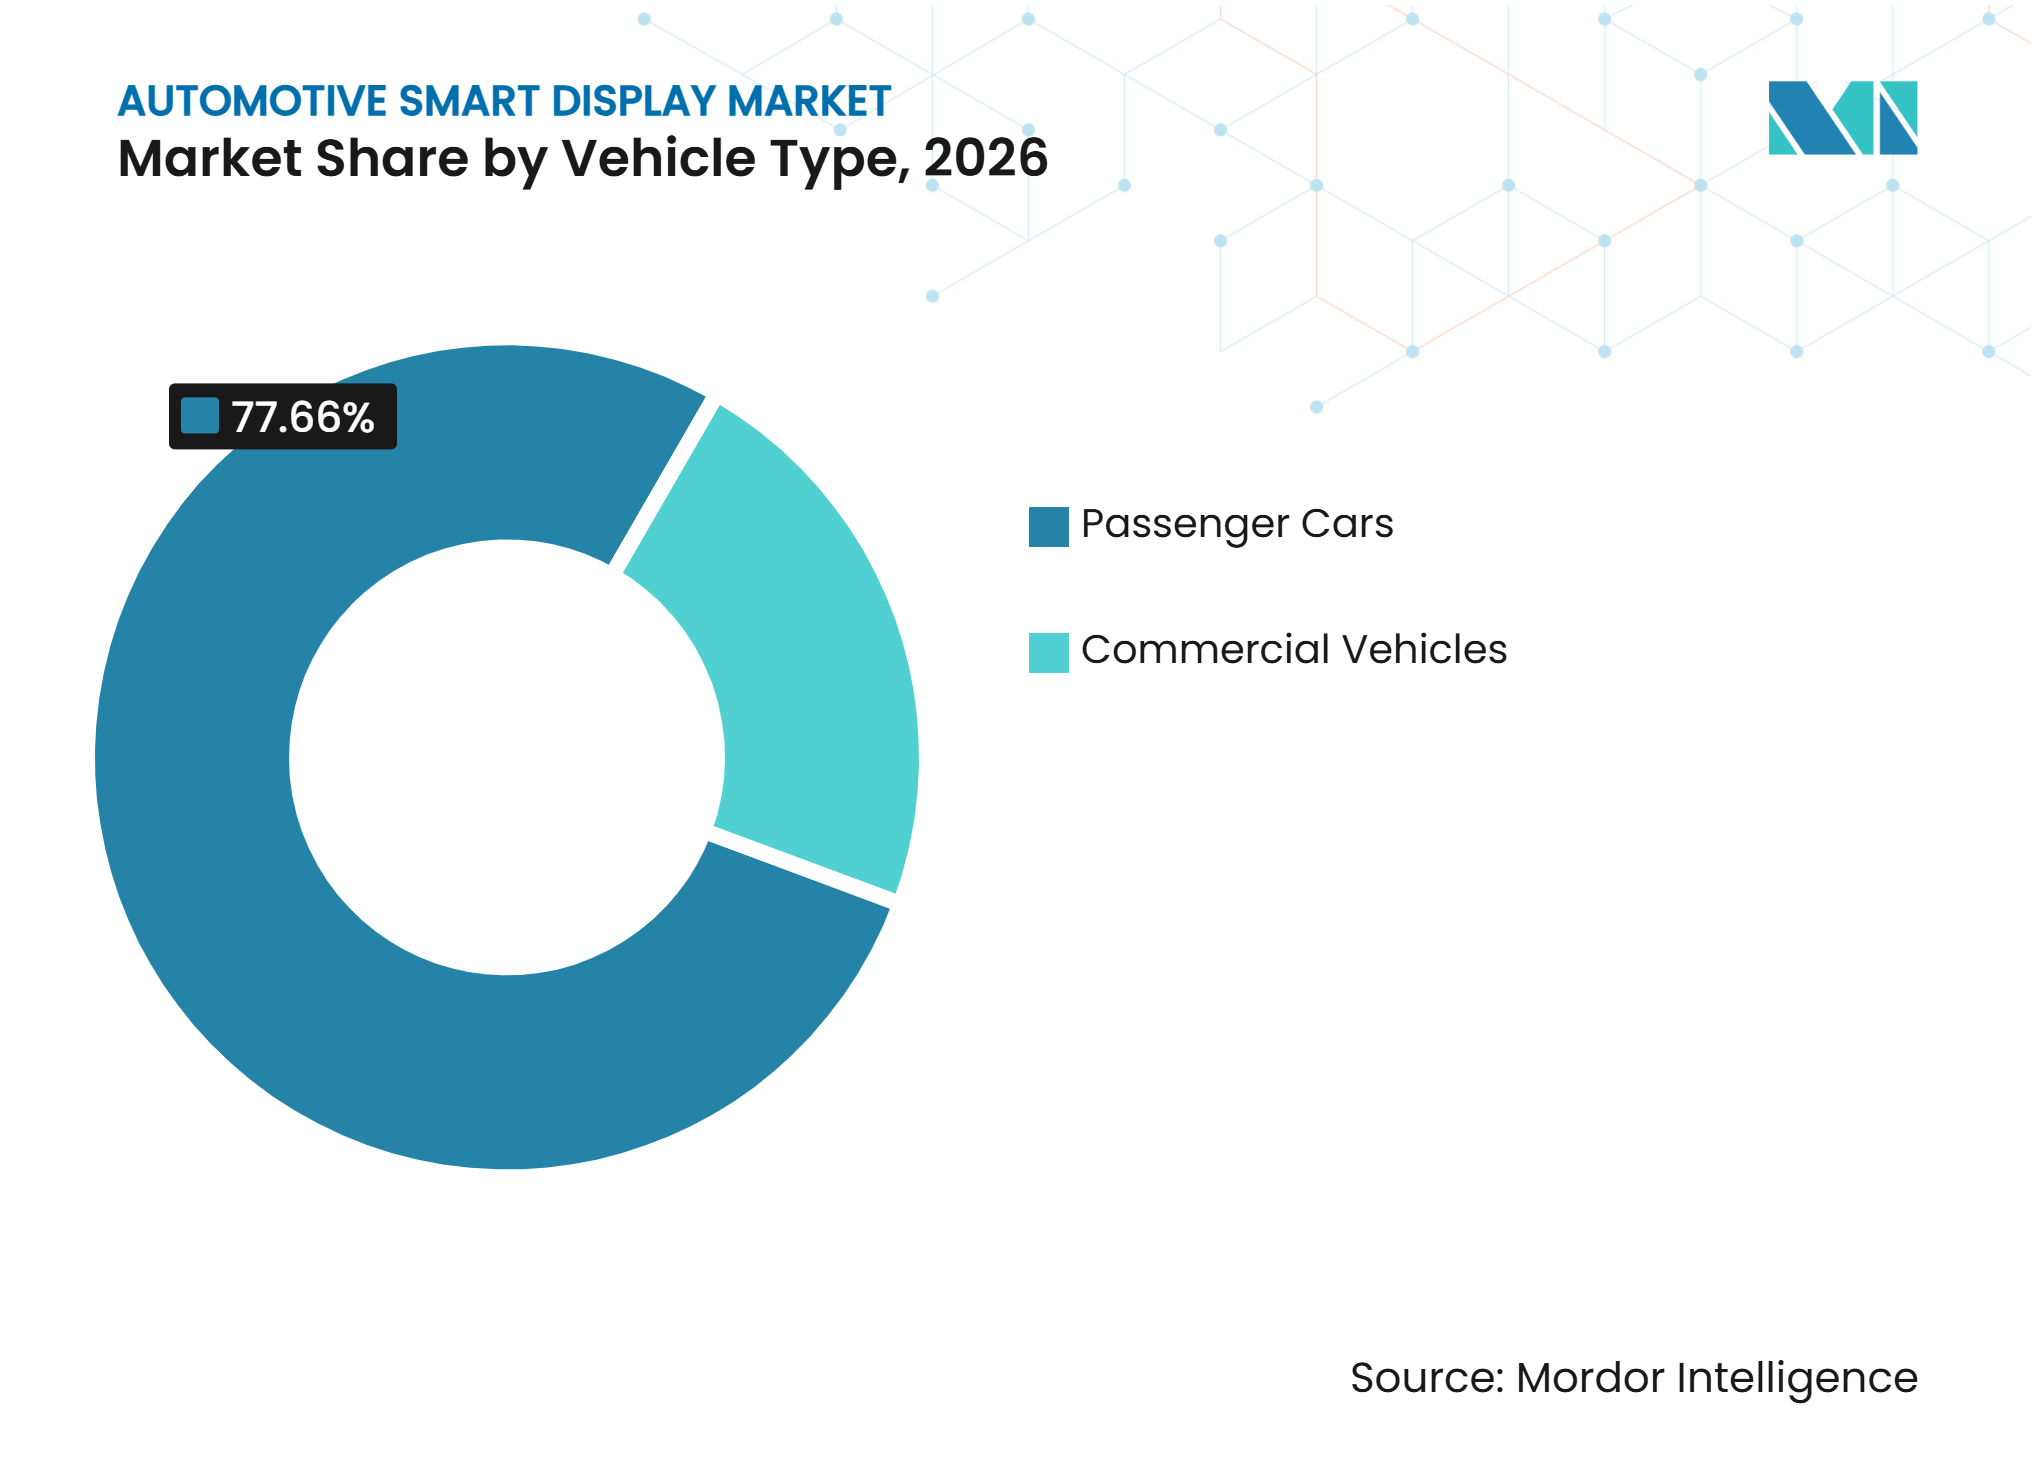
- By vehicle type, passenger cars held 77.66% of the automotive smart display market share in 2026, while commercial vehicles are forecast to grow at an 11.67% CAGR through 2032.
- By propulsion, internal combustion engines (ICEs) held 61.28% of the automotive smart display market share in 2026, while electric vehicles are forecast to grow at a 16.31% CAGR through 2032.
- By geography, Asia-Pacific held 47.32% of the automotive smart display market share in 2026 and is forecast to grow at a 12.05% CAGR through 2032.
Note: Market numbers in this report are based on Mordor Intelligence's proprietary estimation framework, which combines nine months of actuals with Q4 projections for base year 2026.
Market Trends and Insights
Drivers Impact Analysis of Automotive Smart Display Market*
| Driver | (~) % Impact on CAGR Forecast | Geographic Relevance | Impact Timeline |
|---|---|---|---|
| Demand for High-Brightness Displays in EV and ADAS Cockpits | +2.5% | Global, core gains in Asia-Pacific and Europe | Medium term (2–4 years) |
| Display Count and Screen Area per Vehicle | +2.1% | Global | Short term (≤ 2 years) |
| Pillar-to-Pillar and Integrated Cockpit Adoption | +1.8% | China, Europe, spill-over to North America | Medium term (2–4 years) |
| AR-HUD Safety Visualization and Driver-Attention Support | +1.3% | Europe, North America, China | Medium term (2–4 years) |
| Localization of Automotive Display Panel Supply in Asia-Pacific | +1.0% | Asia-Pacific core, spill-over to the Middle East and Africa | Long term (≥ 4 years) |
| OTA-Enabled Monetization of Display Features | +0.7% | Global, early gains in North America and China | Long term (≥ 4 years) |
| Source: Mordor Intelligence | |||
Demand for High-Brightness Displays in EV and ADAS Cockpits
Electric vehicle interiors depend heavily on display surfaces for driving information, range status, navigation, and driver-assistance notifications. These screens must remain clear in direct sunlight and under changing ambient conditions, so brightness, color stability, and viewing angles have become core selection criteria. The automotive smart display market benefits when display requirements are incorporated into vehicle safety and usability specifications rather than treated as a discretionary cabin feature. LG Display began mass production of a pillar-to-pillar automotive display for Sony Honda Mobility's Afeela program in 2025, integrating a large display layout with in-car functions and advanced driver-assistance use cases[1]. This type of program gives suppliers a reason to develop more durable optical designs and provides vehicle makers with a reference point for broader digital cockpit layouts. It also increases the importance of heat control, anti-reflective treatments, and reliable touch performance in production vehicles.
Display Count and Screen Area per Vehicle
The automotive smart display market gains from the rising number of display surfaces fitted in a single vehicle. A center screen, digital cluster, passenger display, and rear-seat display can now be supported by a common cockpit computing approach. This arrangement reduces duplicate electronics and makes broader screen layouts easier to justify in more vehicle classes. Visteon reported record new business wins of USD 7.4 billion in 2025, including USD 3.6 billion for displays and USD 2.1 billion for SmartCore and infotainment programs, indicating that display integration is extending beyond individual premium-car showcases[2]. The change is meaningful because it moves demand from isolated panels toward coordinated hardware and software systems. It also encourages automakers to use common user interface principles across multiple screens, which can simplify the customer experience while expanding the technical scope of each program.
Pillar-to-Pillar and Integrated Cockpit Adoption
Full-width cockpit displays are moving from design demonstrations toward production-focused vehicle programs. They allow an automaker to create a shared visual field across the cluster, center area, and passenger side while keeping information assigned to distinct zones. This design direction supports the automotive smart display market because it expands the display area and raises requirements for bonding, cover glass, and system integration. LG Display's production work for the Afeela platform shows that broad display modules can be engineered for a vehicle environment rather than only for concept cars. The approach is likely to remain most visible in electric and premium models where cabin differentiation carries greater value. It also creates a stronger role for suppliers that can manage the display, the controller, and the vehicle-level validation process as one package.
AR-HUD Safety Visualization and Driver-Attention Support
Head-up displays can place selected driving information within the driver's forward view, reducing the need to look down at a center screen. Augmented reality versions can align route guidance and assistance cues with the road scene when the system is properly designed and validated. This supports the automotive smart display market by making display content part of an active safety-oriented interface rather than a passive information surface. Euro NCAP has set out protocol changes for 2026 that address modern driving risks and evaluate aspects of driver engagement and in-vehicle controls[3]. Vehicle makers can therefore place greater value on display approaches that present essential information clearly and avoid unnecessary distraction. The benefit is tempered by packaging constraints, since a wide-field-of-view unit requires space, optical precision, and careful integration within the dashboard.
Restraints Impact Analysis of Automotive Smart Display Market*
| Restraint | (~) % Impact on CAGR Forecast | Geographic Relevance | Impact Timeline |
|---|---|---|---|
| Automotive-Grade OLED Cost and Yield Constraints | -1.3% | Global, most acute in Europe and North America | Short term (≤ 2 years) |
| Display Supply Concentration and Panel Allocation Risk | -1.0% | Global | Medium term (2–4 years) |
| Thermal, Optical Bonding, and Reliability Complexity in Large Displays | -0.6% | Global | Medium term (2–4 years) |
| Cybersecurity and Functional-Safety Compliance Burden | -0.4% | Europe, expanding globally | Short term (≤ 2 years) |
| Source: Mordor Intelligence | |||
Automotive-Grade OLED Cost and Yield Constraints
OLED can provide high contrast, flexible form factors, and a premium visual appearance, but its automotive use remains limited by production costs and qualification requirements. Manufacturers must demonstrate stable performance across temperature changes, sunlight exposure, humidity, vibration, and long operating periods. These conditions make automotive panels more demanding than many consumer devices and increase the risk that high-end screens will be limited to select vehicle lines. In the automotive smart display market, this favors LCD/TFT, Mini-LED, and other display choices where vehicle makers need mature supply and predictable pricing. The issue is not whether OLED has a role in the cabin, but whether its benefits can be delivered without pushing a vehicle program beyond its cost targets. It also encourages suppliers to maintain multiple technology paths so customers can choose a screen design that matches the intended vehicle price point.
Display Supply Concentration and Panel Allocation Risk
The vehicle display supply chain depends on a limited group of companies capable of manufacturing automotive-grade panels with consistent quality. Automotive volumes may receive less priority than large consumer electronics programs when manufacturing capacity becomes tight. A vehicle maker can therefore face delays if an approved panel source cannot allocate sufficient production capacity for a launch. The automotive smart display market responds to this risk through broader supplier qualification, technology alternatives, and more careful planning between panel producers and cockpit integrators. Large displays add another layer of complexity because they require reliable optical bonding, thermal design, and installation processes that can sustain vehicle use. These constraints can slow the move from a technically appealing display concept to a cost-effective production program.
*Our forecasts treat driver/restraint impacts as directional, not additive. The impact forecasts reflect baseline growth, mix effects, and variable interactions.
Automotive Smart Display Market Segment Analysis
By Display Type:
Center Stack Displays Lead Adoption While HUDs Expand FastestCenter stack/infotainment display held 40.98% of the automotive smart display market share in 2026, underscoring its role as the primary digital control surface in most modern vehicles. It brings navigation, climate settings, media, connectivity, vehicle functions, and other user controls into one visible location. Its position is supported by use across entry, mainstream, and premium models, although screen quality and software functions differ substantially by vehicle class. Digital instrument clusters remain important because drivers expect speed, warning messages, and vehicle status information to be clear and immediately available. Rear-seat entertainment continues to serve selected multipurpose and luxury vehicles, as well as long-distance passenger use cases where content access is permitted. Other display forms, including smart mirrors and passenger displays, remain more specialized because their value depends on a vehicle's architecture and regulatory setting.
Head-up display (HUD/AR-HUD) is forecast to grow at a 10.01% CAGR through 2032, making it the fastest-growing display type in the automotive smart display market. The category is supported by demand for clearer delivery of navigation and driver-assistance information without adding unnecessary attention demands. Standard HUDs offer a more familiar projection format, while AR-HUD systems aim to connect graphics more closely with the outside driving environment. Their wider adoption still depends on optics, windshield compatibility, dashboard space, and reliable calibration across changing conditions. The display type also needs a carefully designed human-machine interface so that important messages remain clear and secondary content does not crowd the driver's view. As these requirements become more central to vehicle development, cockpit suppliers with display, software, and systems-validation capabilities have a meaningful advantage.



By Technology:
LCD/TFT Retains Scale While OLED Targets Premium ProgramsLCD/TFT held 66.52% of the automotive smart display market share in 2026, supported by mature manufacturing, familiar integration processes, and suitability across many vehicle price categories. The technology has a long record in automotive applications and can be engineered for broad temperature ranges, reliable visibility, and durable touch interfaces. Its scale also gives automakers a practical route to add digital functions without committing every program to a premium panel technology. Mini-LED adds higher contrast and local dimming capabilities while keeping many familiar LCD supply-chain characteristics. Micro-LED remains an emerging option because its manufacturing and cost requirements still limit broad deployment. The automotive smart display market therefore continues to rely on a portfolio of technologies rather than a single replacement path.
OLED is forecast to grow at a 10.64% CAGR through 2032, with its strongest position in premium and electric vehicle programs. It offers design flexibility and deep contrast that can support curved screens, distinctive cabin layouts, and high-end visual presentation. Vehicle makers are expected to continue assessing OLED against requirements for durability, thermal behavior, repair, and long-term display consistency. A mixed technology strategy can be useful when a brand wants a premium screen in one model while using advanced LCD or Mini-LED designs in higher-volume lines. Suppliers also need to help vehicle makers judge whether the visual benefit supports the added production complexity. This makes technology selection a product-planning decision as much as a component decision.
By Screen Size:
Mid-Range Displays Remain Common While Larger Formats Reshape CabinsThe 5 to 10 inches category held 56.59% of the automotive smart display market share in 2026, as this size range fits a broad installed base of infotainment and cluster applications. It is suitable for many vehicle interiors where physical packaging, driver reach, and cost discipline influence the final design. The size also enables vehicle makers to update existing dashboards without redesigning the full cockpit around a larger surface. Smaller displays continue to appear in focused control areas, secondary information panels, and vehicle functions that do not require a large interface. Their role is changing as integrated screens reduce the need for separate small displays. The automotive smart display market retains this size range as a practical choice for mainstream vehicle production.
Displays above 10 inches are forecast to grow at an 11.14% CAGR through 2032, driven by panoramic cabins, larger center screens, and passenger-facing display designs. Larger modules can help a vehicle maker present a more unified digital interior and create more room for navigation, entertainment, and assistance information. They also raise the engineering demands associated with heat management, viewing angles, optical bonding, and glare reduction. LG Display's work on a pillar-to-pillar automotive display illustrates how large-format modules are becoming part of defined vehicle programs. This format is likely to be adopted first where interior differentiation and software features are central to the vehicle proposition. Broader use will depend on suppliers' ability to deliver large displays with reliable quality and manageable replacement costs.
By Vehicle Type:
Passenger Cars Lead Demand While Commercial Vehicles Add Functional DisplaysPassenger cars held 77.66% of the automotive smart display market share in 2026, supported by their broad production base and rising expectation for digital cabin functions. Buyers increasingly expect navigation, phone connectivity, rear-view functions, and vehicle settings to work through clear, responsive screens. This has made display quality relevant not only to luxury brands but also to mainstream passenger vehicle planning. Vehicle makers use screen layouts to give each model a recognizable cabin design, although the underlying software and electronic architecture may be shared across several models. Digital clusters and center displays remain particularly important because they combine essential information with everyday controls. The automotive smart display market is therefore strongly tied to passenger-car refresh cycles and the speed at which manufacturers update interior platforms.
Commercial vehicles are forecast to grow at an 11.67% CAGR through 2032, because their cockpit displays often support operational functions rather than only convenience features. Route guidance, fleet communication, driver monitoring, vehicle status, and telematics can all be brought together through a well-designed screen arrangement. A durable interface can help a driver access relevant information without relying on separate devices that compete for cabin space. Visteon secured USD 1.1 billion of new business across commercial vehicle and two-wheeler programs in 2025, including a center information display for a North American heavy-duty truck platform. Commercial applications require a different balance of durability, readability, serviceability, and fleet-system compatibility than passenger cars. That difference gives suppliers an opportunity to develop display systems around the practical needs of transport operators.

By Propulsion:
ICE Retains the Largest Base While EVs Raise Display ContentInternal combustion engines (ICEs) held 61.28% of the automotive smart display market share in 2026, reflecting their continuing place in the global vehicle mix. These vehicles increasingly use screen designs first introduced on electric platforms, especially when a manufacturer shares cockpit components across multiple propulsion options. A common electronics and display architecture can reduce development duplication while preserving a consistent brand experience. Center screens and digital clusters are therefore advancing in ICE models even when the vehicle does not use a new propulsion system. The automotive smart display market benefits from this transfer because it expands the audience for digital cockpit functions. It also means that display suppliers need solutions that can work across a wide range of vehicle platforms and electrical architectures.
Electric vehicles are forecast to grow at a 16.31% CAGR through 2032, making them the fastest-growing propulsion segment. Their cabin layouts often place more emphasis on screen-based controls because vehicle makers can redesign the dashboard around digital interaction. This can increase the importance of large center displays, digital clusters, HUDs, and software-controlled functions. EV buyers may also place greater value on energy information, route planning, charging data, and connected services that need clear display treatment. The result is a closer link between display design, vehicle software, and the everyday ownership experience. The automotive smart display market can gain when EV programs turn the cockpit into a visible point of differentiation, although suppliers must still meet cost and reliability expectations.
Geography Analysis
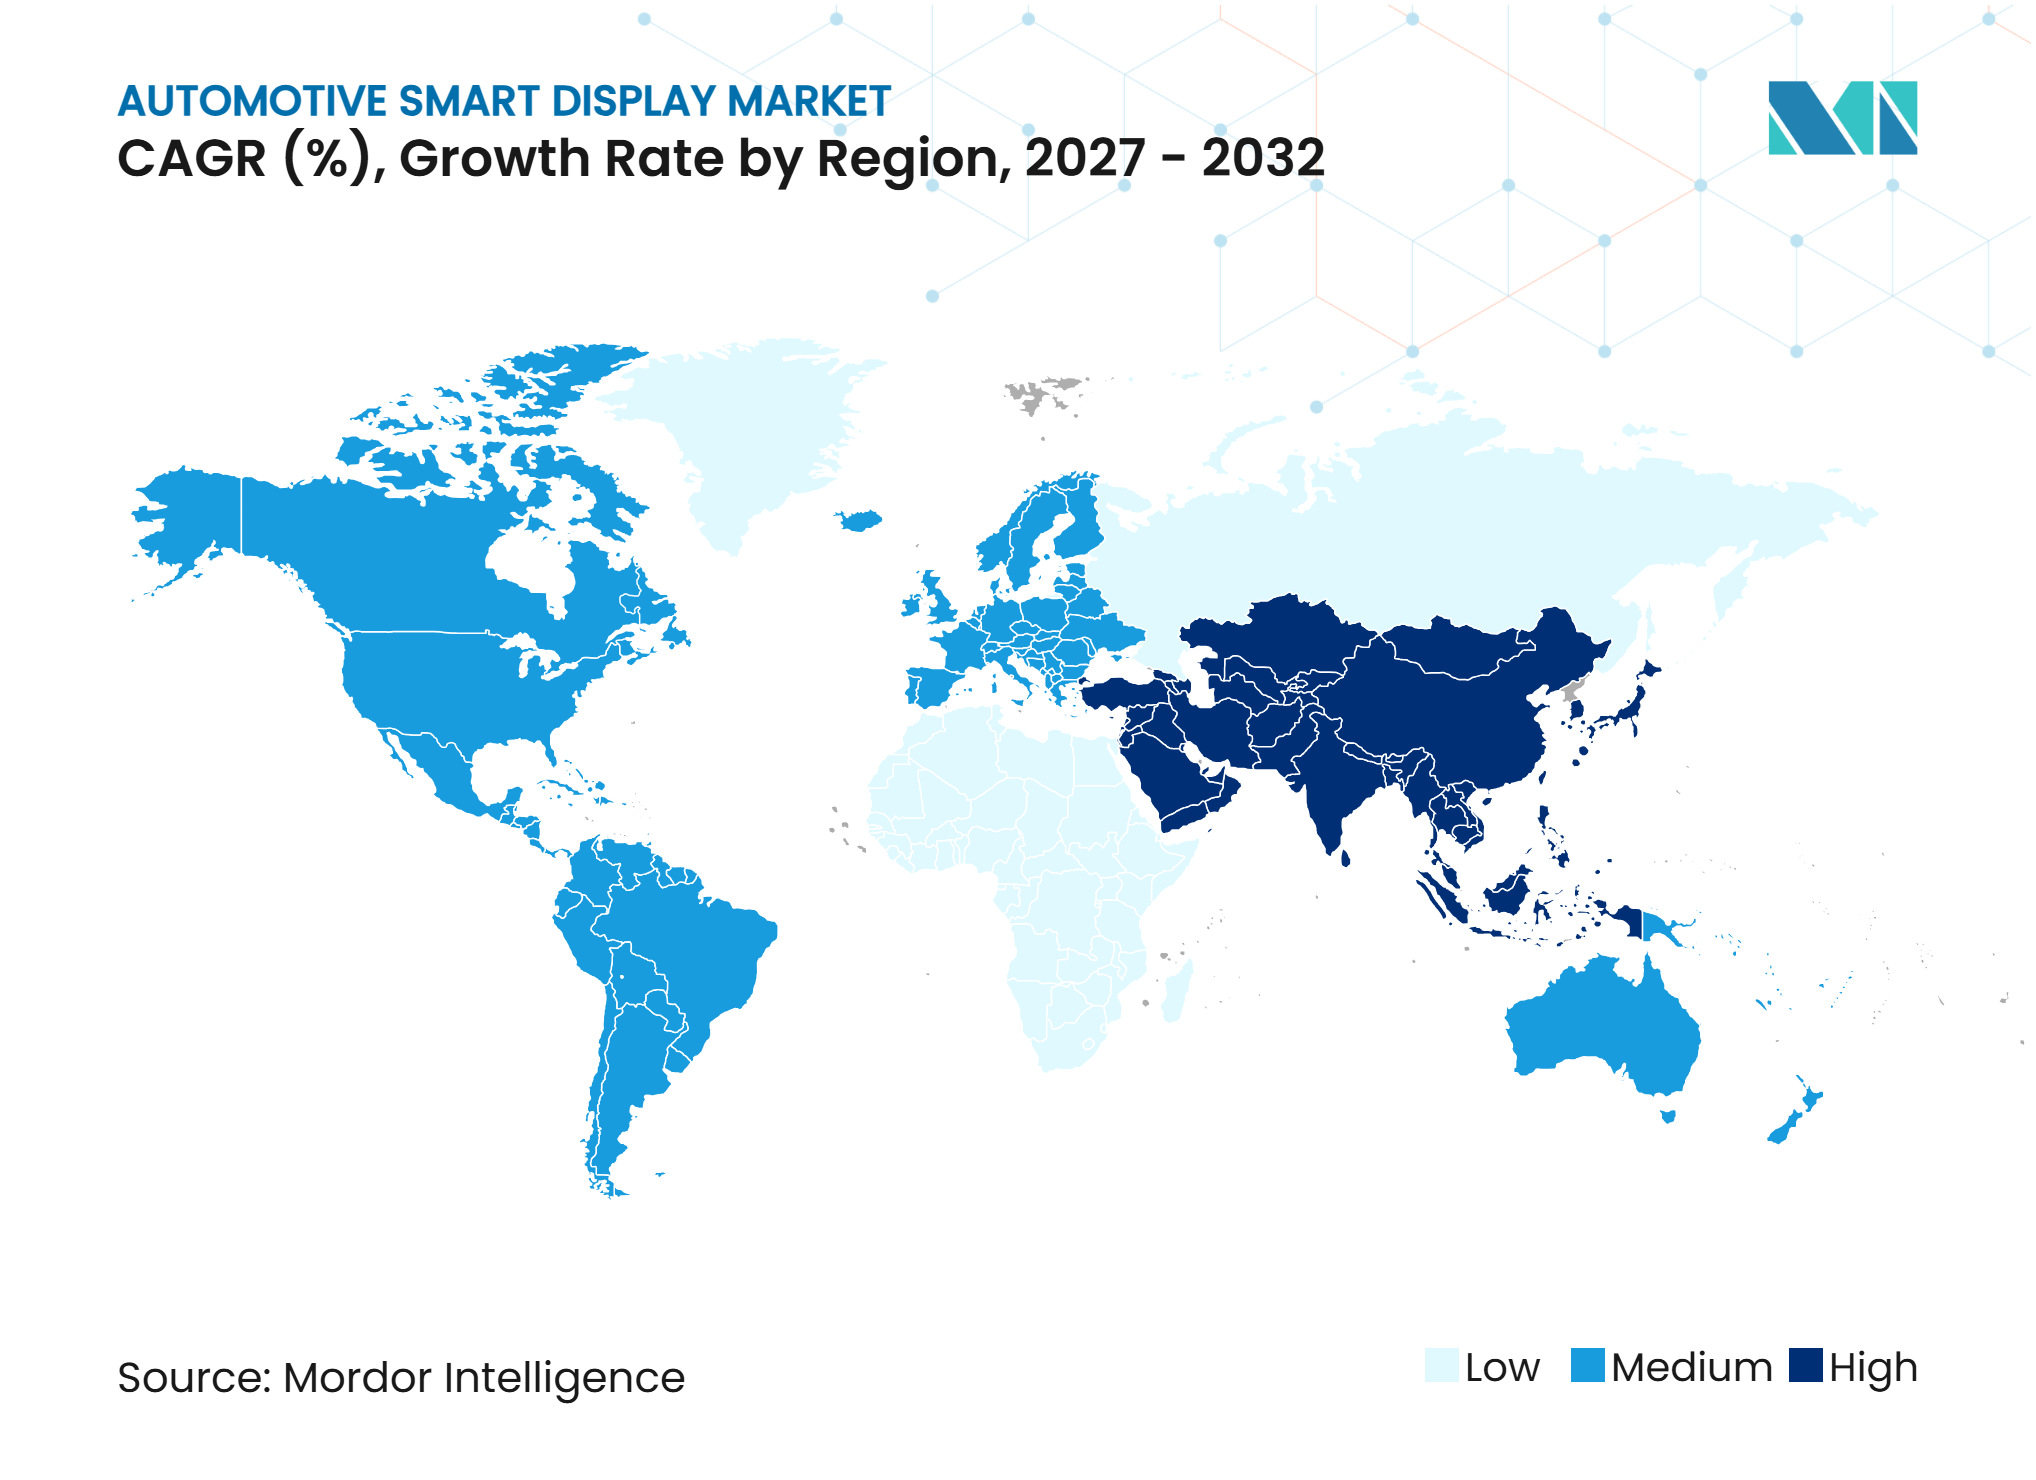
Asia-Pacific held 47.32% of the automotive smart display market share in 2026 and is forecast to grow at a 12.05% CAGR through 2032. The region combines a large vehicle production base, substantial display manufacturing capacity, and strong activity in electric vehicles. China, Japan, and South Korea each contribute different strengths across vehicle manufacturing, panel production, component integration, and digital cockpit development. Local competition encourages vehicle makers to introduce larger screens and more feature-rich cabins across a broad range of models. This creates demand for suppliers that can adapt quickly to model cycles while meeting expectations for brightness, reliability, and user-interface quality. The scale of regional activity also encourages closer working relationships among panel manufacturers, electronics providers, and vehicle makers during the development of new cockpit systems. It can also shorten feedback loops during validation.
China is especially important because display supply and vehicle demand are closely linked within the same regional ecosystem. Domestic vehicle makers are using multi-screen layouts and connected cockpit features to differentiate their models in a competitive market. Japan and South Korea bring established strengths in electronics, materials, display manufacturing, and vehicle engineering. These capabilities support the automotive smart display market through regional supply relationships as well as exports to global vehicle programs. The region's advantage does not remove supply risk, since automakers still need dependable quality control and continuity across complex panel and electronics supply chains. Automakers must also ensure that a fast-moving feature strategy does not weaken the consistency, repairability, or long-term usability expected from an automotive product.
Europe is expected to remain a significant development center for premium, electrified, and safety-focused vehicle programs. Automakers in the region often set cockpit requirements that can later be used in production programs in other markets. North America continues to favor connected software platforms, advanced driver-assistance functions, and large-format cockpit layouts in selected vehicle categories. South America, the Middle East, and Africa offer more selective opportunities where suppliers can match product design to local vehicle demand, high temperatures, or aftermarket requirements. Across these regions, the automotive smart display market is expected to depend on suppliers' ability to adapt a common technology base to differing regulatory expectations, infrastructure conditions, and vehicle price points. A display system that works well in one region may need different brightness, language, connectivity, or service considerations before it can be used successfully in another.
Competitive Landscape
Market Concentration
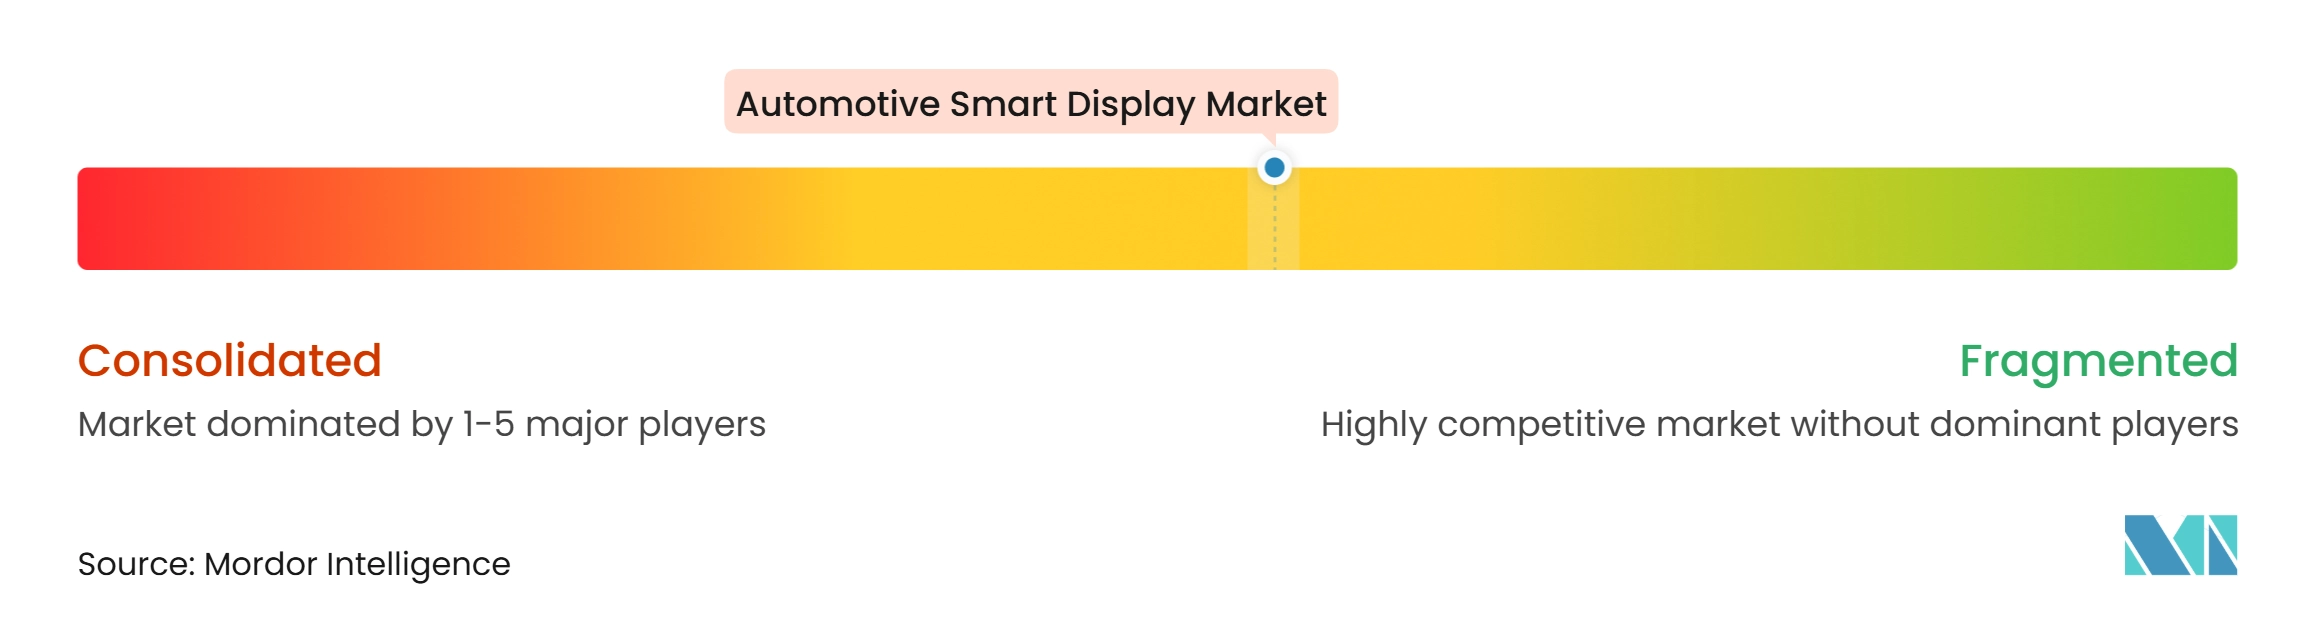
The automotive smart display market is moderately concentrated, as competition is divided between panel makers and cockpit system integrators and no small group of suppliers controls the market. Panel suppliers compete through display technology, manufacturing capability, optical performance, and cost discipline. Cockpit integrators compete through controllers, software, human-machine interface design, and vehicle-level integration. These roles are becoming less distinct as vehicle makers seek more integrated cockpit modules from fewer suppliers. Established automotive validation experience remains valuable because screens must meet vehicle safety, cybersecurity, environmental, and service requirements. This creates a meaningful hurdle for companies that have strong display technology but limited experience with the full vehicle development and approval process.
Companies such as BOE Technology Group, Tianma Microelectronics, AUO Corporation, Japan Display Inc., and LG Display are relevant at the panel layer. Visteon Corporation, Valeo, Hyundai Mobis, and DENSO have roles in cockpit electronics and systems integration. LG Display's pillar-to-pillar production work for the Afeela platform is an example of a supplier aligning a large display module with a defined vehicle program. Visteon's April 2025 collaboration with Qualcomm on an AI-enabled cockpit system, combining its cognitoAI framework with the Snapdragon Cockpit Elite platform, shows the move toward shared computing that supports several display functions. These actions indicate that competitive strength increasingly rests on the ability to connect visual hardware with software and the broader vehicle architecture. A supplier that can coordinate these elements can help reduce integration effort for the automaker and provide a clearer route from a design objective to a production-ready cockpit.
Valeo and Ennostar introduced a Mini-LED exterior display application at IAA Mobility 2025, showing that display technology is also being explored for communication beyond the cabin. This type of development can open new use cases, but it also brings requirements for durability, safety, and clear communication with road users. Suppliers with a mature automotive quality process can use that experience to support new display applications, while newer entrants may need more time to meet vehicle approval expectations. Competitive opportunities remain in commercial vehicles, where functional cockpit displays can be tailored for fleets, and in regions where local climate conditions influence display specifications. As procurement moves toward complete cockpit solutions, panel-only suppliers may need closer partnerships with electronics and software companies to remain central to vehicle programs. The competitive result is likely to favor flexible collaborations that can support different screen formats and interface requirements without forcing every automaker into the same solution.
Automotive Smart Display Industry Leaders
-
BOE Technology Group Co., Ltd.
-
Tianma Microelectronics Co., Ltd.
-
AUO Corporation
-
Visteon Corporation
-
LG Display Co., Ltd.
- *Disclaimer: Major Players sorted in no particular order
Automotive Smart Display Market Companies Covered in this Report
- AUMOVIO SE
- Robert Bosch GmbH
- Visteon Corporation
- LG Display Co., Ltd.
- Samsung Electronics Co., Ltd.
- BOE Technology Group Co., Ltd.
- AUO Corporation
- Japan Display Inc.
- Sharp Corporation
- Panasonic Holdings Corporation
- DENSO CORPORATION
- Nippon Seiki Co., Ltd.
- Alps Alpine Co., Ltd.
- Valeo SE
- Marelli Holdings Co., Ltd.
- Desay SV Automotive Co., Ltd.
- Hyundai Mobis Co., Ltd.
- Tianma Microelectronics Co., Ltd.
- Innolux Corporation
Recent Industry Developments in Automotive Smart Display Market
- October 2026: PACCAR announced that PACCAR Connect, a factory-installed touchscreen platform with a 13-inch display on Peterbilt and a 15-inch center display on Kenworth Class 8 trucks, will become standard from early 2027.
- September 2026: Himax Technologies introduced the HX83196 and HX83197 automotive TDDI chips with an embedded eDP interface, supporting single panels up to 17 inches at 3K resolution and cascaded displays up to 30 inches.
- January 2026: LG Display showcased its automotive display lineup at CES 2026, including a 51-inch pillar-to-pillar display and a slidable OLED display for vehicle cockpits.
- January 2026: Tianma presented its Smart Cockpit 7.0 platform at CES 2026, together with HUD solutions and a 49.6-inch 8K curved automotive display.
Global Automotive Smart Display Market Report Scope
The Automotive Smart Display Market is segmented by Display Type, Technology, Screen Size, Vehicle Type, Propulsion, and Geography. By Display Type, the market is segmented into Center Stack/Infotainment Display, Digital Instrument Cluster, Head-Up Display (HUD/AR-HUD), Rear-Seat Entertainment, and Others (Smart Mirror and Passenger Display). By Technology, the market is segmented into LCD/TFT, OLED, Mini-LED, and Micro-LED. By Screen Size, the market is segmented into Less than 5 Inches, 5 to 10 Inches, and Above 10 Inches. By Vehicle Type, the market is segmented into Passenger Cars and Commercial Vehicles. By Propulsion, the market is segmented into Internal Combustion Engines (ICEs) and Electric Vehicles. By Geography, the market is segmented into North America (United States, Canada, and Rest of North America), Europe (Germany, United Kingdom, France, Italy, Spain, Russia, and Rest of Europe), Asia-Pacific (China, Japan, India, South Korea, Australia, Indonesia, Thailand, and Rest of Asia-Pacific), South America (Brazil, Argentina, and Rest of South America), and Middle East and Africa (Saudi Arabia, United Arab Emirates, Israel, Egypt, South Africa, Nigeria, and Rest of Middle East and Africa). Pillar-to-pillar display modules are allocated to the Center Stack/Infotainment Display segment. Market forecasts are provided in terms of Value (USD) and Volume (Units).
Segmentation Overview
| Center Stack/Infotainment Display |
| Digital Instrument Cluster |
| Head-Up Display (HUD/AR-HUD) |
| Rear-Seat Entertainment |
| Others (Smart Mirror and Passenger Display) |
| LCD/TFT |
| OLED |
| Mini-LED |
| Micro-LED |
| Less than 5 Inches |
| 5 to 10 Inches |
| Above 10 Inches |
| Passenger Cars |
| Commercial Vehicles |
| Internal Combustion Engines (ICEs) |
| Electric Vehicles |
| North America | United States |
| Canada | |
| Rest of North America | |
| Europe | Germany |
| United Kingdom | |
| France | |
| Italy | |
| Spain | |
| Russia | |
| Rest of Europe | |
| Asia-Pacific | China |
| Japan | |
| India | |
| South Korea | |
| Australia | |
| Indonesia | |
| Thailand | |
| Rest of Asia-Pacific | |
| South America | Brazil |
| Argentina | |
| Rest of South America | |
| Middle East and Africa | Saudi Arabia |
| United Arab Emirates | |
| Israel | |
| Egypt | |
| South Africa | |
| Nigeria | |
| Rest of Middle East and Africa |
| By Display Type | Center Stack/Infotainment Display | |
| Digital Instrument Cluster | ||
| Head-Up Display (HUD/AR-HUD) | ||
| Rear-Seat Entertainment | ||
| Others (Smart Mirror and Passenger Display) | ||
| By Technology | LCD/TFT | |
| OLED | ||
| Mini-LED | ||
| Micro-LED | ||
| By Screen Size | Less than 5 Inches | |
| 5 to 10 Inches | ||
| Above 10 Inches | ||
| By Vehicle Type | Passenger Cars | |
| Commercial Vehicles | ||
| By Propulsion | Internal Combustion Engines (ICEs) | |
| Electric Vehicles | ||
| By Geography | North America | United States |
| Canada | ||
| Rest of North America | ||
| Europe | Germany | |
| United Kingdom | ||
| France | ||
| Italy | ||
| Spain | ||
| Russia | ||
| Rest of Europe | ||
| Asia-Pacific | China | |
| Japan | ||
| India | ||
| South Korea | ||
| Australia | ||
| Indonesia | ||
| Thailand | ||
| Rest of Asia-Pacific | ||
| South America | Brazil | |
| Argentina | ||
| Rest of South America | ||
| Middle East and Africa | Saudi Arabia | |
| United Arab Emirates | ||
| Israel | ||
| Egypt | ||
| South Africa | ||
| Nigeria | ||
| Rest of Middle East and Africa | ||
Key Questions Answered in the Report
How large is the automotive smart display market?
The automotive smart display market was valued at USD 14.43 billion in 2026 and is expected to reach USD 24.81 billion by 2032, at a CAGR of 9.45% during 2027-2032.
What is driving demand for automotive smart displays?
Demand is supported by digital cockpit design, connected functions, driver-assistance information, and the wider use of screen-based controls in passenger and electric vehicles.
Which automotive smart display type leads current adoption?
Center stack/infotainment display leads current adoption, with a 40.98% share in 2026, because it brings key vehicle controls, connectivity, and navigation into one interface.
Why are head-up displays gaining importance in vehicles?
HUDs can present selected driving and navigation information in the driver's forward view. HUD/AR-HUD is forecast to grow at a 10.01% CAGR through 2032.
Which display technology is most widely used in vehicles?
LCD/TFT held a 66.52% share in 2026, supported by mature supply, broad vehicle suitability, and established automotive qualification experience.