Austria Data Center Market Size and Share
Market Overview
| Study Period | 2020 - 2031 |
|---|---|
| Forecast Data Period | 2026 - 2031 |
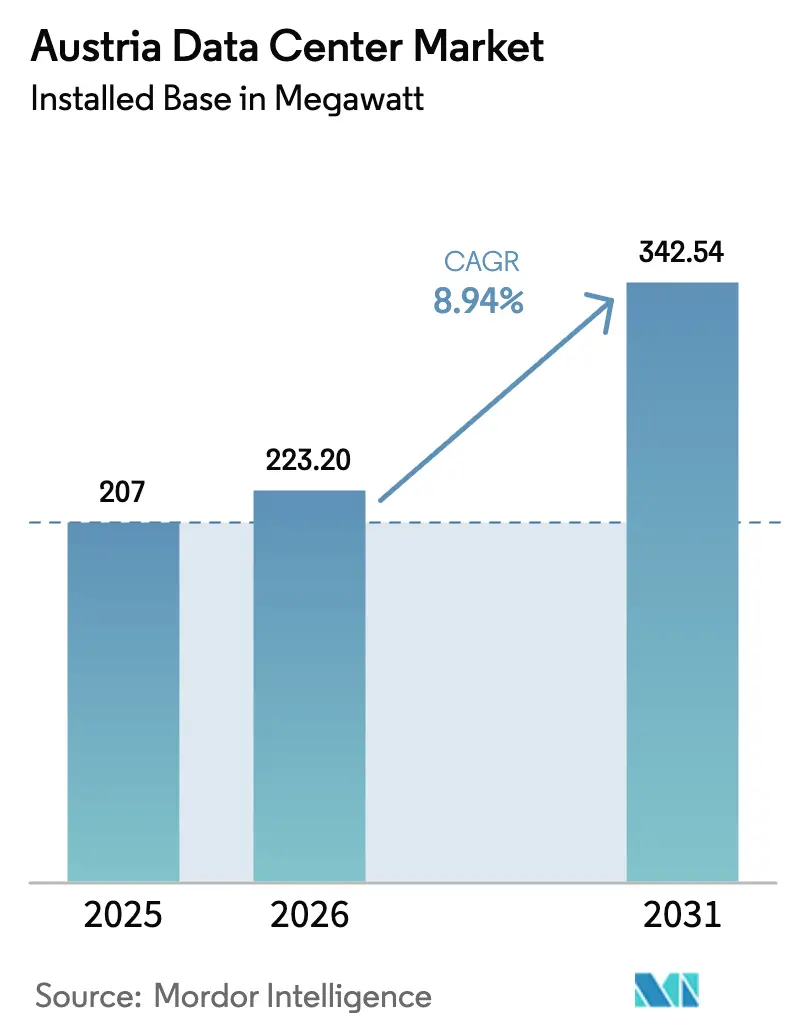
| Base Year Market Size (2025) | 207 megawatt |
| Market Volume (2026) | 223.20 megawatt |
| Market Volume (2031) | 342.54 megawatt |
| Growth Rate (2026 - 2031) | 8.94% CAGR |
| Market Concentration | Medium |
Major Players *Disclaimer: Major Players sorted in no particular order Image © Mordor Intelligence. Reuse requires attribution under CC BY 4.0. | |
Austria Data Center Market Analysis by Mordor Intelligence
The Austria data center market size in terms of installed base is projected to expand from 207 megawatt in 2025 and 223.20 megawatt in 2026 to 342.54 megawatt by 2031, registering a CAGR of 8.94% between 2026 to 2031. The market’s growth is anchored in Vienna’s colocation core while large-scale cloud providers accelerate hyperscale builds in surrounding Lower Austria. Operators are racing to secure renewable-backed power purchase agreements, tighten energy efficiency, and integrate waste heat into district heating networks. Grid bottlenecks on the west-east corridor, escalating construction costs linked to Austria’s green steel transition, and a shortage of contiguous land parcels within Vienna temper the otherwise upbeat trajectory. Competitive dynamics remain moderate as Digital Realty, NTT Global Data Centers, and A1 Telekom Austria defend their carrier-neutral strongholds even as Microsoft’s self-built Azure Austria East region and edge-focused newcomers such as AtlasEdge reshape demand composition.
Key Report Takeaways
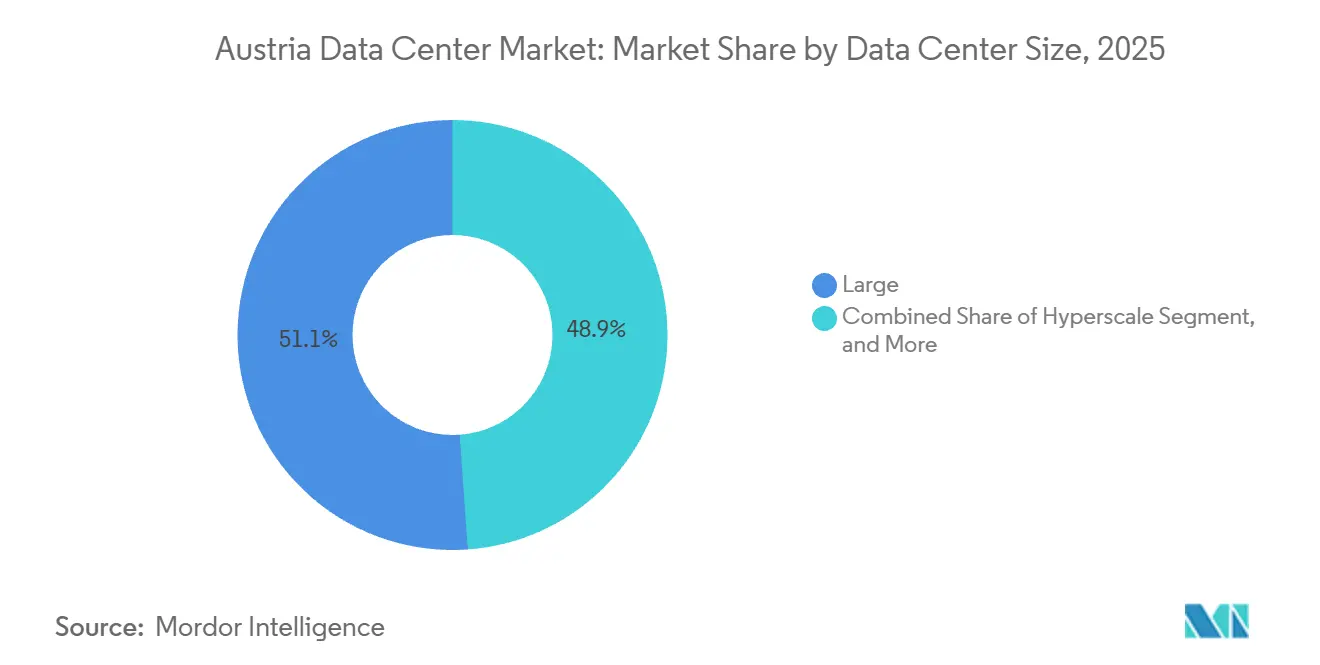
- By data center size, large facilities led with 51.14% of Austria data center market share in 2025, while hyperscale deployments are forecast to expand at a 9.21% CAGR through 2031.
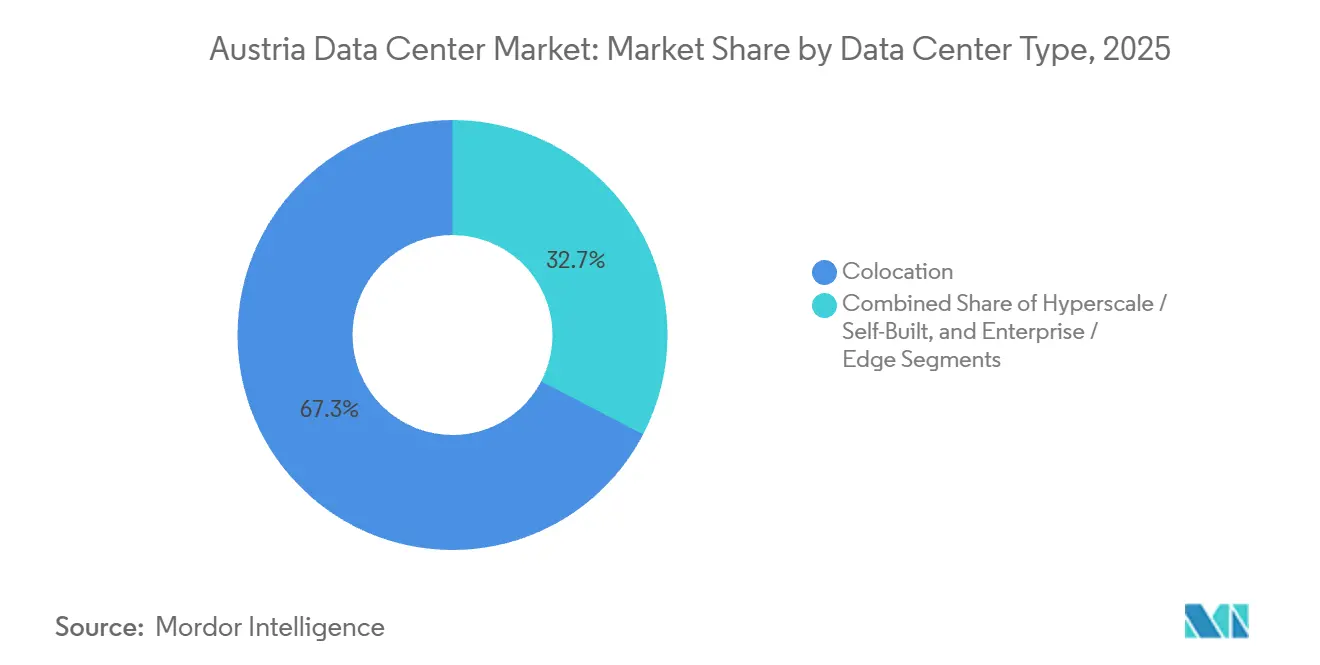
- By data center type, colocation accounted for 67.35% of the Austria data center market in 2025, whereas hyperscale and self-built projects are set to grow at a 9.76% CAGR through 2031.
- By tier type, tier 3 facilities accounted for 54.15% of IT load in 2025, while tier 4 installations are advancing at a 9.42% CAGR through 2031.
- By end user, IT and ITES held 44.06% of Austria data center market share in 2025, whereas BFSI is the fastest-growing vertical at a 10.16% CAGR owing to upcoming DORA compliance deadlines.
- By hotspot, Vienna commanded 74.24% of Austria data center market size in 2025, yet the Rest of Austria is projected to grow at a 9.68% CAGR over 2026-2031.
Note: Market size and forecast figures in this report are generated using Mordor Intelligence’s proprietary estimation framework, updated with the latest available data and insights as of 2026.
Austria Data Center Market Trends and Insights
Drivers Impact Analysis*
| Driver | (~) % Impact on CAGR Forecast | Geographic Relevance | Impact Timeline |
|---|---|---|---|
| Surge in Hyperscale Investment Commitments Post-2025 | +2.1% | Vienna and Lower Austria, spillover to Burgenland and Styria | Medium term (2-4 years) |
| Growth of Renewable-Energy Backed PPAs | +1.5% | National, focused in Burgenland wind and Lower Austria hydro corridors | Long term (≥ 4 years) |
| Government Incentives for Digital Infrastructure | +1.2% | National, Vienna and regional technology parks prioritized | Short term (≤ 2 years) |
| Rising Demand for Low-Latency Edge Nodes from Industry 4.0 Factories | +1.8% | Upper Austria, Styria, Vienna smart manufacturing zones | Medium term (2-4 years) |
| Corporate PPAs for On-Site Micro-Data Centers in Logistics Hubs | +0.9% | Vienna logistics zones, Graz freight corridors, Salzburg distribution centers | Medium term (2-4 years) |
| AI-Driven Cooling Retrofits Unlocking Stranded Capacity | +1.3% | Vienna legacy sites, Tier 3 facilities in Graz and Linz | Short term (≤ 2 years) |
| Source: Mordor Intelligence | |||


Surge in Hyperscale Investment Commitments Post-2025
Microsoft’s USD 1.13 billion Azure Austria East region, live since August 2025, created Austria’s first three-zone cloud region and forced local utilities to deliver a dedicated 110 kV substation within 18 months, proving that large capital can overcome permitting complexity. Digital Realty followed in April 2025 with a 40 MW Vienna facility that pairs wholesale colocation suites with Azure ExpressRoute, signaling a hybrid-cloud land grab. Vienna’s bid to host an EU AI Gigafactory demands more than 100,000 AI processors and up to USD 5.65 billion in capex, although 76 cities vie for the award and final selection runs into 2026. The concentration of announcements since 2024 eclipses the prior decade’s steady but modest 10% annual capacity growth, suggesting an inflection so long as grid connections keep pace.
Growth of Renewable-Energy Backed Power Purchase Agreements
Austria generated 95% of its electricity from renewables in 2024, second only to Norway within the EU, providing operators with an inherent decarbonization edge.[1] European Commission, “Digital Decade Policy Programme,” europa.euBurgenland secured a USD 282.5 million European Investment Bank loan for 2 GW of new wind and solar, a pipeline that underpins long-term PPAs for future facilities.[2]European Investment Bank, “Burgenland Renewable Energy Financing,” eib.orgDigital Realty already operates Vienna sites on 100% green power, and Wien Energie’s concept for the planned AI Gigafactory feeds server waste heat into municipal district heating, monetizing a former liability. Yet voestalpine’s USD 1.7 billion green-steel furnaces will consume 24.9 TWh annually by 2027, tightening renewable supply and putting upward pressure on wholesale prices that data centers also must pay. Austrian Power Grid’s USD 9 billion decade-long upgrade program aims to remove bottlenecks, but permitting disputes over wildlife protection are slowing the construction of new high-voltage lines.
Government Incentives for Digital Infrastructure
The Digital Decade roadmap commits USD 1.58 billion to broadband and data infrastructure through 2030, while the PIA 2030 initiative offers fast-track permitting and tax rebates to projects meeting sustainability thresholds. Vienna’s economic agency coordinated letters of intent from technology partners to bolster its bid for an AI Gigafactory, illustrating multilevel government alignment. However, Austria’s Investment Control Act imposes foreign investment screening, which can slow the entry of non-EU hyperscalers, and the EU Energy Efficiency Directive requires 24 environmental KPIs for every facility with an IT load above 500 kW, adding compliance overhead but increasing transparency.
Rising Demand for Low-Latency Edge Nodes from Industry 4.0 Factories
Austria hosted only 30 edge nodes in 2024, against an EU-wide 10,000-node target for 2030, signaling vast white space for micro-data centers. Eaton’s Schrems smart factory and the smartfactory@tugraz testbed both rely on on-premise compute for predictive maintenance and digital twins, proving industrial appetite for sub-10 millisecond latency. Automotive and machinery clusters in Upper Austria and Styria are now trialing computer-vision quality control that demands edge computing capacity near assembly lines. Coordinated rollouts among telecom providers, industrial consortia, and real estate developers will determine whether Austria meets the EU’s node target on schedule.
Restraints Impact Analysis*
| Restraint | (~) % Impact on CAGR Forecast | Geographic Relevance | Impact Timeline |
|---|---|---|---|
| Limited Availability of Large Contiguous Land Parcels Around Vienna | -1.4% | Vienna and inner suburbs, pressure extends to Lower Austria | Medium term (2-4 years) |
| Rising Construction-Material Costs Due to Green-Steel Transition | -0.8% | National, acute in Vienna and Graz high-cost zones | Short term (≤ 2 years) |
| Grid-Connection Queue Delays Tied to Cross-Border Power Flows | -1.1% | Vienna and Lower Austria, bottlenecks at German and Czech interconnects | Long term (≥ 4 years) |
| Increasing Scrutiny Over Water-Usage Rights in Alpine Regions | -0.6% | Vienna and Alpine municipalities, focus on groundwater cooling | Medium term (2-4 years) |
| Source: Mordor Intelligence | |||
Limited Availability of Large Contiguous Land Parcels Around Vienna
Eighty-four percent of Austria’s capacity sits inside Vienna, where suitable greenfield plots above 10,000 square meters are scarce and costly, averaging USD 11 million per MW, the eighth highest in Europe.[3]Vienna.at Staff, “Rising Demand, Too Few IT Specialists and Data Centers in Vienna,” vienna.atThe Austrian Data Center Association warned in July 2025 that projects have already been redirected to Warsaw and Milan, where land and grid access are cheaper. Microsoft located its Azure Austria East data center in Lower Austria to sidestep these constraints while retaining sub-2-millisecond latency to the capital. Operators now scout Graz, Linz, and Salzburg, but those secondary cities cannot yet match Vienna’s dense fiber footprint, forcing a trade-off between cost and connectivity.
Rising Construction-Material Costs Due to Green-Steel Transition
voestalpine’s electric arc furnaces will push green steel prices higher as producers pass through renewable-power premiums, adding as much as 6.5% to data center construction budgets measured in 2023. Austria’s Renewable Heat Act simultaneously bans fossil-fuel boilers in new buildings, requiring electric chillers or district heating connections that lift upfront capex. Equipment lead times for transformers and chillers lengthened during 2024, extending build schedules and delaying revenue realization for new sites. Operators that can design with prefabricated modules and alternative materials may offset some of these cost pressures, but will still confront elevated steel pricing until supply normalizes post-2027.
*Our forecasts treat driver/restraint impacts as directional, not additive. The impact forecasts reflect baseline growth, mix effects, and variable interactions.
Segment Analysis
By Data Center Size: Hyperscale Deployments Accelerate Amid Enterprise Consolidation
Hyperscale facilities are forecast to expand at a 9.21% CAGR from 2026 to 2031, outpacing the Austria data center market. Digital Realty’s planned 40 MW third Vienna site represents the largest single-site addition and exemplifies the pivot toward AI-ready density. Microsoft’s three-building Azure Austria East cluster, operational in 2025, validated Lower Austria as a viable alternative to the land-constrained capital. Large data centers maintained 51.14% Austria data center market share in 2025, underscoring Vienna’s entrenched enterprise and retail colocation base. Medium-sized halls remain relevant for regional enterprises needing localized data residency, while small edge nodes flourish near Upper Austria and Styria’s Industry 4.0 corridors. Although edge nodes multiply in absolute sites, their sub-1 MW power envelopes temper their influence on aggregate Austria data center market size.
The hyperscale wave intensifies bargaining leverage over utilities and forces colocation incumbents to differentiate via interconnection density and hybrid-cloud services. Existing large and medium facilities attempt brownfield capacity additions that bypass new-build land scarcity yet confront grid connection queues. Price tension arises as hyperscalers seek wholesale or powered-shell terms at scale, challenging the margins of operators optimized for high-density retail colocation.


By Tier Type: Tier 4 Gains Traction As AI Workloads Demand Higher Uptime
Tier 3 sites dominated with 54.15% of IT load in 2025, a legacy of Austria’s cautious financial and public-sector clientele. The emergence of AI and HPC workloads that exploit GPU clusters has pushed hyperscalers to embrace Tier 4 redundancy, boosting Tier 4 capacity at a forecast 9.42% CAGR. Microsoft’s Lower Austria buildings apply 2N power feeds and concurrently maintainable cooling loops to achieve 99.995% availability. Digital Realty positions its Vienna campus on the cusp of Tier 3 and Tier 4, offering 99.999% SLA guarantees and N+1 cooling redundancy, appealing to hybrid cloud tenants. Tier 1 and Tier 2 halls retreat as tenants requiring basic hosting migrate to public cloud or modern colocation, trimming share but still serving cost-sensitive archival and disaster-recovery use cases.
Uptime Institute certification remains a badge of assurance for regulated sectors. Operators weighing an upgrade from Tier 3 to Tier 4 must justify an estimated 25% to 40% capex premium through price uplift or long-term hyperscale anchor deals. The new EU sustainability reporting rule heightens scrutiny of power usage effectiveness, magnifying the opex impact of over-provisioned redundancy unless offset by efficient cooling designs.
By Data Center Type: Colocation Dominance Faces Hyperscale Disruption
Colocation retained a 67.35% hold on the Austria data center market in 2025, cemented by Vienna’s carrier-neutral hubs. Hyperscale and self-built strategies, however, are charted to grow at a 9.76% CAGR. Microsoft’s in-house build in Lower Austria highlights the preference of large cloud providers for owning the stack, from power transformers to security fencing. Retail colocation racks remain essential for SMEs that need managed services and interconnection with telecom and content partners. Wholesale colocation bridges the gap by enabling cloud providers to lease large, contiguous footprints within a multi-tenant campus. Rising energy prices have already pushed European rack rates up to 51% above 2022 levels, squeezing price-sensitive users back toward self-build or cloud consumption models.
Vienna’s dense fiber network and Vienna Internet Exchange’s 169 connected networks underpin colocation’s stickiness, yet future growth hinges on operators’ ability to furnish direct cloud on-ramps, extend renewable PPAs, and monetize waste heat. Edge and enterprise on-premise builds continue to multiply, but their micro-scale means they add local resilience more than national capacity.
By End User: BFSI Leads Growth As DORA Compliance Drives Cloud Migration
The BFSI segment is projected to grow at a 10.16% CAGR through 2031, eclipsing the overall Austria data center market. Austrian banks face DORA’s operational resilience mandates, which favor multi-availability-zone architectures. Erste Group’s rising IT spend underscores the shift. IT and ITES retained 44.06% of load capacity in 2025, reflecting early mover status into colocation for network optimization. Manufacturing demand blossoms around Linz and Graz as Industry 4.0 projects deploy edge analytics, while government workloads continue to occupy Tier 3 sovereign facilities for e-government services. Media, e-commerce, and telecom each expand steadily, but BFSI’s regulatory urgency secures its position as the fastest ascender.
Advances in healthcare, logistics, and media are also reshaping capacity design. Hospitals involved in nationwide e-health initiatives increasingly request encrypted, on-premises disaster-recovery nodes that can replicate patient records in real time to Tier 3 data centers, pushing operators to advertise HIPAA-aligned certifications and low-latency metro links. Global streaming platforms, meanwhile, deploy caching clusters in Vienna to shorten video start times for Central European viewers, creating steady demand for 20-30 kW racks even though this cohort still holds a modest portion of the Austria data center market size. Logistics firms digitizing warehouse operations in the Graz–Salzburg freight corridor have begun contracting micro-data centers for yard-management analytics and automated-guided vehicles, reinforcing the relevance of edge nodes outside Vienna. Finally, telecom operators running 5G standalone cores inside captive facilities are offloading non-critical workloads into carrier-neutral sites, a pattern that marginally reduces their Austria data center market share but frees capital for nationwide radio-access upgrades.
Geography Analysis
Vienna accounted for 74.24% of installed IT load in 2025, powered by Digital Realty’s 31,300 square-meter campus, NTT’s 8,400 square-meter site, and A1 Telekom Austria’s portfolio. The capital offers unrivaled connectivity, with 41% fiber-to-the-premises penetration and proximity to Austria’s financial and governmental cores. Construction costs at USD 11 million per MW and insufficient contiguous plots constrain further greenfield hyperscale campuses, however, prompting operators to consider brownfield retrofits and multi-story vertical designs.
Lower Austria, essentially Vienna’s power and land relief valve, hosts Microsoft’s Azure Austria East region. Sub-2 millisecond latency into the capital preserves application performance while sidestepping inner-city zoning hurdles. Burgenland’s wind expansion and Lower Austria's hydro resources strengthen renewable PPA opportunities, enhancing regional attractiveness.
The rest of Austria grows fastest at a 9.68% CAGR through 2031. Graz combines university-led R&D with automotive suppliers adopting edge nodes. Linz’s voestalpine-anchored steel cluster stimulates real-time analytics requirements that small regional colocation halls fill. Salzburg offers managed services to SMEs and benefits from lower land prices. These secondary zones concede some network density but present a balanced trade-off of power availability, municipal incentives, and lower capex.
Competitive Landscape
Digital Realty, NTT Global Data Centers, and A1 Telekom Austria form the incumbent triad, operating Vienna’s largest carrier-neutral campuses. Digital Realty’s April 2025 announcement of a 40 MW greenfield site demonstrates a commitment to AI-ready density and hybrid-cloud on-ramps. NTT banks on its Technology Experience Labs to help enterprises emulate multi-cloud architectures before migration. A1 Telekom Austria leverages network depth and sovereign hosting credentials for public-sector tenders.
Microsoft’s USD 1.13 billion self-build disrupts the colocation paradigm by internalizing capacity, control, and renewable sourcing. AtlasEdge’s acquisition of Siemens Campus injects an edge-centric model targeting industrial IoT and latency-critical workloads. Local players such as Raiffeisen Rechenzentrum, conova communications, and GRZ IT Center defend with tailored managed services and data sovereignty assurances.
Differentiators have shifted toward renewable power provenance, district heating integration, and granular sustainability reporting. Larger operators can absorb EU-mandated KPI disclosure costs and command bulk purchasing of green power. Smaller regional houses emphasize local relationships and agility but risk margin squeeze as steel, labor, and power input costs escalate.
Austria Data Center Industry Leaders
Digital Realty Trust Inc.
NTT Corporation
Exoscale
Raiffeisen Rechenzentrum GmbH
A1 Telekom Austria AG
- *Disclaimer: Major Players sorted in no particular order

Recent Industry Developments
- January 2026: Advanced Computing Austria and the Austrian Institute of Technology will open a physical AI Hub in Vienna, offering up to 2,500 m² of coworking and advisory space and paving the way for a USD 56.5 million AI-optimized supercomputer slated for 2027, strengthening the city’s position as a regional center for high-performance computing.
- August 2025: Microsoft launched Azure Austria East, the country’s first hyperscale cloud region, across three Lower Austria sites.
- June 2025: Vienna submitted its formal bid to host an EU AI Gigafactory with waste-heat integration into the city’s district heating system.
- June 2025: Wiener Netze energized a dedicated 110 kV substation in Schwechat to serve Microsoft’s cloud region.


Austria Data Center Market Report Scope
The data center market encompasses the infrastructure, services, and technologies that support the storage, management, and processing of data. This market includes various data center sizes, tier classifications, types, end-user industries, and hotspots, reflecting the diverse needs of businesses and organizations operating in the country.
The Austria Data Center Market Report is Segmented by Data Center Size (Small, Medium, Large, and Hyperscale), Tier Type (Tier 1 and 2, Tier 3, and Tier 4), Data Center Type (Hyperscale/Self-Built, Enterprise/Edge, and Colocation), End User (BFSI, IT and ITES, E-Commerce, Government, Manufacturing, Media and Entertainment, Telecom, and Other End Users), and Hotspot (Vienna, and Rest of Austria). The Market Forecasts are Provided in Terms of IT Load Capacity (Megawatt).
| Small |
| Medium |
| Large |
| Hyperscale |
| Tier 1 and 2 |
| Tier 3 |
| Tier 4 |
| Hyperscale / Self-Built | ||
| Enterprise / Edge | ||
| Colocation | Non-Utilized | |
| Utilized | Retail Colocation | |
| Wholesale Colocation | ||
| BFSI |
| IT and ITES |
| E-Commerce |
| Government |
| Manufacturing |
| Media and Entertainment |
| Telecom |
| Other End Users |
| Vienna |
| Rest of Austria |
| By Data Center Size | Small | ||
| Medium | |||
| Large | |||
| Hyperscale | |||
| By Tier Type | Tier 1 and 2 | ||
| Tier 3 | |||
| Tier 4 | |||
| By Data Center Type | Hyperscale / Self-Built | ||
| Enterprise / Edge | |||
| Colocation | Non-Utilized | ||
| Utilized | Retail Colocation | ||
| Wholesale Colocation | |||
| By End User | BFSI | ||
| IT and ITES | |||
| E-Commerce | |||
| Government | |||
| Manufacturing | |||
| Media and Entertainment | |||
| Telecom | |||
| Other End Users | |||
| By Hotspot | Vienna | ||
| Rest of Austria | |||


Market Definition
- IT LOAD CAPACITY - The IT load capacity or installed capacity, refers to the amount of energy consumed by servers and network equipments placed in a rack installed. It is measured in megawatt (MW).
- ABSORPTION RATE - It denotes the extend to which the data center capacity has been leased out. For instance, a 100 MW DC has leased out 75 MW, then absorption rate would be 75%. It is also referred as utilization rate and leased-out capacity.
- RAISED FLOOR SPACE - It is an elevated space build over the floor. This gap between the original floor and the elevated floor is used to accommodate wiring, cooling, and other data center equipment. This arrangement assist in having proper wiring and cooling infrastructure. It is measured in square feet (ft^2).
- DATA CENTER SIZE - Data Center Size is segmented based on the raised floor space allocated to the data center facilities. Mega DC - # of Racks must be more than 9000 or RFS (raised floor space) must be more than 225001 Sq. ft; Massive DC - # of Racks must be in between 9000 and 3001 or RFS must be in between 225000 Sq. ft and 75001 Sq. ft; Large DC - # of Racks must be in between 3000 and 801 or RFS must be in between 75000 Sq. ft and 20001 Sq. ft; Medium DC # of Racks must be in between 800 and 201 or RFS must be in between 20000 Sq. ft and 5001 Sq. ft; Small DC - # of Racks must be less than 200 or RFS must be less than 5000 Sq. ft.
- TIER TYPE - According to Uptime Institute the data centers are classified into four tiers based on the proficiencies of redundant equipment of the data center infrastructure. In this segment the data center are segmented as Tier 1,Tier 2, Tier 3 and Tier 4.
- COLOCATION TYPE - The segment is segregated into 3 categories namely Retail, Wholesale and Hyperscale Colocation service. The categorization is done based on the amount of IT load leased out to potential customers. Retail colocation service has leased capacity less than 250 kW; Wholesale colocation services has leased capacity between 251 kW and 4 MW and Hyperscale colocation services has leased capacity more than 4 MW.
- END CONSUMERS - The Data Center Market operates on a B2B basis. BFSI, Government, Cloud Operators, Media and Entertainment, E-Commerce, Telecom and Manufacturing are the major end-consumers in the market studied. The scope only includes colocation service operators catering to the increasing digitalization of the end-user industries.
| Keyword | Definition |
|---|---|
| Rack Unit | Generally referred as U or RU, it is the unit of measurement for the server unit housed in the racks in the data center. 1U is equal to 1.75 inches. |
| Rack Density | It defines the amount of power consumed by the equipment and server housed in a rack. It is measured in kilowatt (kW). This factor plays a critical role in data center design and, cooling and power planning. |
| IT Load Capacity | The IT load capacity or installed capacity, refers to the amount of energy consumed by servers and network equipment placed in a rack installed. It is measured in megawatt (MW). |
| Absorption Rate | It denotes how much of the data center capacity has been leased out. For instance, if a 100 MW DC has leased out 75 MW, then the absorption rate would be 75%. It is also referred to as utilization rate and leased-out capacity. |
| Raised Floor Space | It is an elevated space built over the floor. This gap between the original floor and the elevated floor is used to accommodate wiring, cooling, and other data center equipment. This arrangement assists in having proper wiring and cooling infrastructure. It is measured in square feet/meter. |
| Computer Room Air Conditioner (CRAC) | It is a device used to monitor and maintain the temperature, air circulation, and humidity inside the server room in the data center. |
| Aisle | It is the open space between the rows of racks. This open space is critical for maintaining the optimal temperature (20-25 °C) in the server room. There are primarily two aisles inside the server room, a hot aisle and a cold aisle. |
| Cold Aisle | It is the aisle wherein the front of the rack faces the aisle. Here, chilled air is directed into the aisle so that it can enter the front of the racks and maintain the temperature. |
| Hot Aisle | It is the aisle where the back of the racks faces the aisle. Here, the heat dissipated from the equipment’s in the rack is directed to the outlet vent of the CRAC. |
| Critical Load | It includes the servers and other computer equipment whose uptime is critical for data center operation. |
| Power Usage Effectiveness (PUE) | It is a metric which defines the efficiency of a data center. It is calculated by: (𝑇𝑜𝑡𝑎𝑙 𝐷𝑎𝑡𝑎 𝐶𝑒𝑛𝑡𝑒𝑟 𝐸𝑛𝑒𝑟𝑔𝑦 𝐶𝑜𝑛𝑠𝑢𝑚𝑝𝑡𝑖𝑜𝑛)/(𝑇𝑜𝑡𝑎𝑙 𝐼𝑇 𝐸𝑞𝑢𝑖𝑝𝑚𝑒𝑛𝑡 𝐸𝑛𝑒𝑟𝑔𝑦 𝐶𝑜𝑛𝑠𝑢𝑚𝑝𝑡𝑖𝑜𝑛). Further, a data center with a PUE of 1.2-1.5 is considered highly efficient, whereas, a data center with a PUE >2 is considered highly inefficient. |
| Redundancy | It is defined as a system design wherein additional component (UPS, generators, CRAC) is added so that in case of power outage, equipment failure, the IT equipment should not be affected. |
| Uninterruptible Power Supply (UPS) | It is a device that is connected in series with the utility power supply, storing energy in batteries such that the supply from UPS is continuous to IT equipment even during utility power is snapped. The UPS primarily supports the IT equipment only. |
| Generators | Just like UPS, generators are placed in the data center to ensure an uninterrupted power supply, avoiding downtime. Data center facilities have diesel generators and commonly, 48-hour diesel is stored in the facility to prevent disruption. |
| N | It denotes the tools and equipment required for a data center to function at full load. Only "N" indicates that there is no backup to the equipment in the event of any failure. |
| N+1 | Referred to as 'Need plus one', it denotes the additional equipment setup available to avoid downtime in case of failure. A data center is considered N+1 when there is one additional unit for every 4 components. For instance, if a data center has 4 UPS systems, then for to achieve N+1, an additional UPS system would be required. |
| 2N | It refers to fully redundant design wherein two independent power distribution system is deployed. Therefore, in the event of a complete failure of one distribution system, the other system will still supply power to the data center. |
| In-Row Cooling | It is the cooling design system installed between racks in a row where it draws warm air from the hot aisle and supplies cool air to the cold aisle, thereby maintaining the temperature. |
| Tier 1 | Tier classification determines the preparedness of a data center facility to sustain data center operation. A data center is classified as Tier 1 data center when it has a non-redundant (N) power component (UPS, generators), cooling components, and power distribution system (from utility power grids). The Tier 1 data center has an uptime of 99.67% and an annual downtime of <28.8 hours. |
| Tier 2 | A data center is classified as Tier 2 data center when it has a redundant power and cooling components (N+1) and a single non-redundant distribution system. Redundant components include extra generators, UPS, chillers, heat rejection equipment, and fuel tanks. The Tier 2 data center has an uptime of 99.74% and an annual downtime of <22 hours. |
| Tier 3 | A data center having redundant power and cooling components and multiple power distribution systems is referred to as a Tier 3 data center. The facility is resistant to planned (facility maintenance) and unplanned (power outage, cooling failure) disruption. The Tier 3 data center has an uptime of 99.98% and an annual downtime of <1.6 hours. |
| Tier 4 | It is the most tolerant type of data center. A Tier 4 data center has multiple, independent redundant power and cooling components and multiple power distribution paths. All IT equipment are dual powered, making them fault tolerant in case of any disruption, thereby ensuring interrupted operation. The Tier 4 data center has an uptime of 99.74% and an annual downtime of <26.3 minutes. |
| Small Data Center | Data center that has floor space area of ≤ 5,000 Sq. ft or the number of racks that can be installed is ≤ 200 is classified as a small data center. |
| Medium Data Center | Data center which has floor space area between 5,001-20,000 Sq. ft, or the number of racks that can be installed is between 201-800, is classified as a medium data center. |
| Large Data Center | Data center which has floor space area between 20,001-75,000 Sq. ft, or the number of racks that can be installed is between 801-3,000, is classified as a large data center. |
| Massive Data Center | Data center which has floor space area between 75,001-225,000 Sq. ft, or the number of racks that can be installed is between 3001-9,000, is classified as a massive data center. |
| Mega Data Center | Data center that has a floor space area of ≥ 225,001 Sq. ft or the number of racks that can be installed is ≥ 9001 is classified as a mega data center. |
| Retail Colocation | It refers to those customers who have a capacity requirement of 250 kW or less. These services are majorly opted by small and medium enterprises (SMEs). |
| Wholesale Colocation | It refers to those customers who have a capacity requirement between 250 kW to 4 MW. These services are majorly opted by medium to large enterprises. |
| Hyperscale Colocation | It refers to those customers who have a capacity requirement greater than 4 MW. The hyperscale demand primarily originates from large-scale cloud players, IT companies, BFSI, and OTT players (like Netflix, Hulu, and HBO+). |
| Mobile Data Speed | It is the mobile internet speed a user experiences via their smartphones. This speed is primarily dependent on the carrier technology being used in the smartphone. The carrier technologies available in the market are 2G, 3G, 4G, and 5G, where 2G provides the slowest speed while 5G is the fastest. |
| Fiber Connectivity Network | It is a network of optical fiber cables deployed across the country, connecting rural and urban regions with high-speed internet connection. It is measured in kilometer (km). |
| Data Traffic per Smartphone | It is a measure of average data consumption by a smartphone user in a month. It is measured in gigabyte (GB). |
| Broadband Data Speed | It is the internet speed that is supplied over the fixed cable connection. Commonly, copper cable and optic fiber cable are used in both residential and commercial use. Here, optic cable fiber provides faster internet speed than copper cable. |
| Submarine Cable | A submarine cable is a fiber optic cable laid down at two or more landing points. Through this cable, communication and internet connectivity between countries across the globe is established. These cables can transmit 100-200 terabits per second (Tbps) from one point to another. |
| Carbon Footprint | It is the measure of carbon dioxide generated during the regular operation of a data center. Since, coal, and oil & gas are the primary source of power generation, consumption of this power contributes to carbon emissions. Data center operators are incorporating renewable energy sources to curb the carbon footprint emerging in their facilities. |


Research Methodology
Mordor Intelligence follows a four-step methodology in all our reports.
- Step-1: Identify Key Variables: In order to build a robust forecasting methodology, the variables and factors identified in Step-1 are tested against available historical market numbers. Through an iterative process, the variables required for market forecast are set and the model is built on the basis of these variables.
- Step-2: Build a Market Model: Market-size estimations for the forecast years are in nominal terms. Inflation is not a part of the pricing, and the average selling price (ASP) is kept constant throughout the forecast period for each country.
- Step-3: Validate and Finalize: In this important step, all market numbers, variables and analyst calls are validated through an extensive network of primary research experts from the market studied. The respondents are selected across levels and functions to generate a holistic picture of the market studied.
- Step-4: Research Outputs: Syndicated Reports, Custom Consulting Assignments, Databases & Subscription Platforms


