Market Overview
| Study Period | 2019 - 2031 |
|---|---|
| Forecast Data Period | 2026 - 2031 |
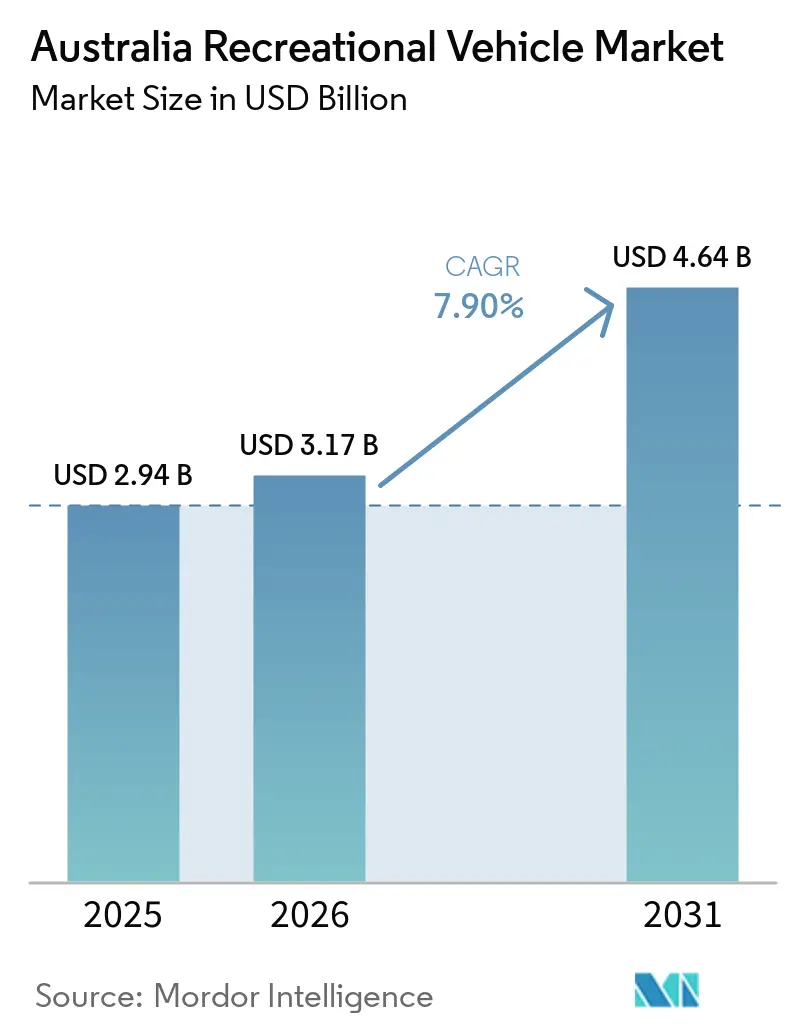
| Base Year Market Size (2025) | USD 2.94 Billion |
| Market Size (2026) | USD 3.17 Billion |
| Market Size (2031) | USD 4.64 Billion |
| Growth Rate (2026 - 2031) | 7.90% CAGR |
| Market Concentration | Medium |
Major Players *Disclaimer: Major Players sorted in no particular order Image © Mordor Intelligence. Reuse requires attribution under CC BY 4.0. | |
Australia Recreational Vehicle Market Analysis by Mordor Intelligence
The Australian recreational vehicle market size is projected to expand from USD 2.94 billion in 2025 and USD 3.17 billion in 2026 to USD 4.64 billion by 2031, registering a CAGR of 7.90% between 2026 and 2031. Rising domestic road-trip tourism, retiree spending power, and hybrid-work flexibility are lifting vehicle registrations even as local manufacturing struggles with chassis shortages and labor constraints. Imports now plug most supply gaps and skew the model mix toward higher-spec trims that carry thicker dealer margins. At the same time, caravan-park operators are investing in powered sites and “glamping” amenities to capture higher nightly fees, while federal and state policy discussions around rebates and luxury-tax relief signal further upside for locally built units. Tighter lending standards remain the main short-term headwind, yet cash-rich retirees and fleet buyers continue to underpin demand for premium towables and motorhomes.
Key Report Takeaways
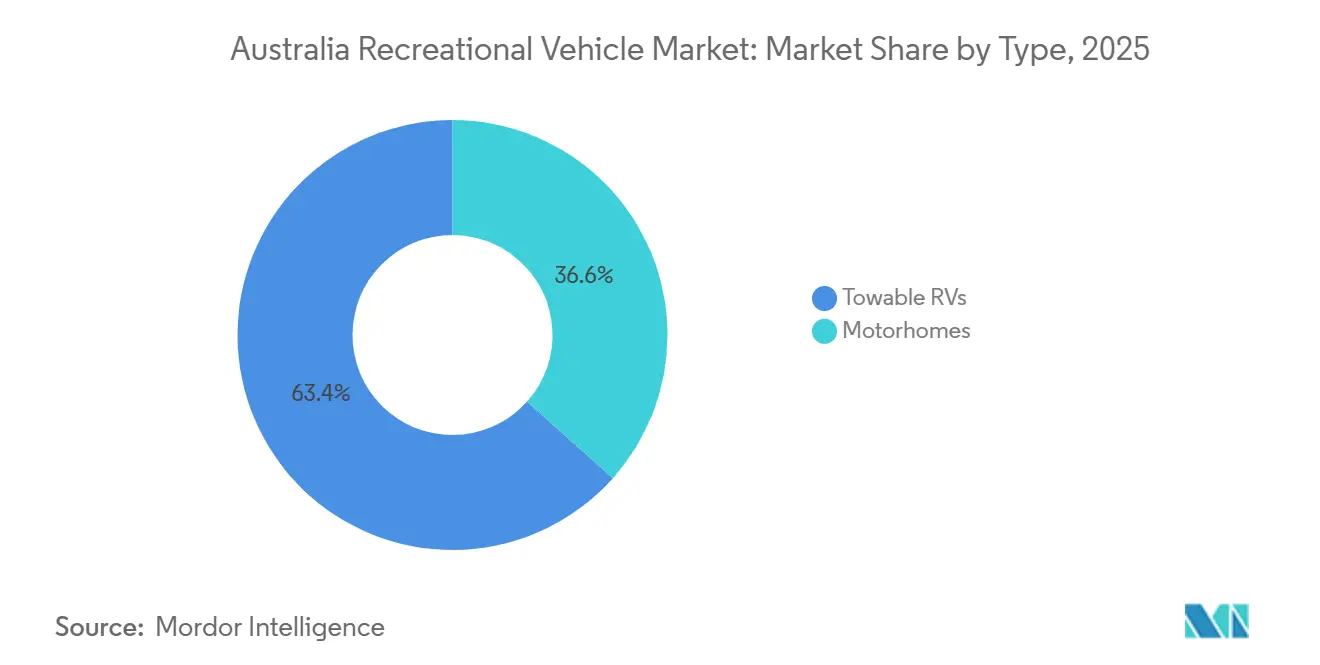
- By type, towable caravans captured 63.37% of the Australian recreational vehicle market share in 2025, while motorhomes are advancing at a 8.22% CAGR to 2031.
- By application, private buyers dominated the Australian recreational vehicle market, accounting for 78.17% of the market size in 2025; commercial rental fleets recorded the fastest expansion at a 8.19% CAGR through 2031.
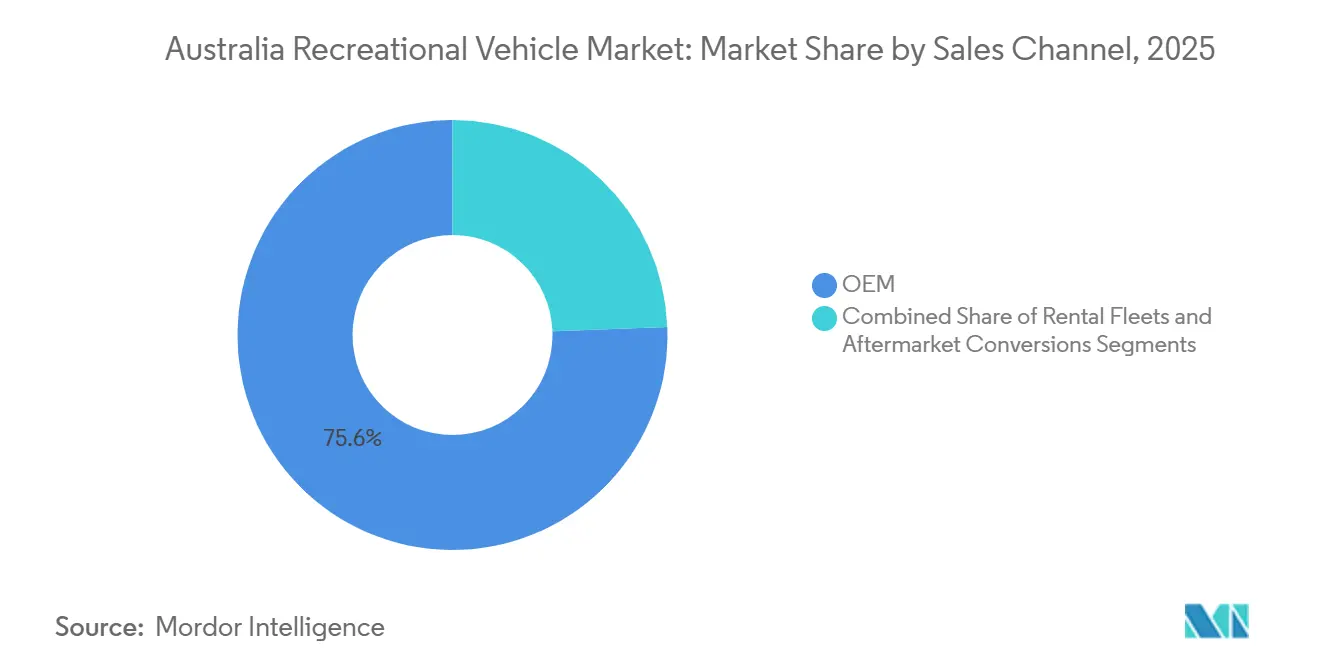
- By sales channel, OEM-direct transactions accounted for 75.64% of 2025 turnover; rental-fleet purchases are projected to rise at a 8.34% CAGR as operators refresh aging stock.
- By propulsion, diesel retained 67.17% of 2025 volume, yet electric and hybrid variants are growing at a 10.97% CAGR to 2031.
- By geography, New South Wales led revenue with a 34.41% share of the Australian recreational vehicle market in 2025; Western Australia posted the strongest 7.95% CAGR on the back of mining-belt and tourism demand.
Note: Market size and forecast figures in this report are generated using Mordor Intelligence’s proprietary estimation framework, updated with the latest available data and insights as of 2026.
Australia Recreational Vehicle Market Trends and Insights
Drivers Impact Analysis*
| Driver | (~) % Impact on CAGR Forecast | Geographic Relevance | Impact Timeline |
|---|---|---|---|
| Domestic Road-Trip Tourism Resurgence | +1.2% | National, strongest in Queensland, NSW, and Western Australia | Short term (≤ 2 years) |
| Ageing "Grey-Nomad" Demographic Growth | +0.9% | National, concentrated in coastal NSW and Queensland | Long term (≥ 4 years) |
| Federal Rebates for Locally-Made Caravans | +0.8% | National, with early gains in Victoria and South Australia | Medium term (2-4 years) |
| Expansion of Caravan-Park Infrastructure and Luxury Holiday Parks | +0.7% | Queensland, Victoria, Western Australia | Medium term (2-4 years) |
| Off-Grid Solar and Battery Integrations | +0.6% | National, with early adoption in remote Western Australia and Northern Territory | Medium term (2-4 years) |
| Remote-Work Adoption Enabling Long-Stay Travel | +0.5% | National, urban-origin travelers to regional destinations | Short term (≤ 2 years) |
| Source: Mordor Intelligence | |||


Domestic Road-Trip Tourism Resurgence
In 2024, Australians took a significant number of trips in caravans or motorhomes, contributing substantially to domestic travel spending as international holidays became less appealing. Responding to this trend, parks in coastal Queensland and Western Australia have expedited expansions of powered sites. Meanwhile, regional councils have adopted dynamic pricing strategies, increasing nightly fees for prime waterfront pitches. Additionally, the presence of backpackers on Working Holiday Maker visas has bolstered the utilization of rental fleets, solidifying the caravan's status as the preferred accommodation for those seeking flexible travel plans [1]“National Visitor Survey 2024,” Tourism Research Australia, tra.gov.au .
Ageing “Grey-Nomad” Demographic Growth
By the end of the decade, a significant portion of Australians will be over 65, and a notable percentage plan to purchase an RV within a few years of retirement. Australians are spending substantial amounts per van, primarily funded by superannuation lump-sum withdrawals, which have reached considerable levels in recent years. Extended annual journeys spanning several weeks accelerate wear, fueling a thriving second-hand market where relatively new units retain a high percentage of their initial value [2]“Superannuation Lump Sum Withdrawals 2024,” Australian Bureau of Statistics, abs.gov.au .
Federal Rebates for Locally-Made Caravans
State incentives are steering Australian buyers towards locally manufactured models. However, the lack of a cohesive federal rebate leads to inconsistent adoption. In the current year, the Caravan Industry Association introduced the RV Master Manufacturers certification, now awarded to several builders, helping consumers identify domestic products compliant with AS/NZS standards. Yet, a significant production slump this year underscored the industry's reliance on imported chassis and its vulnerable supply chains. While Treasury discussions suggest that exempting RVs priced below a certain threshold from the luxury-car tax could boost volumes moderately, no legislative bill has been presented to Parliament [3]“Luxury Car Tax Review Discussion Paper,” Australian Treasury, treasury.gov.au .
Expansion of Caravan-Park Infrastructure and Luxury Holiday Parks
In 2024, operators invested significantly in upgrades, introducing numerous powered sites and upscale "glamping" pods to boost seasonal revenue. However, planning restrictions in popular areas like Byron Bay limit new capacity, leading travelers to either book well in advance or settle for inland parks. This constraint has heightened the demand for self-sufficient rigs, now commonly equipped with solar arrays and lithium batteries.
Restraints Impact Analysis*
| Restraint | (~) % Impact on CAGR Forecast | Geographic Relevance | Impact Timeline |
|---|---|---|---|
| Supply-Chain Volatility for Chassis and Components | -0.9% | National, most acute in Victoria and South Australia manufacturing hubs | Short term (≤ 2 years) |
| Rising Interest Rates on RV Financing | -0.7% | National, disproportionate impact on first-time buyers | Short term (≤ 2 years) |
| Escalating Campsite Overcrowding and Booking Limits | -0.6% | Queensland, NSW, Victoria coastal zones | Medium term (2-4 years) |
| Limited EV Charging Infrastructure for E-Motorhomes | -0.4% | National, critical gaps in Western Australia, Northern Territory, and Tasmania | Long term (≥ 4 years) |
| Source: Mordor Intelligence | |||
Supply-Chain Volatility for Chassis and Components
In 2024, Australian builders, heavily reliant on imports, sourced a significant portion of their chassis from Europe. Lead times extended considerably, curbing domestic output, even as total registrations rose modestly. Smaller firms without volume contracts faced substantially higher unit costs. Meanwhile, on-shoring proved too expensive, hindered by AS/NZS tool-and-certification regulations.
Rising Interest Rates on RV Financing
As the cash rate remains steady at a high level through 2025, fixed rates for caravan loans have significantly increased. Consequently, monthly payments for caravans have risen noticeably, making them less affordable for many. This rise in costs has driven younger families to explore the used-caravan market, leading to an increase in dealer inventory levels and a substantial supply period.
*Our forecasts treat driver/restraint impacts as directional, not additive. The impact forecasts reflect baseline growth, mix effects, and variable interactions.
Segment Analysis
By Type: Towables Dominate, Motorhomes Gain Traction
Towable units accounted for 63.37% of 2025 shipments, cementing their role as the volume backbone of the Australian recreational vehicle market. Entry-level travel trailers start around AUD 35,000, a third of the outlay for a Class C motorhome, and pair readily with the dual-cab utes already owned by rural households. Fifth-wheel trailers cater to long hauls yet require heavy-duty pickups, narrowing their addressable audience. Folding campers and truck campers fill specialized niches that emphasize garage storage or four-wheel-drive clearance.
Motorhomes are growing at 8.22% through 2031, outpacing the market average as grey nomads chase turnkey convenience and rental fleets upgrade to slide-out-equipped Class C units. Type B campervans on Sprinter and Crafter chassis appeal to digital nomads seeking stealth parking in metro areas, while Type A coaches remain a sub-200-unit luxury segment. Builders respond by adding lithium batteries, induction cooktops, and pop-top roofs, cementing the premium edge that lifts the overall Australian recreational vehicle market size derived from motorized classes.

By Application: Private Buyers Lead, Fleets Accelerate
Private buyers accounted for 78.17% of 2025 turnover, reflecting aspirations toward ownership and the absence of depreciation benefits for individuals compared with those in commercial fleets. Cash retirees fund premium purchases, whereas tighter lending deters younger households. Commercial fleets, however, are expanding at a 8.19% CAGR due to returning international tourists and “try-before-you-buy” locals who convert to ownership within 2 years, thereby reinforcing the sales funnel of the Australian recreational vehicle market.
After closing their Brisbane manufacturing in the mid-2020s, Tourism Holdings Limited and Apollo, now operating multiple branches, turned to import-based procurement. Subscription pilots, offered at a premium weekly rate, provide unlimited mileage and insurance. Yet, they still represent a small portion of the rental revenue. Units, de-fleeted after a few years, energize a robust used market, fetching a significant percentage of the new price. This dynamic bolsters the residual-value aspect of Australia's recreational vehicle market size equation.
By Sales Channel: OEM Dominance, Rental Purchases Rise
OEM-direct sales represented 75.64% of transactions in 2025, underscoring buyers’ trust in factory warranties and compliance certificates. Long lead times—now 26 weeks for popular floor plans—have nudged a few shoppers toward used stock or aftermarket van conversions. Nonetheless, the rental fleet registered the fastest CAGR of 8.34% through 2031, helping fleet operators ensure a predictable production cadence that stabilizes plant utilization rates in the Australian recreational vehicle market.
Independent converters like Bruder and boutique camper-upfitters capture enthusiasts seeking garage ramps, home-office pods, or wheelchair accessibility, filling design gaps left by mass producers. The shift toward electric and hybrid drivelines could reroute service revenue back to vertically integrated OEMs because specialized power-train maintenance may exceed the skill sets of smaller artisan shops.

By Propulsion: Diesel Holds Sway, Electrification Emerges
Diesel powered 67.17% of 2025 sales and remains essential for towing multi-ton rigs across remote stretches with sparse petrol availability. Grey nomads prize the LandCruiser, Everest, and MU-X for 800-1,000 km cruising ranges and robust resale values. Petrol units serve price-sensitive buyers yet suffer worse economy on long trips, limiting penetration beyond suburban holidaymakers.
Electric and hybrid products are the fastest-growing slice at 10.97% CAGR, though their share of the Australian recreational vehicle market size stays low until fast-charging infrastructure spreads beyond capital city corridors. Winnebago’s 60 kWh eRV2 prototype delivers 250 km range but relies on overnight 15-amp charging, and BYD’s Shark 6 plug-in ute suits sub-2,500 kg caravans only. Builders hedge bets by integrating rooftop solar and 48-V house batteries that cut generator reliance even on diesel rigs.
Geography Analysis
New South Wales generated 34.41% of 2025 revenue, driven by Sydney's affluent retirees, a dense network of parks along the South Coast, and proximity to the Snowy Mountains. However, peak-season overcrowding led coastal councils to impose time limits, pushing late bookers inland and boosting demand for self-contained caravans. Victoria, which contributes a substantial share of the national turnover, is bolstered by a large number of parks generating substantial annual fees and the perennial allure of the Great Ocean Road. While planning restrictions on Phillip Island and the Mornington Peninsula limit new capacity, they also intensify premium-rate pressures, thereby inflating the overall size of the recreational vehicle market in the state.
Western Australia is the fastest-growing region, with a 7.95% CAGR. Here, mining shift workers are turning to caravans for their fly-in-fly-out accommodations, and the Coral Coast's allure is drawing retirees from the eastern states. Bolstering this trend, the state's rest-area initiative is set to introduce additional dump stations in the coming years, expanding the territory for off-grid adventurers. Meanwhile, Queensland, like Victoria, faces challenges as its dry-season influx of southern "snowbirds" strains the availability of powered sites. This has led to a state-commissioned study advocating for a significant increase in hookups over the next several years.
South Australia, Tasmania, the Northern Territory, and the ACT collectively account for a notable portion of the national demand. Off-grid enthusiasts are drawn to Tasmania's rugged west and the Northern Territory's Stuart Highway, despite the limited services. The sparse distribution of chargers along the stretch from Darwin to Adelaide highlights the continued reliance on diesel and the sluggish adoption of electric motorhomes outside major urban centers.
Competitive Landscape
Australia's recreational vehicle market remains a patchwork of competition. Jayco, Winnebago, and Swift command modest market shares, while numerous smaller players carve out niches, from lightweight composites to toy-hauler garages. REDARC’s battery-solar modules now feature in a significant portion of domestic builds, hinting at a potential reshaping of supplier dynamics. Meanwhile, Zone RV’s voluntary administration in late 2025 highlighted the fragility of balance sheets, especially when chassis delays meet rising debt costs.
Strategic maneuvers are leaning towards premiumization and electrification. Winnebago’s eRV2 pilot and BYD’s Shark 6 hybrid ute signal a shift to low-carbon touring, though early adopters still navigate around charging stations. Brands like Bruder and Trakka, catering to affluent off-roaders and urban nomads, offer bespoke rigs priced notably higher than mainstream builders. The Caravan Industry Association’s RV Master Manufacturers mark seeks to assure buyers of build quality and counter import competition, but its appeal to consumers remains to be seen.
Fleet operators are carving out their own niche. Following its merger with Apollo, Tourism Holdings Limited harnesses the power of an extensive branch network and bulk-buying clout to negotiate favorable unit discounts. This strategy not only pressures manufacturer margins but also guarantees consistent factory output. On another front, subscription pilots are emerging, catering to remote workers in need of seasonal access. This move suggests a budding services-led revenue stream, potentially cushioning the cyclical fluctuations in Australia's recreational vehicle market.
Australia Recreational Vehicle Industry Leaders
Jayco, Inc.
Winnebago Group
Avida RV
Sunliner Recreational Vehicles
Swift Group Australia
- *Disclaimer: Major Players sorted in no particular order

Recent Industry Developments
- November 2025: In a notable advancement for Australian RV innovation, Avida RV has unveiled its 2025 Birdsville range. The refreshed Birdsville MY25 and the inaugural Birdsville LX harmoniously merge modern design, state-of-the-art technology, and cozy comfort, establishing a fresh standard for Australian motorhome aficionados.
- March 2025: Jayco Adelaide has inaugurated Australia's largest purpose-built RV dealership in West Beach, underscoring a pivotal moment for the nation's recreational vehicle sector. This vast facility promises to elevate the customer experience, offering a diverse selection of RVs and customized services in response to the rising popularity of caravan and motorhome journeys. The debut of this dealership is a testament to Australia's burgeoning appetite for RVs, fueled by a notable uptick in domestic travel and a growing inclination towards flexible, comfortable travel alternatives.


Australia Recreational Vehicle Market Report Scope
The Australian recreational vehicle market report is segmented by type (towable RVs and motorhomes), application (private and commercial), sales channel (OEM, rental fleets, and aftermarket conversions), propulsion (diesel and more), and geography. The market forecasts are provided in value (USD) and volume (units).
By Type
| Towable RVs | Travel Trailers |
| Fifth-wheel Trailers | |
| Folding Camp Trailers | |
| Truck Campers | |
| Motorhomes | Type A |
| Type B | |
| Type C |
By Application
| Private |
| Commercial |
By Sales Channel
| OEM |
| Rental Fleets |
| Aftermarket Conversions |
By Propulsion
| Diesel |
| Petrol |
| Electric / Hybrid |
By Region
| New South Wales |
| Victoria |
| Queensland |
| Western Australia |
| South Australia |
| Tasmania |
| Northern Territory |
| Australian Capital Territory |
| By Type | Towable RVs | Travel Trailers |
| Fifth-wheel Trailers | ||
| Folding Camp Trailers | ||
| Truck Campers | ||
| Motorhomes | Type A | |
| Type B | ||
| Type C | ||
| By Application | Private | |
| Commercial | ||
| By Sales Channel | OEM | |
| Rental Fleets | ||
| Aftermarket Conversions | ||
| By Propulsion | Diesel | |
| Petrol | ||
| Electric / Hybrid | ||
| By Region | New South Wales | |
| Victoria | ||
| Queensland | ||
| Western Australia | ||
| South Australia | ||
| Tasmania | ||
| Northern Territory | ||
| Australian Capital Territory | ||


Key Questions Answered in the Report
How fast is the Australian recreational vehicle market expected to grow between 2026 and 2031?
It is forecast to expand at a 7.90% CAGR, moving from USD 3.17 billion in 2026 to USD 4.64 billion by 2031.
Which product type currently dominates sales?
Towable caravans lead with 63.37% of 2025 shipments, driven by lower purchase prices and compatibility with existing tow vehicles.
Why are commercial rental fleets expanding faster than private ownership?
International visitor recovery and “try-before-you-buy” domestic demand push fleet purchases at a 8.34% CAGR, outpacing private growth.
What is the key barrier to electric motorhome adoption?
Limited 50 kW fast-charging coverage outside major east-coast corridors restricts touring range for battery-powered rigs.
Which state shows the highest growth outlook?
Western Australia is projected to grow at 7.95% CAGR, buoyed by mining-sector accommodation needs and Coral Coast tourism investment.
Page last updated on:


