Market Overview
| Study Period | 2020 - 2031 |
|---|---|
| Forecast Data Period | 2026 - 2031 |
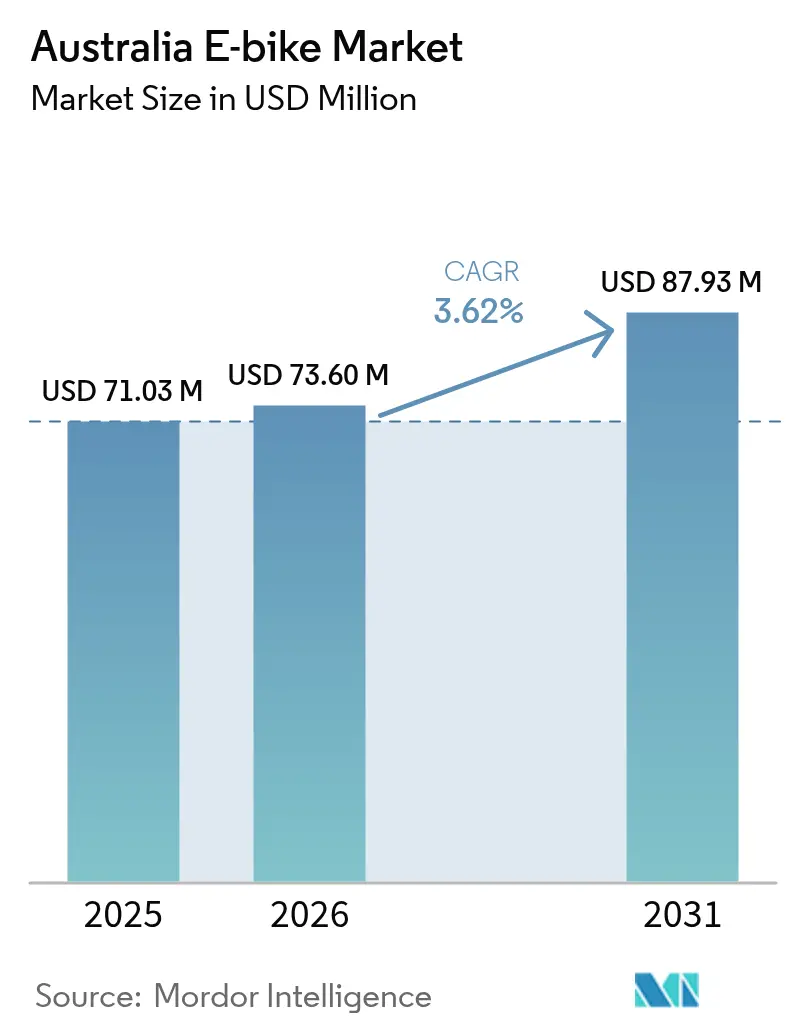
| Base Year Market Size (2025) | USD 71.03 Million |
| Market Size (2026) | USD 73.6 Million |
| Market Size (2031) | USD 87.93 Million |
| Growth Rate (2026 - 2031) | 3.62% CAGR |
| Market Concentration | Medium |
Major Players *Disclaimer: Major Players sorted in no particular order Image © Mordor Intelligence. Reuse requires attribution under CC BY 4.0. | |
Australia E-bike Market Analysis by Mordor Intelligence
Australian E-bike market size in 2026 is estimated at USD 73.6 million, growing from 2025 value of USD 71.03 million with 2031 projections showing USD 87.93 million, growing at 3.62% CAGR over 2026-2031. Robust infrastructure spending, rising transport costs, and commercial fleet demand are guiding the next growth leg for the Australian e-bike market, steering it away from a purely recreational niche and toward a mainstream mobility solution. Tasmania leads national adoption with electric assistance on the majority of bike trips. Womens represent significant number of riders, signaling a broader demographic reach underpinning the Australian e-bike market’s mid-term resilience. Cargo-utility models are accelerating fastest as last-mile delivery operators seek carbon and cost efficiencies, and battery safety regulations in New South Wales are nudging the supply base toward certified, higher-quality products. Although China’s dominance over four-fifths of global cell manufacturing introduces supply-chain risk, Australia’s lithium output provides a latent hedge should mid-stream processing investments materialize.
Key Report Takeaways
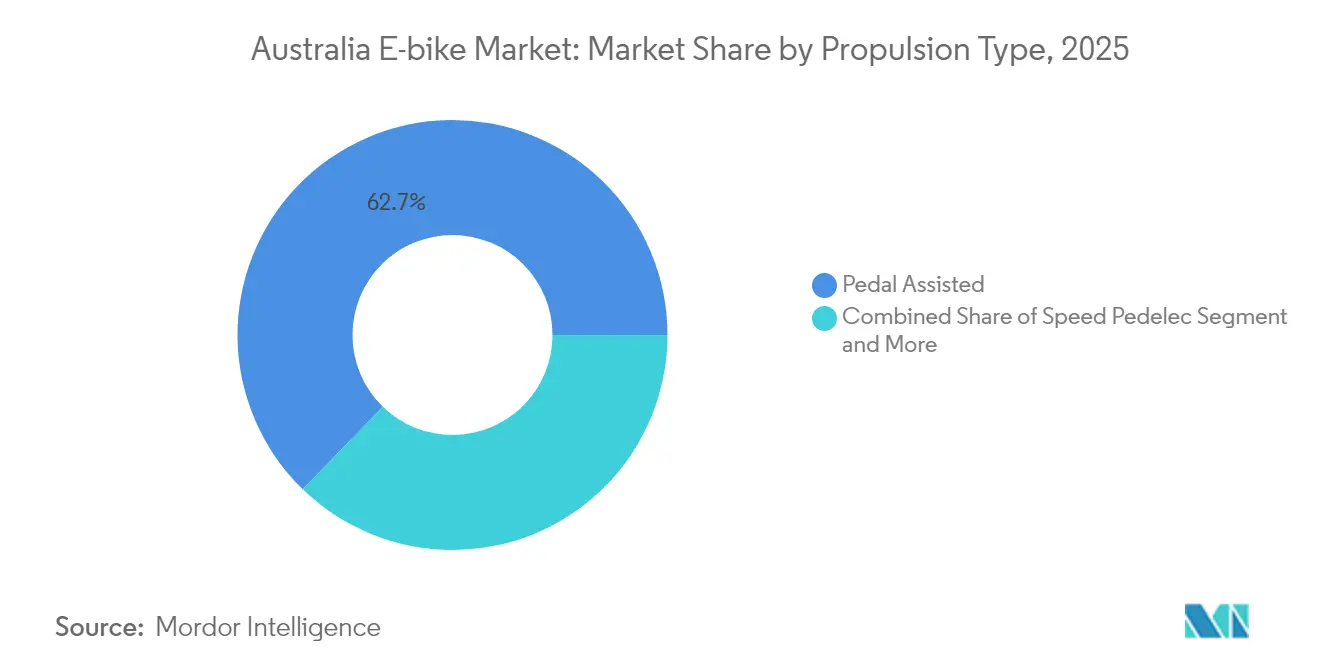
- By propulsion type, pedal-assist models commanded 62.74% of the Australian e-bike market share in 2025, while speed-pedelec demand is advancing at a 3.66% CAGR through 2031.
- By application type, city/urban bikes held 47.15% of revenue in 2025; cargo/utility units are forecast to grow at a 3.68% CAGR to 2031.
- By battery type, lithium-ion systems captured 82.55% of sales in 2025 and are expanding at a 3.74% CAGR.
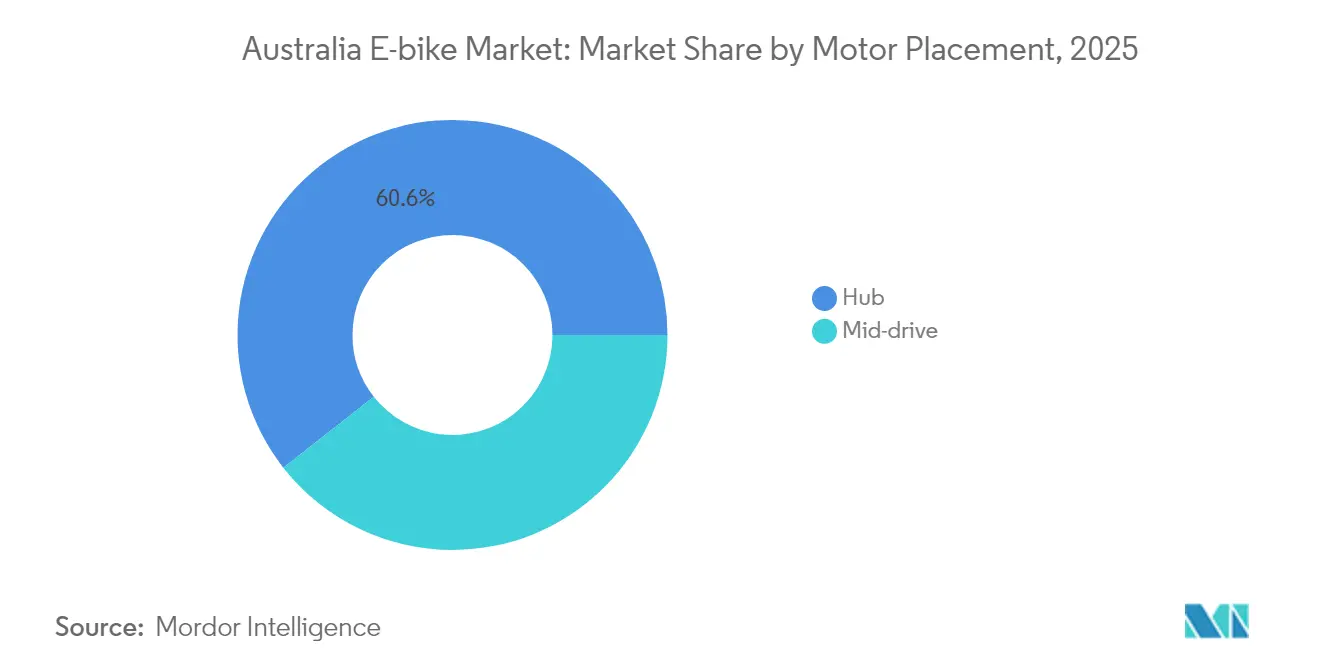
- By motor placement, hub drives accounted for 60.58% of the Australian e-bike market in 2025, whereas mid-drive units led growth at a 3.69% CAGR.
- By drive system, chain drives retained 72.61% revenue share in 2025; belt drives are set to rise at a 3.71% CAGR.
- By motor power, sub-250 W bikes represented 55.89% of the value in 2025; the 351-500 W class registers the fastest 3.72% CAGR.
- By price band, the USD 1,500-2,499 segment held 30.74% market share, the USD 2,500-3,499 tier is poised for 3.73% CAGR growth.
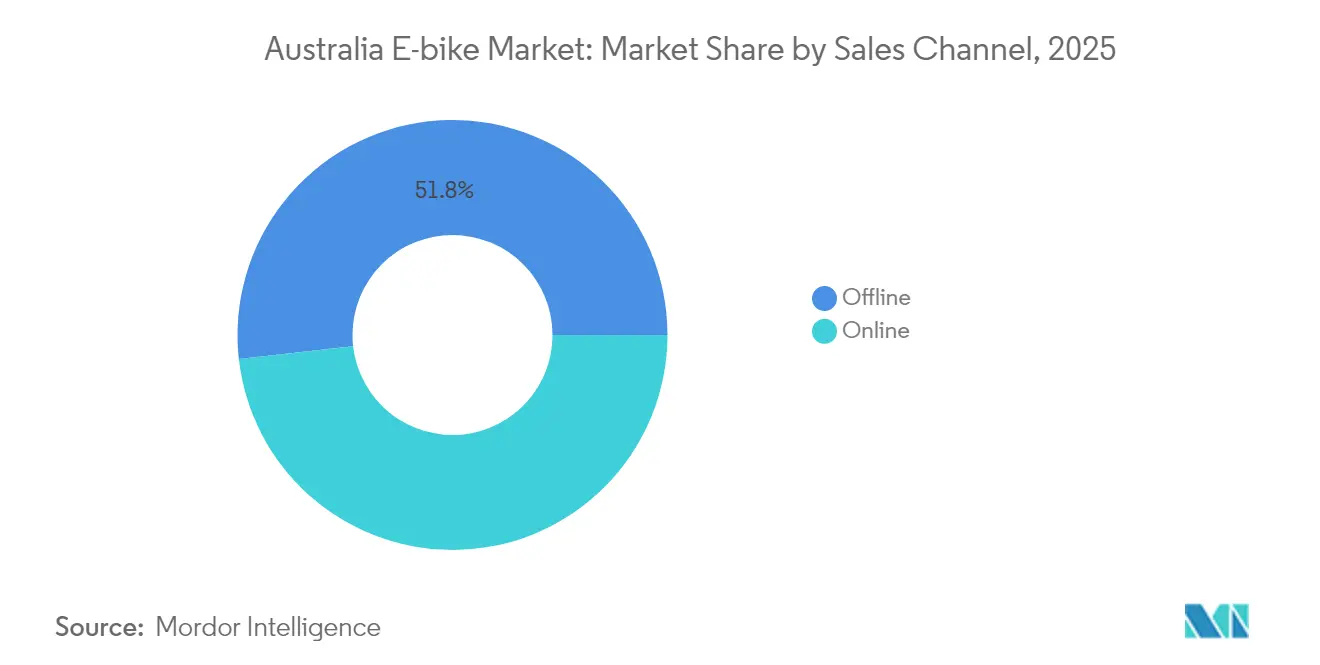
- By sales channel, offline retail captured 51.78% revenue in 2025, yet online platforms will rise at a 3.70% CAGR.
- By end use, personal and family riding retained a 45.02% share in 2025, whereas commercial delivery fleets are expanding at a 3.71% CAGR.
Note: Market size and forecast figures in this report are generated using Mordor Intelligence’s proprietary estimation framework, updated with the latest available data and insights as of 2026.
Australia E-bike Market Trends and Insights
Drivers Impact Analysis*
| Driver | (~) % Impact on CAGR Forecast | Geographic Relevance | Impact Timeline |
|---|---|---|---|
| Australia-Wide Active-Transport | +0.8% | National, with early gains in NSW, VIC, ACT | Medium term (2-4 years) |
| Cargo-Bike Adoption by Logistics Firms | +0.6% | Urban centers: Sydney, Melbourne, Brisbane | Short term (≤ 2 years) |
| Rising Household Transport Cost-of-Living | +0.5% | National, concentrated in major cities | Short term (≤ 2 years) |
| State E-Bike Purchase-Rebate Pilots | +0.4% | Tasmania active, Queensland proposed, NSW exploring | Medium term (2-4 years) |
| IOT-Enabled Fleet Management Lowering TCO | +0.4% | Major cities with micromobility programs | Short term (≤ 2 years) |
| Insurance Products Tailored to E-Bikes | +0.3% | National, urban-focused rollout | Medium term (2-4 years) |
| Source: Mordor Intelligence | |||


Australia-Wide Active-Transport Funding Surge
The National Active Transport Fund will inject massive investment from July 2025 into protected lanes and mixed-use paths that alleviate range anxiety and safety concerns for new riders [1]“National Active Transport Fund Announcement,” Department of Infrastructure, infra.gov.au. Complementary state grants for curbside chargers align with this pipeline, creating an ecosystem that supports Australia's e-bike market. Pandemic-era bike purchases established a strong baseline, and the promised network of lanes is set to convert casual owners into regular commuters. As pathways improve, modal share tends to climb, evidenced by Tasmania’s rider mix, where women account for more than one-third of e-bike users. The funding, therefore, lifts latent demand into realized sales and lengthens replacement cycles as daily mileage grows.
Cargo-Bike Adoption by Logistics Firms for Last-Mile Delivery
E-cargo fleets cut urban delivery costs by minimal and carbon output by a significant difference, outcomes that resonate with postal operators and food delivery aggregators [2]“Sustainability in Delivery Fleet,” Australia Post, auspost.com.au . Australia Post has fielded 175 electric utility bikes, validating the commercial case now drawing in private couriers. Certified battery standards under NSW regulation further raise barriers for uncertified imports, tilting procurement toward established suppliers with Tier-1 drivetrains. Because fleet buyers evaluate total cost rather than ticket price, higher-spec cargo models gain traction and pull adjacent service demand, such as IoT tracking, precipitating a network effect for the Australian e-bike market.
Rising Household Transport Cost-of-Living Pressures
Rising fuel and maintenance costs are making e-bikes an attractive option for short-distance trips. This trend is already evident in Hobart, where a significant portion of bike journeys now feature electric assistance. E-bikes sidestep ongoing registration and parking fees. Additionally, as battery prices continue to decline, the initial investment becomes more manageable. The Australian e-bike sector finds itself balancing cost savings with environmental aspirations. Notably, households with two cars are increasingly opting to downsize to one, often shedding the second vehicle in favor of e-bikes. While demand splits between budget and premium segments, mid-range brands face the challenge of proving their worth.
State E-Bike Purchase-Rebate Pilots
Tasmania’s program offered households up to a significant amount in rebates, and early data show more substantial rural uptake where public transport is sparse [3]“Electric Bicycle Rebate Program,” Tasmanian Department of State Growth, stategrowth.tas.gov.au . Queensland and New South Wales are drafting similar incentives, elevating the Australian e-bike market by easing the upfront barrier that distinguishes e-bikes from conventional cycles. Certification clauses tied to AS 15194 favor brands with documented compliance, so incentives could inadvertently consolidate share toward quality players and raise the floor on acceptable safety standards.
Restraints Impact Analysis*
| Restraint | (~) % Impact on CAGR Forecast | Geographic Relevance | Impact Timeline |
|---|---|---|---|
| Fire-Risk Concerns | -0.7% | National, concentrated in NSW, VIC | Short term (≤ 2 years) |
| High Upfront Cost Vs. Conventional Bicycles | -0.5% | National, particularly regional areas | Medium term (2-4 years) |
| Fragmented State Regulations | -0.4% | National, varying by state jurisdiction | Medium term (2-4 years) |
| Under-Developed Dedicated Charging/Parking Infrastructure | -0.3% | Urban centers and regional areas | Long term (≥ 4 years) |
| Source: Mordor Intelligence | |||
Fire-Risk Concerns Over Low-Quality Retrofit Battery Kits
Since 2022, New South Wales has experienced numerous fires linked to micromobility, with a significant portion involving e-bikes. While most fires can be traced back to aftermarket or DIY kits, media narratives suggest a wider threat, dampening retail enthusiasm across various categories. Starting February 2025, New South Wales require certifications under specific safety standards, a move that could phase out subpar imports and elevate average retail prices. Notably, only a small fraction of brands is part of the national B-cycle scheme, underscoring a significant gap in the industry's end-of-life stewardship. This gap not only heightens safety concerns but also stifles short-term growth in Australia's e-bike market.
High Upfront Cost Versus Conventional Bicycles in Lower-Income Segments
Even as battery prices decline, e-bikes continue to sell at a significantly higher price compared to traditional bicycles. In regions where wages are modest, challenges like restricted financial access and a sparse network of dealers become pronounced. While rebate initiatives help reduce costs, their limited geographical reach curtails widespread adoption.
*Our forecasts treat driver/restraint impacts as directional, not additive. The impact forecasts reflect baseline growth, mix effects, and variable interactions.
Segment Analysis
By Propulsion Type: Demand Polarizes Around Performance Limits
Pedal-assist models accounted for 62.74% of the 2025 value, anchoring the Australian e-bike market, while speed-pedelecs are pacing at a 3.66% CAGR. Pedal-assist remains the default for casual riders and aligns with federal limits. Still, commuters covering 20 km-plus journeys in Sydney or Melbourne increasingly view the 28–45 km/h envelope of speed-pedelecs as achievable car substitutes. Bosch’s eShift integration with Shimano drivetrains elevates ride comfort, pushing mid-range ticket prices past USD 2,500 and enlarging the premium tier. Regulatory consistency still favors pedal-assist, yet incremental adoption of speed-pedelecs foreshadows a performance arms race once more states harmonize to higher power thresholds. Retailers are calibrating inventory toward dual-use frames compatible with both classes to hedge policy uncertainty.
Second-generation batteries now deliver 120 km real-world range, which reduces dependency on public chargers and strengthens consumer confidence in both sub-segments. Supply chains continue to rely on China for cells, but diversified motor vendors from the European Union are winning OEM slots as brands seek to differentiate beyond commodity propulsion kits. With mid-drive installations favoured by performance seekers, the propulsion category exemplifies how the Australian e-bike market negotiates between regulatory guardrails and user expectations.


By Application Type: Cargo-Utility Proves the Commercial Case
City/urban bikes still form the backbone with 47.15% of revenue, yet cargo-utility rigs clock the highest 3.68% CAGR as delivery fleets redraw the demand map. Australia Post’s 175-unit roll-out and Zoomo’s platform partnerships visibly legitimize the category for risk-averse corporate buyers. Platform economics show that one cargo e-bike can replace three scooter runs per hour in congested CBD traffic, a metric already shaping municipal tender criteria. The trend trickles down to consumer perceptions; households purchasing long-tail e-cargo bikes cite exposure to courier fleets as proof of reliability.
City/urban models are not static; OEMs release step-through frames with integrated racks aimed at gig-economy workers, effectively blurring boundaries with utility formats. Insurance bundles tied to commercial-grade batteries will further reinforce cargo uptake, as risk underwriters differentiate between certified and retrofit powertrains.
By Battery Type: Lithium-Ion’s Firm Grip Amid Strategic Minerals Context
Lithium-ion packs represented 82.55% of revenue in 2025 and are advancing at a 3.74% CAGR, illustrating near-total chemistry consolidation. Cost curves favor the technology, dropping fairly in 2023 alone following commodity price corrections. The Australia e-bike market share held by lithium-ion is unlikely to be challenged by lead-acid or nickel-metal hydride, given the latter’s weight penalty and impaired discharge rates. Strategically, Canberra’s Critical Minerals Strategy recognizes that shipping nearly all domestic lithium output to China for processing forfeits downstream value capture. Should pilot cathode and cell plants secure funding by 2027, brands might promote “locally refined” battery modules as a sales lever, shortening lead times while hedging geopolitical shock.
Safety regulation also skews toward lithium-ion because test protocols and standards are codified around that chemistry, giving OEMs a clear path to compliance. Recycling remains the weak link: fewer than half of spent packs enter documented reclamation, pressuring stakeholders to develop producer-responsibility schemes that parallel those in the European Union.
By Motor Placement: Mid-Drive Gains Traction on Varied Terrain
Hub motors accounted for 60.58% of 2025 turnover, but mid-drive units clock a brisk 3.69% CAGR. Commuters navigating hilly suburbs or mixed gravel routes appreciate the torque amplification that mid-drives deliver through the bike’s gearset. Pricing gaps are narrowing; Giant’s mid-drive Tempt E+ launched, only one-fifths above comparably specced hub counterparts. Retailers report conversion rates are highest among second-time e-bike buyers upgrading for performance rather than first-time shoppers, indicating rising sophistication in the Australian e-bike market.
Manufacturers with in-house frame design have an edge because mid-drives necessitate reinforced bottom-bracket shells and optimized chainlines. As OEMs bring proprietary motor-battery integration closer, serviceability improves, mitigating one of the historic objections to centrally mounted systems.
By Drive System: Belt Drives Challenge Chain Dominance
Chain drives still command 72.61% of revenue, yet belt drives are poised for 3.71% CAGR expansion. Fleet operators value 20,000-km maintenance-free claims for carbon belts, translating into fewer workshop visits and higher asset uptime. Consumers drawn to the silent, grease-free experience are willing to pay minimal premiums. Frame builders willing to re-engineer rear triangles for split-stay designs gain early-mover advantage, but retrofit compatibility remains limited, restraining mass conversion.
Given Australia’s coastal climate, belts also avoid corrosion issues that accelerate chain wear. The Australian e-bike industry thus finds in belt technology a narrative that bonds lifestyle convenience with lifecycle economics, a selling proposition particularly resonant in the insurance and fleet leasing sectors.
By Motor Power: Regulations Shape the Performance Sweet Spot
Sub-250 W bikes captured 55.89% revenue in 2025 under federal compliance, yet 351-500 W models show the fastest 3.72% CAGR, clustering in NSW markets where higher power is legal. Savvy consumers cross state lines or buy online to secure 500 W units, pointing to arbitrage that underscores regulatory disharmony. Insurance quotes for the 501-600 W band jump one-fifth due to perceived accident severity, curbing uptake despite rider interest.
Commercial cargo users favor 350-500 W motors to haul 50 kg payloads without overheating, tipping the Australia e-bike market size calculus as parcel volumes rise. Performance tuning remains software-locked to appease compliance so that firmware updates could unlock future revenue streams once harmonized rules emerge.
By Price Band: Premium Momentum Confirms Market Maturation
By price band, the USD 1,500 – 2,499 leading with a market share of 30.74% in 2025, whereas models in the USD 2,500-3,499 bracket will expand faster than any other tier at 3.73% CAGR, overtaking the entry-premium gulf that historically hindered upgrade paths. Retailers observe basket sizes edging upward as buyers seek integrated lighting, GPS tracking, and UL-certified batteries. Orbea’s Rise eMTB, demonstrates ceiling elasticity in enthusiast sub-segments. Pricing power partly reflects freight surcharges and AUD volatility.
Strong resale values in the premium cohort mitigate depreciation anxiety, and dealer trade-in programs launch to entice early adopters into new models. The Australian e-bike market mirrors the automotive dynamic, where optionality and financing broaden addressable spend.
By Sales Channel: Digital Platforms Compress the Path to Purchase
Offline retail retained a 51.78% share, but online segment is expanding at a 3.70% CAGR. Pandemic habits normalized large-ticket e-commerce, and manufacturer direct-to-consumer sites now bundle virtual test rides and doorstep servicing. Shengmilo’s 3-to-7-day delivery promise illustrates how localized warehousing bridges the final-mile gap. Dealers are pivoting toward service-first propositions such as annual safety compliance checks required under NSW law, extracting recurring revenues that offset lower unit margins.
Consumer protection statutes mandate Australian-based warranty agents, compelling foreign brands to invest in country managers or third-party service centers and thereby professionalizing the Australian e-bike industry ecosystem.
By End Use: Commercial Delivery Becomes Volume Anchor
Personal use held 45.02% of the 2025 value, whereas commercial delivery fleets are forecast to climb at a 3.71% CAGR, narrowing the volume gap. Zoomo’s leasing model pairing bikes, maintenance, and software, resonates with gig workers who resist outright purchase. Corporations use rider telematics to validate ESG claims and negotiate insurance rebates tied to safe-riding scores.
Household adoption remains healthy, but fleet deployments offer predictable replacement cycles and bulk orders that stabilize factory throughput as major grocers experiment with in-house delivery e-bikes, supplier bargaining power shifts toward OEMs capable of meeting ISO-9001 production audits, raising the professionalism bar across the Australian e-bike market.
Geography Analysis
Recent data highlights Tasmania's leading position in e-bike adoption, with electric assistance featured in a significant portion of all bike trips and journeys in Hobart. The state's rebate program has spurred uptake in peri-urban areas, especially where hilly terrains challenge traditional cycling. New South Wales has also carved out a niche. Its battery safety mandates and power cap cater to performance-driven riders, bolstering Australia's overall e-bike market penetration.
Western Australia and Victoria are close behind, registering notable adoption rates. In Perth, the flat terrain has led to a surge in hub-motor preference. Meanwhile, Victoria is uncertain due to the pending Energy Safe regulation, causing dealers to hesitate on inventory investments. South Australia lags behind, but with the Adelaide City Council endorsing incentive frameworks earlier this year, there's potential for growth, contingent on funding. Despite evident demand, regional corridors remain largely untapped. The National Active Transport Fund has allocated substantial resources for inter-town path links to alleviate distance concerns, especially in coastal tourist areas. Initiatives like Brisbane's Vianova deployment underscore a shift towards data-centric fleet management, enhancing asset use and rider safety. If federal and state policies converge on certification and power limits in the coming years, the current interstate disparities may diminish. However, until that alignment, localized regulations will continue to influence consumer choices, creating a varied adoption landscape for Australia's e-bike market.
Competitive Landscape
The competitive field is moderately fragmented; the top five players hold significant combined revenue, leaving room for challenger brands. Global stalwarts Giant, Trek, and Specialized leverage entrenched dealer ecosystems, while pure-play electric firms like Zoomo and VelectriX focus on B2B verticals. Shengmilo’s local warehousing marks a new wave of direct-import entrants that bypass traditional distribution, compressing price structures and accelerating product refresh cycles.
Technology differentiation centers on battery management, connectivity, and drive-unit co-development. Yamaha’s March 2025 acquisition of Brose’s e-Kit business arms it with 600 European service points, reinforcing after-sales capability, an increasingly decisive factor under NSW safety compliance monitoring. Meanwhile, Australian boutique makers exploit niche segments such as off-grid touring bikes fitted with solar trailers.
Regulatory fluency constitutes a strategic moat. Brands certifying AS 15194 and UL 2849 ahead of enforcement dates gain stockist preference and smoother customs clearance. Fleet management software integration represents another battleground; Zoomo embeds IoT chips for predictive maintenance, whereas traditional manufacturers still rely on third-party retrofit trackers. Local assembly remains limited, but tariff structures and potential lithium-processing investments might tilt the equation toward partial in-country manufacturing over the next cycle, introducing fresh cost-competitiveness dynamics into the Australian e-bike market.
Australia E-bike Industry Leaders
Giant Manufacturing Co.
Groupe Sportif Pty Ltd
SHIMANO INC
Specialized Bicycle Components
Trek Bicycle Corporation
- *Disclaimer: Major Players sorted in no particular order


Recent Industry Developments
- December 2024: Benzina Zero deepened its partnership with Beam Global to bundle e-bikes and BeamBike charging stations for off-grid communities.
- May 2024: The Federal Government inaugurated the USD 100 million National Active Transport Fund to scale cycling and walking paths nationwide.


Australia E-bike Market Report Scope
By Propulsion Type
| Pedal Assisted |
| Speed Pedelec |
| Throttle Assisted |
By Application Type
| Cargo/Utility |
| City/Urban |
| Trekking/Mountain |
By Battery Type
| Lead Acid Battery |
| Lithium-ion Battery |
| Others |
By Motor Placement
| Hub (Front/Rear) |
| Mid-drive |
By Drive Systems
| Chain Drive |
| Belt Drive |
By Motor Power
| Less than 250 W |
| 251 to 350 W |
| 351 to 500 W |
| 501 to 600 W |
| More than 600 W |
By Price Band
| Up to USD 1,000 |
| USD 1,000 to 1,499 |
| USD 1,500 to 2,499 |
| USD 2,500 to 3,499 |
| USD 3,500 to 5,999 |
| Above USD 6,000 |
By Sales Channel
| Online |
| Offline |
By End Use
| Commercial Delivery | Retail and Goods Delivery |
| Food and Beverage Delivery | |
| Service Providers | |
| Personal and Family Use | |
| Institutional | |
| Others |
| By Propulsion Type | Pedal Assisted | |
| Speed Pedelec | ||
| Throttle Assisted | ||
| By Application Type | Cargo/Utility | |
| City/Urban | ||
| Trekking/Mountain | ||
| By Battery Type | Lead Acid Battery | |
| Lithium-ion Battery | ||
| Others | ||
| By Motor Placement | Hub (Front/Rear) | |
| Mid-drive | ||
| By Drive Systems | Chain Drive | |
| Belt Drive | ||
| By Motor Power | Less than 250 W | |
| 251 to 350 W | ||
| 351 to 500 W | ||
| 501 to 600 W | ||
| More than 600 W | ||
| By Price Band | Up to USD 1,000 | |
| USD 1,000 to 1,499 | ||
| USD 1,500 to 2,499 | ||
| USD 2,500 to 3,499 | ||
| USD 3,500 to 5,999 | ||
| Above USD 6,000 | ||
| By Sales Channel | Online | |
| Offline | ||
| By End Use | Commercial Delivery | Retail and Goods Delivery |
| Food and Beverage Delivery | ||
| Service Providers | ||
| Personal and Family Use | ||
| Institutional | ||
| Others | ||


Market Definition
- By Application Type - E-bikes considered under this segment include city/urban, trekking, and cargo/utility e-bikes. The common types of e-bikes under these three categories include off-road/hybrid, kids, ladies/gents, cross, MTB, folding, fat tire, and sports e-bike.
- By Battery Type - This segment includes lithium-ion batteries, lead-acid batteries, and other battery types. The other battery type category includes nickel-metal hydroxide (NiMH), silicon, and lithium-polymer batteries.
- By Propulsion Type - E-bikes considered under this segment include pedal-assisted e-bikes, throttle-assisted e-bikes, and speed pedelec. While the speed limit of pedal and throttle-assisted e-bikes is usually 25 km/h, the speed limit of speed pedelec is generally 45 km/h (28 mph).
| Keyword | Definition |
|---|---|
| Pedal Assisted | Pedal-assist or pedelec category refers to the electric bikes that provide limited power assistance through torque-assist system and do not have throttle for varying the speed. The power from the motor gets activated upon pedaling in these bikes and reduces human efforts. |
| Throttle Assisted | Throttle-based e-bikes are equipped with the throttle assistance grip, installed on the handlebar, similarly to motorbikes. The speed can be controlled by twisting the throttle directly without the need to pedal. The throttle response directly provides power to the motor installed in the bicycles and speeds up the vehicle without paddling. |
| Speed Pedelec | Speed pedelec is e-bikes similar to pedal-assist e-bikes as they do not have throttle functionality. However, these e-bikes are integrated with an electric motor which delivers power of approximately 500 W and more. The speed limit of such e-bikes is generally 45 km/h (28 mph) in most of the countries. |
| City/Urban | The city or urban e-bikes are designed with daily commuting standards and functions to be operated within the city and urban areas. The bicycles include various features and specifications such as comfortable seats, sit upright riding posture, tires for easy grip and comfortable ride, etc. |
| Trekking | Trekking and mountain bikes are special types of e-bikes that are designed for special purposes considering the robust and rough usage of the vehicles. These bicycles include a strong frame, and wide tires for better and advanced grip and are also equipped with various gear mechanisms which can be used while riding in different terrains, rough grounded, and tough mountainous roads. |
| Cargo/Utility | The e-cargo or utility e-bikes are designed to carry various types of cargo and packages for shorter distances such as within urban areas. These bikes are usually owned by local businesses and delivery partners to deliver packages and parcels at very low operational costs. |
| Lithium-ion Battery | A Li-ion battery is a rechargeable battery, which uses lithium and carbon as its constituent materials. The Li-Ion batteries have a higher density and lesser weight than sealed lead acid batteries and provide the rider with more range per charge than other types of batteries. |
| Lead Acid Battery | A lead acid battery refers to sealed lead acid battery having a very low energy-to-weight and energy-to-volume ratio. The battery can produce high surge currents, owing to its relatively high power-to-weight ratio as compared to other rechargeable batteries. |
| Other Batteries | This includes electric bikes using nickel–metal hydroxide (NiMH), silicon, and lithium-polymer batteries. |
| Business-to-Business (B2B) | The sales of e-bikes to business customers such as urban fleet and logistics company, rental/sharing operators, last-mile fleet operators, and corporate fleet operators are considered under this category. |
| Business-to-Customers (B2C) | The sales of electric scooters and motorcycles to direct consumers is considered under this category. The consumers acquire these vehicles either directly from manufacturers or from other distributers and dealers through online and offline channel. |
| Unorganized Local OEMs | These players are small local manufacturers and assemblers of e-bikes. Most of these manufacturers import the components from China and Taiwan and assemble them locally. They offer the product at low cost in this price sensitive market which give them advantage over organized manufacturers. |
| Battery-as-a-Service | A business model in which the battery of an EV can be rented from a service provider or swapped with another battery when it runs out of charge |
| Dockless e-Bikes | Electric bikes that have self-locking mechanisms and a GPS tracking facility with an average top speed of around 15mph. These are mainly used by bike-sharing companies such as Bird, Lime, and Spin. |
| Electric Vehicle | A vehicle which uses one or more electric motors for propulsion. Includes cars, scooters, buses, trucks, motorcycles, and boats. This term includes all-electric vehicles and hybrid electric vehicles |
| Plug-in EV | An electric vehicle that can be externally charged and generally includes all-electric vehicles as well as plug-in hybrids. In this report we use the term for all-electric vehicles to differentiate them from plug-in hybrid electric vehicles. |
| Lithium-Sulphur Battery | A rechargeable battery that replaces the liquid or polymer electrolyte found in current lithium-ion batteries with sulfur. They have more capacity than Li-ion batteries. |
| Micromobility | Micromobility is one of the many modes of transport involving very-light-duty vehicles to travel short distances. These means of transportation include bikes, e-scooters, e-bikes, mopeds, and scooters. Such vehicles are used on a sharing basis for covering short distances, usually five miles or less. |
| Low Speed Electric Vehicls (LSEVs) | They are low speed (usually less than 25 kmph) light vehicles that do not have an internal combustion engine, and solely use electric energy for propulsion. |


Research Methodology
Mordor Intelligence follows a four-step methodology in all its reports.
- Step-1: Identify Key Variables: To build a robust forecasting methodology, the variables and factors identified in Step-1 are tested against available historical market numbers. Through an iterative process, the variables required for market forecast are set and the model is built based on these variables.
- Step-2: Build a Market Model: Market-size estimations for the historical and forecast years have been provided in revenue and volume terms. Market revenue is calculated by multiplying the volume demand with volume-weighted average battery pack price (per kWh). Battery pack price estimation and forecast takes into account various factors affecting ASP, such as inflation rates, market demand shifts, production costs, technological developments, and consumer preferences, providing estimations for both historical data and future trends.
- Step-3: Validate and Finalize: In this important step, all market numbers, variables, and analyst calls are validated through an extensive network of primary research experts from the market studied. The respondents are selected across levels and functions to generate a holistic picture of the market studied.
- Step-4: Research Outputs: Syndicated Reports, Custom Consulting Assignments, Databases & Subscription Platforms


