
Asia-Pacific OTT Market Size and Share
Market Overview
| Study Period | 2020 - 2031 |
|---|---|
| Forecast Data Period | 2026 - 2031 |
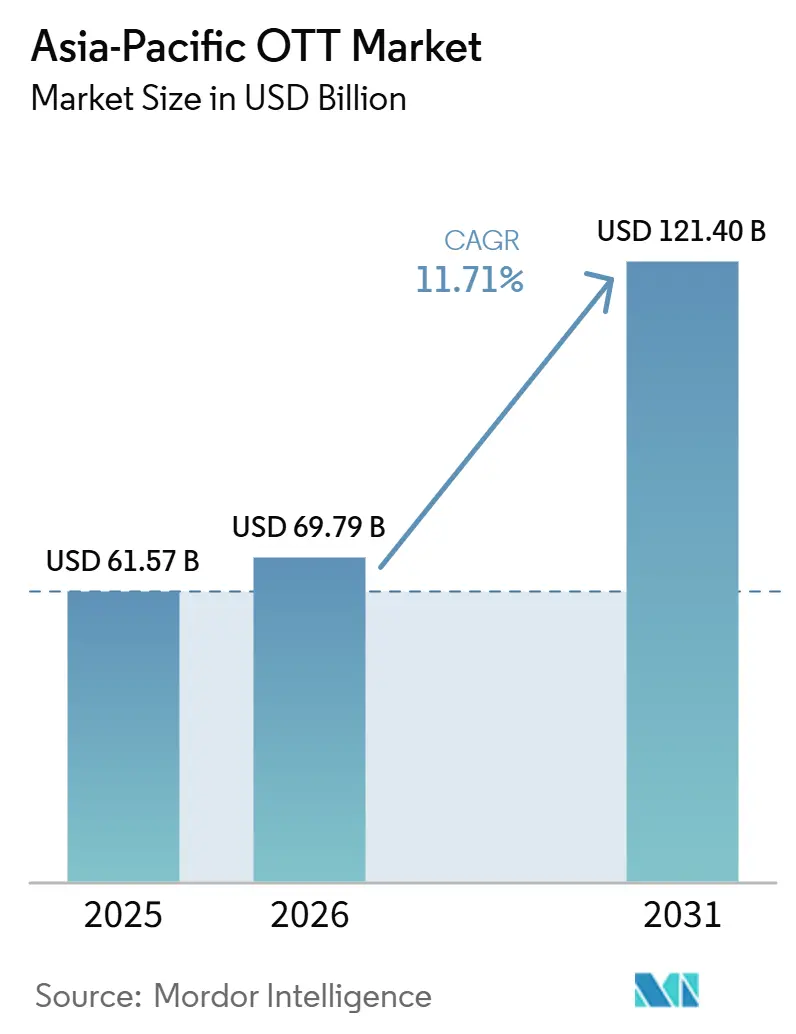
| Base Year Market Size (2025) | USD 61.57 Billion |
| Market Size (2026) | USD 69.79 Billion |
| Market Size (2031) | USD 121.40 Billion |
| Growth Rate (2026 - 2031) | 11.71 % |
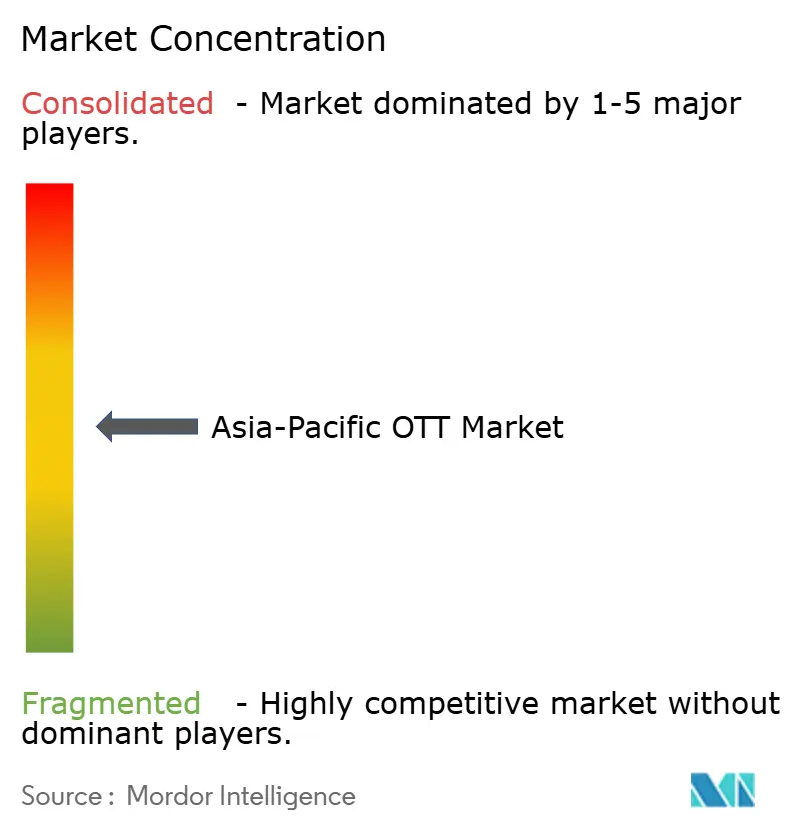
| Market Concentration | Medium |
Major Players *Disclaimer: Major Players sorted in no particular order Image © Mordor Intelligence. Reuse requires attribution under CC BY 4.0. | |
Asia-Pacific OTT Market Analysis by Mordor Intelligence
The Asia-Pacific OTT market size was valued at USD 61.57 billion in 2025 and is estimated to grow from USD 69.79 billion in 2026 to reach USD 121.40 billion by 2031, at a CAGR of 11.71% during the forecast period (2026-2031). The Asia-Pacific OTT market is moving from audience acquisition toward stronger monetization, as providers combine subscriptions, advertising, sports rights, and telecom distribution in ways that fit local purchasing power and different viewing habits. Large-screen viewing is becoming more important alongside mobile viewing, increasing the commercial value of connected television advertising and premium long-form programming while changing how providers package content for households. Local programming has become central to retention because audiences increasingly expect stories, languages, and formats that reflect their own markets and cultural preferences rather than a single regional catalog. The Asia-Pacific OTT market also faces piracy, rising content costs, uneven networks, and different compliance rules across countries, which can limit the financial benefit of subscriber growth even where viewing time continues to rise. These conditions favor providers that can link broad libraries with local production, efficient distribution, accessible pricing, and advertising tools that support several forms of viewing without forcing consumers into a single payment model, while keeping their content, product design, and distribution choices aligned with widely different conditions across the region.
Key Report Takeaways
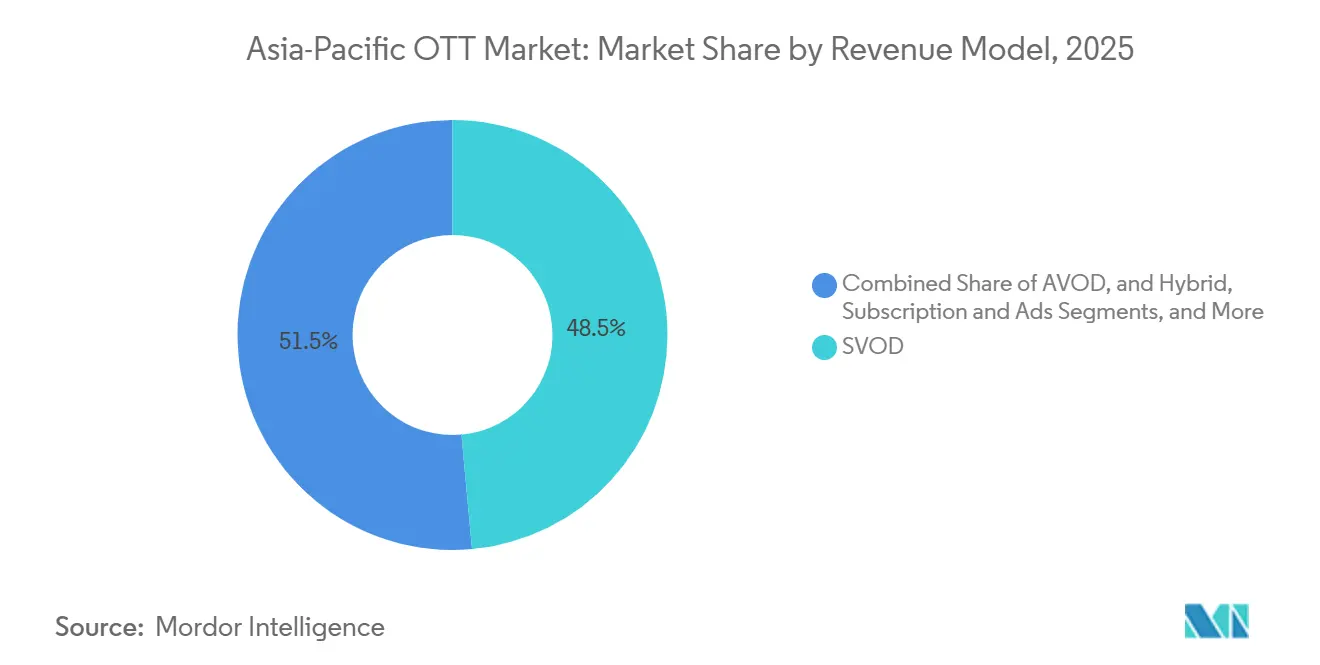
- By revenue model, SVOD held 48.50% of the Asia-Pacific OTT market share in 2025, while the hybrid subscription and ads model is projected to expand at a 12.29% CAGR through 2031.
- By device platform, smart TVs accounted for 60.50% of the Asia-Pacific OTT market size in 2025 and are projected to grow at a 12.38% CAGR through 2031.
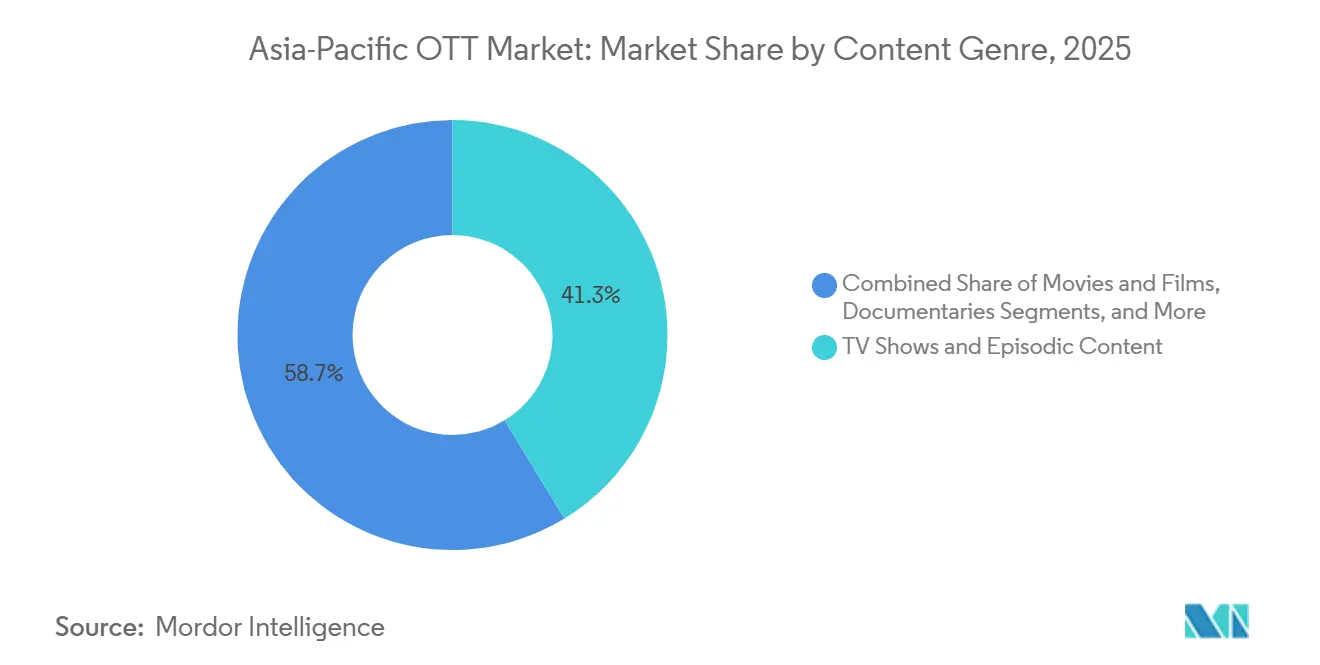
- By content genre, TV shows and episodic content held 41.28% of the Asia-Pacific OTT market share in 2025, while documentaries are expected to grow at a 13.11% CAGR through 2031.
- By geography, China held 47.50% of revenue in 2025, while India is projected to expand at a 13.15% CAGR through 2031
Note: Market size and forecast figures in this report are generated using Mordor Intelligence’s proprietary estimation framework, updated with the latest available data and insights as of January 2026.
Asia-Pacific OTT Market Trends and Insights
Drivers Impact Analysis*
| Driver | (~) % Impact on CAGR Forecast | Geographic Relevance | Impact Timeline |
|---|---|---|---|
| Rising Mobile-First Video Consumption | +2.5% | Asia-Pacific, with the strongest relevance in India, Indonesia, the Philippines, and Vietnam | Short term (≤ 2 years) |
| Telecom Bundling and Zero-Rating Partnerships | +2.0% | Asia-Pacific, with intensive activity in Southeast Asia, India, and Japan | Medium term (2-4 years) |
| Local Language and Regional Original Content Demand | +1.8% | India, Indonesia, South Korea, Japan, and Thailand | Medium term (2-4 years) |
| Connected TV Advertising Migration | +1.5% | India, Australia, Japan, South Korea, and Indonesia | Medium term (2-4 years) |
| Hybrid Monetization Adoption Among Price-Sensitive Users | +1.2% | India and Southeast Asia, with spillover to South Korea and Australia | Long term (≥ 4 years) |
| Sports and Live Event Streaming Rights Expansion | +0.8% | India, Australia, Japan, and South Korea | Long term (≥ 4 years) |
| Source: Mordor Intelligence | |||
Rising Mobile-First Video Consumption
Mobile viewing remains a core source of demand in the Asia-Pacific OTT market, especially where smartphones are the primary personal screen. India had more than 547 million video streamers in early 2025, and most accessed video primarily through mobile devices. Platforms serving Indonesia, Vietnam, and the Philippines increasingly treat adaptive bitrate delivery and offline downloads as basic retention capabilities rather than optional features. These functions matter because network quality can determine whether viewers complete a trial period and renew a subscription. Fixed broadband remains uneven in several countries, so mobile network quality continues to set a practical limit on viewing frequency and session length. Lower-income consumers in Southeast Asia are particularly sensitive to mobile data costs, making zero-rated access and low-cost short-form plans important tools for converting casual users into paying viewers.
Telecom Bundling and Zero-Rating Partnerships
Telecom operators are active commercial partners in the Asia-Pacific OTT market because bundled plans can reduce subscriber acquisition costs and keep customers within a carrier ecosystem. Their distribution reach can influence platform adoption as much as a content library does in mobile-first countries. iQIYI and Telkomsel expanded the iQIYI Starship Project in Indonesia during 2025, covering mobile bundles, joint original production, and localized content. Telekom Malaysia introduced Malaysia’s first Netflix-bundled postpaid mobile plan in August 2025, while Rakuten Mobile and U-NEXT combined unlimited data with a streaming package in Japan.[1]Rakuten Mobile, Inc., “Rakuten Mobile and U-NEXT Partner to Deliver Unlimited Data and Entertainment With ‘Rakuten Saikyo U-NEXT’ Package,” Rakuten Mobile, rakuten.co.jp Bundles can lower the immediate payment barrier by bundling connectivity and video services into a single customer bill. They can also give platforms access to customers who may not search for a standalone streaming service or enter payment details for a separate subscription.
Local Language and Regional Original Content Demand
The Asia-Pacific OTT market depends increasingly on local-language programming because regional stories can improve both discovery and repeat viewing. Indonesian originals reached the same 30% premium video-on-demand viewership share as Korean content in Southeast Asia during the fourth quarter of 2025. This result showed that local productions could compete with an established regional content category when production quality and distribution improve. Netflix commissioned 62 Asia-Pacific titles in the first quarter of 2026, with work focused on Thai BL and GL drama, Indonesian horror and folklore thrillers, Filipino melodramas, and partnerships in Northeast Asia. Platforms with limited original production capacity face a more difficult position because local programming is becoming a retention requirement rather than only an acquisition tool. This makes long-term local intellectual property pipelines more important than short-term licensing arrangements for the Asia-Pacific OTT market, especially when licensed titles can move between competing services.
Connected TV Advertising Migration
Connected television is expanding the commercial role of the living-room screen in the Asia-Pacific OTT market. Larger screens can support longer sessions for films, episodic series, and live events than many mobile viewing occasions. This gives advertisers a setting that can accommodate premium video placements and shared household viewing. Platforms must still improve measurement across device makers, streaming services, and advertising-supported channels. Fragmented reporting makes it harder for buyers to compare audience reach, frequency, and outcomes across services. Clearer targeting and comparable reporting will affect how quickly advertising budgets move to connected television inventory.
Restraints Impact Analysis*
| Restraint | (~) % Impact on CAGR Forecast | Geographic Relevance | Impact Timeline |
|---|---|---|---|
| Piracy and Unauthorized Streaming Leakage | -1.8% | Vietnam, Indonesia, Malaysia, and the Philippines | Short term (≤ 2 years) |
| Content Licensing and Production Cost Inflation | -1.5% | Global, with concentrated pressure in Japan, Australia, and South Korea | Long term (≥ 4 years) |
| Network Quality Gaps Outside Tier 1 Cities | -0.8% | Indonesia, Vietnam, the Philippines, and rural India | Medium term (2-4 years) |
| Fragmented Regulation Across Major Asia-Pacific Markets | -0.5% | Asia-Pacific, with high relevance in India, China, and Australia | Long term (≥ 4 years) |
| Source: Mordor Intelligence | |||
Piracy and Unauthorized Streaming Leakage
Piracy remains a material revenue constraint for the Asia-Pacific OTT market because unauthorized services continue to reach large audiences. An Asia Video Industry Association consumer survey of 10,184 respondents across 8 markets found that 44% had accessed pirated content in early 2026, compared with 46% in 2025.[2]Asia Video Industry Association Coalition Against Piracy and YouGov, “AVIA 2026 Consumer Survey: In APAC, Piracy Rates Decline but Cyber-Risks Are Still Underestimated,” Piracy Monitor, piracymonitor.org The rate remained above 48% in Vietnam, Indonesia, Malaysia, and the Philippines, where blocking measures are still developing or unevenly applied. The same survey found that 73% of piracy users would pay for legal content in some form if unauthorized services were unavailable, while 42% would consider a paid streaming subscription. More than half of the respondents who knew about blocked services in Indonesia and Vietnam said they had reduced or stopped their use. These findings make enforcement and affordable legal alternatives relevant parts of platform conversion strategies.
Content Licensing and Production Cost Inflation
Content costs constrain the Asia-Pacific OTT market because platforms must fund local originals, premium international programs, and sports rights while seeking profitable growth. Competition for live sports and premium entertainment rights can establish higher price expectations across regional licensing negotiations. Production costs for Korean, Japanese, and Australian originals have risen since 2019, although the region has remained a more cost-efficient production base than the United States and the United Kingdom. The cost advantage is narrowing as competition for local talent increases. In India, OTT content spending fell 18% during 2025 to INR 21.8 billion (USD 258 million), as platforms shifted attention from volume toward profitability. This approach can reduce mid-budget production pipelines and concentrate investment in fewer programs with more certain commercial prospects.
*Our forecasts treat driver/restraint impacts as directional, not additive. The impact forecasts reflect baseline growth, mix effects, and variable interactions.
Segment Analysis
By Revenue Model: SVOD Leads While Hybrid Models Gain Ground
SVOD held 48.50% of the Asia-Pacific OTT market revenue in 2025, reflecting the role of subscription plans in China, Japan, South Korea, and Australia. The hybrid subscription and ads model is forecast to grow at a 12.29% CAGR through 2031. The model combines an ad-supported entry tier with paid upgrades for viewers who want added content, earlier access, or fewer ads during their sessions. This structure gives platforms a way to reach price-sensitive consumers without giving up higher-value subscription options, and it lets viewers move between tiers as their willingness to pay changes. JioHotstar had more than 260 million paid subscriptions and averaged 530 million monthly active users in the April-June 2026 quarter, showing how a single service can serve paid access and broad advertising-supported reach at a substantial scale.
TVOD remains a smaller but important part of the Asia-Pacific OTT market, particularly for premium theatrical releases and exclusive live events where access has a clear time-bound value. One-time payments can appeal to consumers who do not want a recurring subscription or do not watch enough content to justify one. AVOD has stronger relevance in Indonesia, Vietnam, and the Philippines, where income sensitivity can limit subscription conversion while advertising inventory improves across mobile and connected television screens. Smart television adoption and better mobile advertising inventory support this model by creating more sellable video impressions for brands seeking reach beyond traditional television. JioStar tested commerce integration during IPL 2026 live streams, and half of the resulting food-delivery orders came from Tier-II cities, indicating a possible revenue path beyond advertising and subscriptions.



By Device Platform: Smart TVs Reshape Viewing and Advertising
Smart TVs accounted for 60.50% of Asia-Pacific OTT device platform revenue in 2025 and are projected to expand at a 12.38% CAGR through 2031. Large-screen viewers often have premium demographic profiles and can generate higher advertising yields per impression than mobile-only audiences, especially when households watch together. Connected television supports longer sessions for episodic programming, films, and live sports, which can improve the commercial value of inventory and make long-form programming easier to present. This makes smart television increasingly important to advertising-supported platforms and to services seeking to present premium content in a living-room setting that resembles established television viewing. The Asia-Pacific OTT market benefits when fiber networks, affordable smart televisions, simple payment options, and easy-to-use streaming interfaces improve together.
Smartphones and tablets still lead device use by audience count in India, Indonesia, and Vietnam. These markets have uneven fixed broadband coverage, and viewers often choose shorter and more frequent mobile sessions that fit commuting, work, and other daily routines. Connected television behavior is also strengthening in Indonesia and the Philippines, where large-screen viewing time and session length increased during 2025, suggesting that mobile-first habits can coexist with household viewing. Laptops and desktops retain a smaller, stable role among younger urban users and people who work from home, particularly where screens are already used for study or work. Gaming consoles and legacy set-top boxes are losing relative importance as smart TVs and mobile devices capture more viewing time and provide more direct access to applications.
By Content Genre: Episodic Programs Lead Engagement While Documentaries Grow
TV shows and episodic content held 41.28% of the Asia-Pacific OTT market revenue in 2025. Korean drama continued to shape audience demand, while Southeast Asian originals gained stronger visibility with viewers seeking familiar language, local settings, and characters that reflect domestic experience. Local titles reached 44-46% of users in Indonesia and Thailand during 2025, showing a growing role for domestic programming and a wider range of viewing choices than imported programs alone provide. iQIYI reported that its micro-drama library had passed 50,000 titles by the end of 2025.[3]iQIYI, Inc., “iQIYI Reports Strong H1 2026 Content Results, Cementing Its Position as China’s Premier Streaming Destination,” iQIYI, iqiyi.com The company also reported 98% year-on-year growth in viewing duration for original Chinese animation during the first half of 2026.
Documentaries are projected to grow at a 13.11% CAGR through 2031, the fastest rate among content genres. Factual programming can offer lower production costs and a different risk profile from scripted drama, which can help platforms balance their overall content slate without relying only on expensive scripted releases. Japan, South Korea, and Australia support the category through established factual production and public broadcasting traditions that have familiarized viewers with documentary formats. Films remain important for TVOD release windows and for simultaneous theatrical and streaming availability, particularly when exclusivity can support a one-time purchase. Anime, variety shows, live sports, and creator-led formats also help platforms appeal to different age groups, interests, and viewing occasions.
Geography Analysis
China held 47.50% of Asia-Pacific OTT revenue in 2025, giving it the largest regional revenue position. The country has a largely self-contained digital video ecosystem led by iQIYI, Tencent Video, and Youku. China, Japan, Australia, South Korea, and India accounted for 88% of regional online video revenue in 2025. China contributed 46%, Japan 17%, Australia 10%, and South Korea and India together contributed 14%.[4]Asia Video Industry Association, “Asia Video Industry Report 2026,” Asia Video Industry Association, avia.org iQIYI’s micro-drama library exceeded 50,000 titles, and the company reported growth in original Chinese animation viewing during the first half of 2026.
India is forecast to grow at a 13.15% CAGR through 2031, the fastest rate in the Asia-Pacific OTT market. JioHotstar averaged 530 million monthly active users in the April-June 2026 quarter, while IPL 2026 reached 700 million digital viewers. JioStar reported INR 10,946 crore (USD 1.14 billion) in revenue from operations for the quarter ended June 30, 2026. India had 68 million connected television households in 2025, and 40 million were active weekly. Australia remains a mature subscription market where premium sports programming is an important differentiator, and Nine secured exclusive Premier League and Emirates FA Cup rights for Stan Sport for the 2025-26 season.
Indonesia, the Philippines, Vietnam, and other Asia-Pacific markets are building subscriptions from a lower monetization base. The Asia-Pacific OTT market in these countries depends on stronger content quality, affordable access, and telecom distribution. Indonesian original series matched Korean dramas in premium VOD viewership rankings during the fourth quarter of 2025, reflecting better production quality, stronger distribution, and greater audience confidence in local stories. beIN Asia Pacific renewed Formula 1 rights for 5 years across 10 Asian territories, supporting live streaming access in markets including Indonesia, Malaysia, Thailand, and Singapore, while TrueVisions NOW holds exclusive streaming rights for the 33rd SEA Games and the 13th ASEAN Para Games in Thailand.
Competitive Landscape
The Asia-Pacific OTT market is becoming more focused on aggregation and bundling than direct subscriber competition. The top 15 online video platforms captured 58% of total online video revenue in 2025. Global services, telecom-backed platforms, sports specialists, and domestic providers all compete for audience time and distribution access, rather than only for paid subscribers. Mid-sized services increasingly need broader catalogs, carrier relationships, or valuable sports and local programming to maintain relevance. This competitive structure makes content access, customer billing, and device availability important parts of platform strategy.
Amazon Prime Video is positioning itself as an entertainment hub in the region, combining subscriptions, transactional video, add-on channels, and advertising-supported offers in one interface. This approach gives consumers a single place to select among several forms of video access and reduces the need to move between separate applications. JioHotstar has used conversational discovery, multilingual voice search, and an AI-generated microdrama to make content discovery and production more efficient. iQIYI stated that AI-assisted production tools reduced domestic content production costs by 15-20% by 2025. Smaller services may struggle to match this combination of local commissioning capability, technology investment, broad libraries, and regional distribution, particularly when larger services can spread content costs across several countries.
China’s content standards and platform environment are governed by the National Radio and Television Administration. Services operating across countries must also manage Australia’s Online Safety Act and India’s Information Technology Rules 2021. WOWOW and NTT DOCOMO announced a capital and business alliance during June 2026 to create a joint venture that will control Lemino, with WOWOW set to acquire a 51% stake effective October 1, 2026. Such alliances show why scale, local content, and distribution are closely linked in the Asia-Pacific OTT market.
Asia-Pacific OTT Industry Leaders
Netflix, Inc.
Alphabet Inc.
The Walt Disney Company
Amazon.com, Inc.
Paramount, a Skydance Corporation
- *Disclaimer: Major Players sorted in no particular order

Recent Industry Developments
- July 2026: iQIYI disclosed strong H1 2026 content results, with its micro-drama library surpassing 50,000 titles and original Chinese animation viewing duration growing 98% year-on-year, reinforcing the company’s IP-centric strategy as the core lever for membership and advertising revenue growth in China’s competitive streaming market.
- June 2026: WOWOW Inc. announced a capital and business alliance with NTT DOCOMO to establish a joint venture controlling Lemino, NTT DOCOMO’s streaming service, with WOWOW acquiring a 51% stake effective October 1, 2026. The deal targets synergies in entertainment video distribution and is positioned to develop globally competitive IP within Japan’s increasingly consolidated OTT market.
- February 2026: Reliance Strategic Business Ventures Limited acquired a 50.1% equity stake in Sikhya Entertainment Private Limited for INR 150 crore (USD 17.5 million), enabling Jio Studios to expand its original content pipeline and strengthen JioHotstar’s programming slate across Hindi and regional Indian language genres.
- December 2025: iQIYI International announced a partnership with Vision+ (MNC Digital Entertainment, Indonesia) to launch the “Combo Asia” joint membership service in Indonesia, integrating Chinese dramas, sports events, movies, anime, and variety content with Vision+’s sports resources under a single subscription.


Asia-Pacific OTT Market Report Scope
Asia-Pacific OTT market refers to the revenue and ecosystem generated by internet-delivered video services, SVOD, AVOD, TVOD, and hybrid models across Asia-Pacific countries, including China, India, Japan, South Korea, and Southeast Asia. It spans OTT TV and video platforms, streaming apps, and connected‑TV services that bypass traditional broadcast and pay‑TV.
The Asia-Pacific OTT Market Report is Segmented by Revenue Model (SVOD, AVOD, TVOD, and Hybrid, Subscription and Ads), Device Types (Smartphones and Tablets, Smart TVs, and Laptops and Desktops), Content Genre (Movies and Films, TV Shows and Episodic Content, and Documentaries), Geography (China, India, Japan, South Korea, Australia, and Indonesia). The Market Forecasts are Provided in Terms of Value (USD).
| SVOD |
| AVOD |
| TVOD |
| Hybrid, Subscription and Ads |
| Smartphones and Tablets |
| Smart TVs |
| Laptops and Desktops |
| Other Device Platforms |
| Movies and Films |
| TV Shows and Episodic Content |
| Documentaries |
| Other Content Genres |
| China |
| India |
| Japan |
| South Korea |
| Australia |
| Indonesia |
| Rest of Asia-Pacific |
| By Revenue Model | SVOD |
| AVOD | |
| TVOD | |
| Hybrid, Subscription and Ads | |
| By Device Platform | Smartphones and Tablets |
| Smart TVs | |
| Laptops and Desktops | |
| Other Device Platforms | |
| By Content Genre | Movies and Films |
| TV Shows and Episodic Content | |
| Documentaries | |
| Other Content Genres | |
| By Geography | China |
| India | |
| Japan | |
| South Korea | |
| Australia | |
| Indonesia | |
| Rest of Asia-Pacific |


Key Questions Answered in the Report
What is the Asia-Pacific OTT market size?
The Asia-Pacific OTT market size is estimated at USD 69.79 billion in 2026 and is forecast to reach USD 121.40 billion by 2031 at an 11.71% CAGR. The forecast reflects continued demand for local programs, mobile access, connected television viewing, and more flexible monetization models.
Which revenue model leads in Asia-Pacific OTT services?
SVOD led with 48.50% of revenue in 2025. Hybrid subscription and advertising models are projected to grow fastest at a 12.29% CAGR through 2031.
Why are smart TVs important for OTT providers in Asia-Pacific?
Smart TVs generated 60.50% of device platform revenue in 2025 and are projected to grow at a 12.38% CAGR through 2031. They support longer viewing sessions and higher-value advertising.
Which content type has the strongest growth outlook?
Documentaries are forecast to grow at a 13.11% CAGR through 2031, supported by factual programming demand and comparatively lower production costs.
Which country is growing fastest for OTT services in Asia-Pacific?
India is projected to record the fastest growth at a 13.15% CAGR through 2031, supported by large streaming audiences, connected television adoption, and sports programming.
What is limiting growth for streaming platforms in Asia-Pacific?
Piracy, rising content costs, network quality gaps beyond major cities, and differing regulations across countries can limit revenue growth and profitability.
Page last updated on:





