Market Overview
| Study Period | 2020 - 2031 |
|---|---|
| Forecast Data Period | 2026 - 2031 |
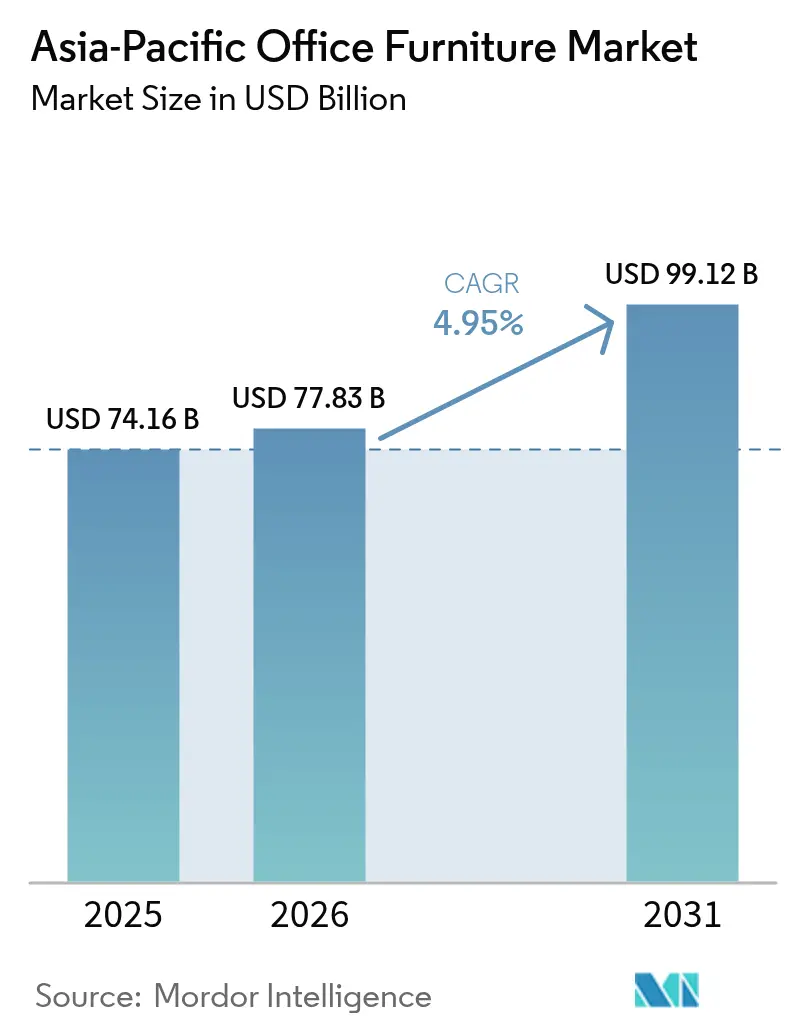
| Base Year Market Size (2025) | USD 74.16 Billion |
| Market Size (2026) | USD 77.83 Billion |
| Market Size (2031) | USD 99.12 Billion |
| Growth Rate (2026 - 2031) | 4.95% CAGR |
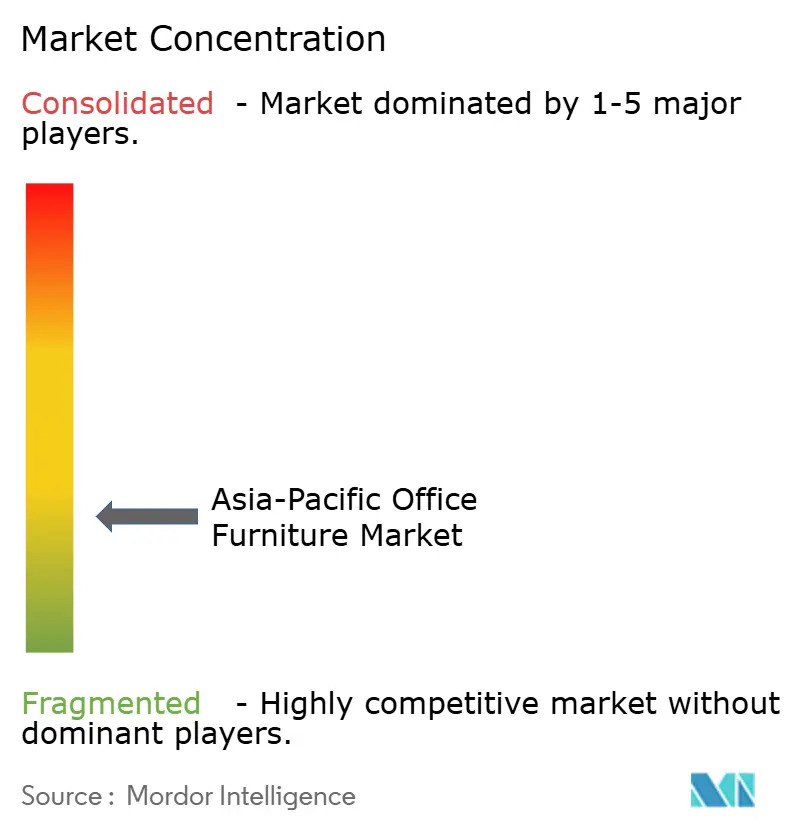
| Market Concentration | Low |
Major Players *Disclaimer: Major Players sorted in no particular order Image © Mordor Intelligence. Reuse requires attribution under CC BY 4.0. | |
Asia-Pacific Office Furniture Market Analysis by Mordor Intelligence
Asia-Pacific Office Furniture market size in 2026 is estimated at USD 77.83 billion, growing from 2025 value of USD 74.16 billion with 2031 projections showing USD 99.12 billion, growing at 4.95% CAGR over 2026-2031.
This growth places the Asia-Pacific office furniture market size at the core of the region’s return-to-office revival and hybrid workplace transformation. The rise in the in-person workforce share between 2023 and 2024 has prompted enterprises to reconfigure floor plans, invest in AI-driven smart desk solutions, and align with increasingly stringent indoor air quality regulations. Corporations are reallocating capital from remote-work stipends to wellness-centric chairs and touch-free workstation systems, while government infrastructure programs and foreign direct investment funnel new projects into Tier II and emerging satellite cities. Furniture producers manage volatility in wood and metal costs by diversifying supplier bases and signing long-term contracts, and they capture margin through circular-economy leasing that meets ESG scorecard requirements. Despite supply-chain complexity, the Asia-Pacific office furniture market benefits from resilient regional GDP, rising co-working penetration, and a creative push toward modular, data-rich products that satisfy both real-estate efficiency and employee experience goals.
Key Report Takeaways
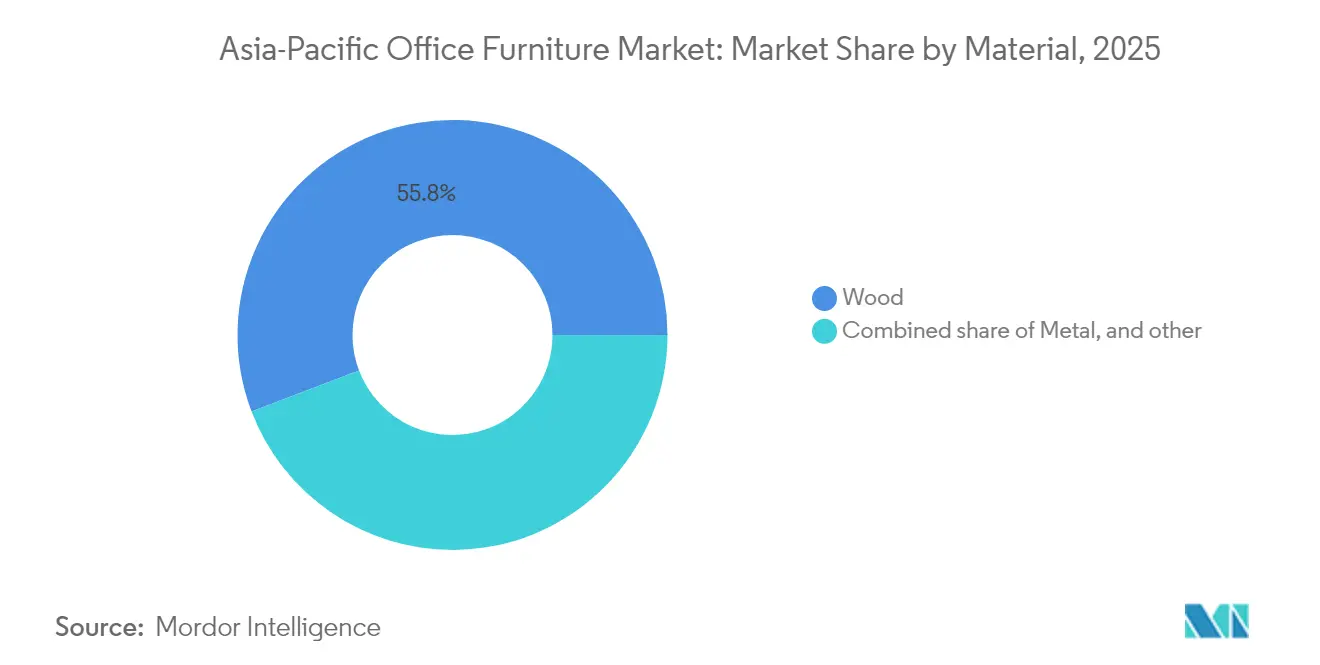
- By material, wood accounted for 55.78% of the Asia-Pacific office furniture market size in 2025, and plastics are forecast to advance at a 10.05% CAGR.
- By product, swivel chairs and desks captured 25.86% of the Asia-Pacific office furniture market size in 2025, whereas smart desks are poised for a 11.78% CAGR.
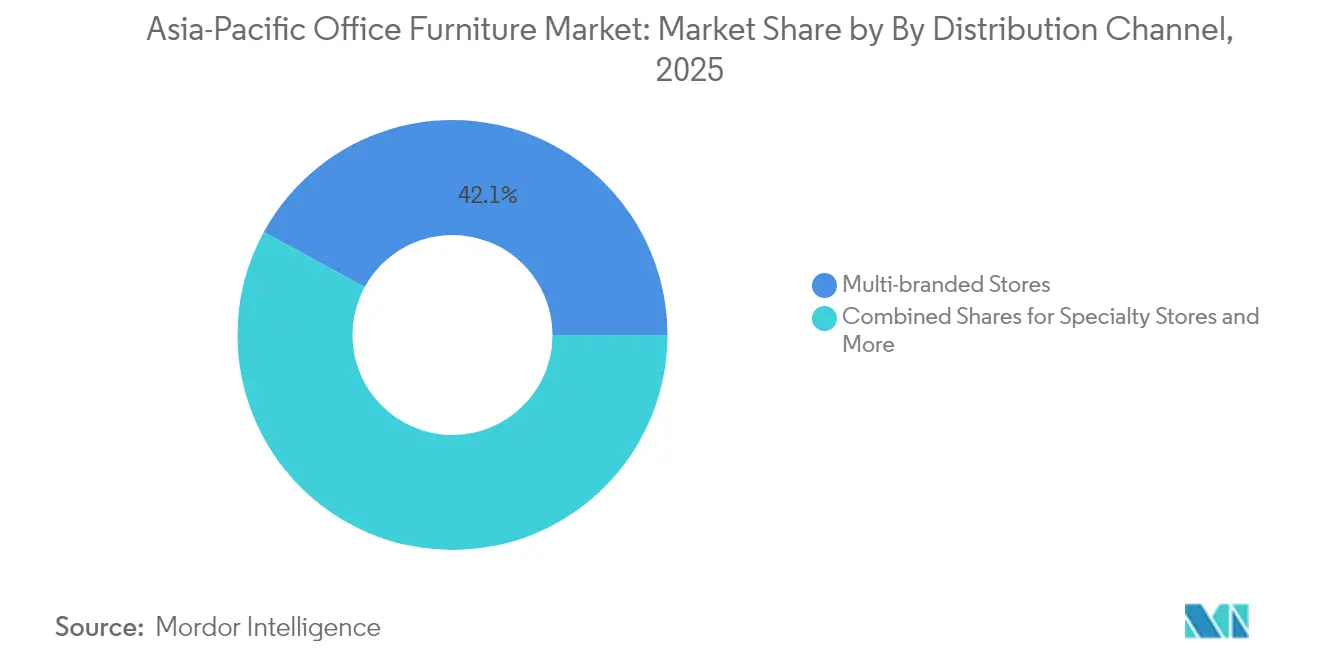
- By distribution channel, multi-branded stores led with a 42.05% revenue share of the Asia-Pacific office furniture market in 2025; online platforms will accelerate at a 14.7% CAGR.
- By geography, China held 38.75% of the Asia-Pacific office furniture market share in 2025, while the Kyushu-Okinawa subregion is projected to expand at an 10.95% CAGR through 2031.
Note: Market size and forecast figures in this report are generated using Mordor Intelligence’s proprietary estimation framework, updated with the latest available data and insights as of 2026.
Asia-Pacific Office Furniture Market Trends and Insights
Drivers Impact Analysis*
| Driver | (~) % Impact on CAGR Forecast | Geographic Relevance | Impact Timeline |
|---|---|---|---|
| Post-pandemic expansion of co-working spaces | +1.2% | India, Singapore, urban China | Medium term (2-4 years) |
| Government-led infrastructure investments in commercial real estate | +0.9% | India and the core Southeast Asia markets | Long term (≥ 4 years) |
| Rising demand for ergonomic and wellness-centric workstations | +0.8% | Japan, Australia, Singapore | Medium term (2-4 years) |
| Adoption of modular furniture to optimise high-rent micro-offices | +0.7% | Hong Kong, Singapore, Tokyo, tier-1 Chinese cities | Short term (≤ 2 years) |
| ESG mandates that shift procurement toward circular-economy leasing | +0.6% | Australia, Japan, multinational campuses | Long term (≥ 4 years) |
| Digital transformation of workplace planning via AI-driven layout tools | +0.5% | South Korea, Japan, urban India | Short to Medium term (1–3 years) |
| Source: Mordor Intelligence | |||
Post-pandemic Expansion of Co-working Spaces
The Asia-Pacific region, which hosts the highest number of co-working hubs globally, is projected to witness operators expanding their presence from 5,889 venues to over 10,000 within the next decade. In India, the flexible workspace segment experienced a reduction in vacancy rates, while in Singapore, co-working spaces accounted for 4.2% of the total office stock, accompanied by an upward trend in average desk prices[1]OSdoro, “Coworking Space Market Report 2024,” osdoro.com.sg . Modular desks, lightweight chairs, and reconfigurable storage allow landlords to convert suites overnight for new tenants, keeping the Asia-Pacific office furniture market on a steady growth climb. Operators prefer furnishings that break down quickly for relocation, reinforcing demand for tool-free joints and quick-lock fittings. Cloud-connected smart desks help manage booking systems, so asset owners can monetize under-utilized zones and prove utilization to investors. Co-working’s service-oriented mindset also accelerates furniture-leasing contracts that bundle maintenance and eventual take-back, cementing a subscription revenue layer for manufacturers.
Government-led Infrastructure Investments in Commercial Real Estate
India’s Smart Cities Mission, Make in India incentives, and foreign developer commitments such as Sumitomo Realty’s USD 3.34 billion Mumbai project expand the Asia-Pacific office furniture market by opening fresh corridors of commercial space[2]Kokuyo Corporation, “ingCloud Chair Launch,” prtimes.jp . Tier II cities benefit from upgraded metro links and IT parks, widening the customer base beyond Bengaluru and Mumbai. Southeast Asia’s 4.6% 2024 GDP growth, coupled with favourable demographics, underpins new office-tower pipelines that require full fit-outs. Builders often bundle furniture procurement with design-build contracts, accelerating volume orders even before occupancy. As regional governments court international tenants, premium ESG standards are embedded in tender documents, steering procurement to certified low-VOC and recyclable products. These long-cycle developments sustain baseline demand even if short-term real-estate cycles soften elsewhere.
Rising Demand for Ergonomic & Wellness-centric Workstations
Businesses are increasingly aligning workplace comfort with employee retention strategies, as real estate leaders in the Asia-Pacific region prioritize employee wellness as a critical factor in furniture selection. Kokuyo’s ingCloud chair, launched at Orgatec Tokyo 2025, demonstrates adaptive mechanisms that auto-balance weight shifts and reduce lumbar strain[3]Nikkei Asia, “Sumitomo Realty to Pump USD 3.3 Billion into India,” nikkei.com . Haworth’s “Neuro Comfort” concepts supplement physical ergonomics with sensory design that lowers cognitive load. Buyers view premium seating as an investment in reduced injury claims and productivity gains, justifying price points above conventional task chairs. Certified solutions with GREENGUARD or BIFMA LEVEL marks now dominate large RFPs, pushing suppliers to re-engineer upholsteries with low-emission foams and bio-based fabrics. The Asia-Pacific office furniture market, therefore, tilts toward products that blend data analytics, adjustable geometry, and sustainable material stories.
Adoption of Modular Furniture to Optimise High-rent Urban Micro-offices
Cities such as Hong Kong and Singapore command the region’s highest fit-out costs; tenants combat expense by compressing private footprints and installing modular walls, telescopic desks, and slide-away benches. Quick-release connectors let staff re-shape rooms between focus work and team huddles, boosting utilization metrics that CFOs monitor closely. Manufacturers serve this niche with slimmer steel gauge frames, fold-flat chair backs, and stackable storage that reduces freight cube. High-density offices command furniture that installs after hours and leaves no floor damage, fuelling adhesive-free cable-management trays and clamp-on acoustic screens. Modular kits are also popular with fit-out contractors, who save labour through off-site assembly and minimize punch-list delays. The Asia-Pacific office furniture market continues to innovate around space-saving without sacrificing durability or aesthetics.
Restraints Impact Analysis*
| Restraint | (~) % Impact on CAGR Forecast | Geographic Relevance | Impact Timeline |
|---|---|---|---|
| Volatility in raw-material prices (wood and metal) | -0.8% | China, Vietnam, and Malaysia manufacturing clusters | Short term (≤ 2 years) |
| Slowdown in commercial real estate development in tier-1 Chinese cities | -1.1% | Beijing, Shanghai, Shenzhen ecosystem | Medium term (2-4 years) |
| Stringent indoor-air-quality certifications are driving compliance costs | -0.4% | Australia, Japan, Singapore, premium segments | Long term (≥ 4 years) |
| Rising logistics and cross-border shipping costs post-RCEP implementation delays | -0.6% | Southeast Asia export hubs, India, Australia | Short to Medium term (1–3 years) |
| Source: Mordor Intelligence | |||
Volatility in Raw-material Prices
Vietnam’s USD 289 million office-furniture export surge in 2024 underscored its reliance on timber inputs that swing with global demand. Indonesia’s SVLK Plus verification elevates transparency but adds audit fees, while fluctuations in steel futures complicate cost forecasts for metal bases. Manufacturers hedge with multi-year supply contracts and mixed-material designs, yet margin compression still trickles through to price-sensitive clients. Larger brands absorb shocks through scale and digital demand-planning systems that reroute orders to alternate plants. Persistent cost shifts may defer discretionary upgrades, especially among SMEs that lack lease-back options.
Slowdown in Commercial Real Estate Development in Tier-1 Chinese Cities
Distressed asset sales currently represent over one-fifth of total transactions, exerting significant pressure on developer liquidity and subsequently slowing procurement activities. To address the challenges posed by oversupply, landlords are increasingly adopting strategies to subdivide large towers into smaller, more manageable suites. This approach prioritizes incremental refurbishments over full-scale suite installations, enabling cost optimization and better alignment with tenant demand. The departure of certain foreign occupiers has led to a decline in demand for premium-grade office spaces. However, this market shift has opened new opportunities for local brands to cater to cost-conscious domestic firms, effectively filling the void left by international players. Vendors are strategically realigning their offerings to focus on renovation kits, ergonomic retrofit solutions, and after-market acoustic panels. These solutions provide property owners with cost-efficient options to modernize and enhance interiors, meeting the growing demand for affordable yet impactful upgrades in the current market environment.
*Our forecasts treat driver/restraint impacts as directional, not additive. The impact forecasts reflect baseline growth, mix effects, and variable interactions.
Segment Analysis
By Material: Wood Dominance Faces Sustainable Disruption
Wood continued to hold a commanding 55.78% of the Asia-Pacific office furniture market share in 2025 because buyers associate solid timber with executive status, long service life, and a warmer aesthetic than laminate substitutes. Vietnamese exporters delivered USD 289 million of wood-office furniture last year, taking advantage of upgraded kiln-drying capacity and U.S. market demand. Yet plastics exhibit the fastest 10.05% CAGR as furniture engineers incorporate recycled polypropylene and bio-PET to cut freight weights and lower embodied carbon. Metal subframes remain critical for premium height-adjustable desks that support heavier monitors and cable runs, although aluminium and thin-wall steel tubing help shrink raw-material tonnage.
Emerging composites, such as bamboo fibre boards and recycled ocean-plastic panels, provide ESG-focused clients with storytelling value, allowing suppliers to differentiate amid commodity timber. The Asia-Pacific office furniture market size tied to sustainable lines rises each tender cycle as procurement audits include chain-of-custody certificates. BIFMA LEVEL and Forest Stewardship Council validations bolster bidder scores, and vendors add QR-code traceability on drawer bottoms. Wood costs, however, are vulnerable to shipping bottlenecks and phytosanitary restrictions; plastic pellet prices fluctuate with crude-oil movements, demanding agile costing models. Over the forecast horizon, wood’s share is projected to erode modestly as corporate design guidelines shift toward lighter, easily disassembled components that fit closed-loop logistics.


By Product: Smart Desks Revolutionize Traditional Categories
Swivel chairs and desks still dominated demand at 25.86% of the Asia-Pacific office furniture market size in 2025 because every workstation layout requires the pairing. Manufacturers differentiate chairs through proprietary lumbar matrices, breathable mesh backs, and synchronized-tilt mechanisms, while classic panel desks now integrate wireless charging pads and concealed cable bays. Smart desks outpace all categories with a 11.78% CAGR, led by embedded occupancy sensors feed utilization dashboards, and automated height presets adjust via NFC badges when employees dock, supporting hot-desking ecosystems. Meeting-room lines pivot toward soft seating with antimicrobial fabrics that signal post-pandemic hygiene consciousness, and lounge collections blend residential comfort with contract-grade abrasion ratings.
Cloud platforms bundled with desk fleets offer subscription analytics, letting facility teams downsize underused zones without tenant attrition. Storage transitions from deep filing cabinets to rotating locker walls that slot between benching pods, supporting personal-item security for hybrid staff. Acoustic phone booths, though categorized under freestanding structures, often ship with integrated stools and fold-down worktables, adding volume to accessory revenue streams. In response, suppliers cross-train sales teams in AV integration and software interfaces, forging alliances with prop-tech firms. The Asia-Pacific office furniture market consequently redefines itself as a hardware-plus-data proposition rather than a purely physical goods sector.
By Distribution Channel: Digital Transformation Accelerates Online Growth
Multi-branded stores retained the lead with 42.05% share in 2025, leveraging experiential showrooms where buyers can test seat-depth sliders and evaluate veneer tones under office lighting. These stores invest in touch-table configurators that feed quotes directly to enterprise procurement portals, merging tactile reassurance with e-commerce convenience. Online platforms, expanding at a 14.7% CAGR, capitalize on photorealistic 3D renders, augmented-reality office scan tools, and AI chatbots that guide selection based on employee count, floor-area ratio, and brand-colour palettes. Specialty boutiques cater to premium craftsmanship, offering made-to-order conference tables etched with company logos, while other channels, such as contract dealers, bundle installation, ergonomics training, and take-back services.
Innovations in shipping processes are facilitating a significant shift in distribution channels. Flat-pack smart desks are now designed to ship in two compact boxes, each conforming to courier size and weight restrictions. This approach not only streamlines logistics but also eliminates the reliance on traditional white-glove freight services, thereby reducing costs and improving operational efficiency. Warranty and preventive-maintenance add-ons ride the same digital rails, creating annuity streams. Multi-branded operators respond by extending buy-online-pick-up-in-store models and embedding QR codes on floor samples that capture impulse corporate orders. During tender cycles, facility managers often shortlist via online catalogues and finalize finishes in person, reinforcing an omnichannel loop. The Asia-Pacific office furniture market, therefore, evolves toward data-driven channel orchestration rather than simple distribution silos.
Geography Analysis
China generated the largest revenue pool at 38.75% in 2025, but vacancy-induced discounting shifts demand from whole-tower outfitting to strategic refreshes of tenant lobbies and collaboration corners. Domestic producers seize canceled orders from multinationals downsizing local footprints, while global brands lean on project accounts in emerging cities like Chengdu, where technology firms keep expanding. India functions as the fastest value-added underpinned by Global Capability Centres and ongoing IT campus rollouts; ergonomically advanced chairs now sell into Tier II corridors such as Coimbatore and Bhubaneswar as workforces decentralize. Japan’s Kyushu-Okinawa subregion logs an 10.95% CAGR, benefiting from government relocation subsidies for shared-service operations that lighten pressure on Tokyo rents.
Australia’s mature market exhibits premium preferences because stringent NABERS ratings push buyers toward GREENGUARD-verified products, with office owners absorbing initial price premiums to command higher rents. Southeast Asia, including Vietnam, Indonesia, and Malaysia, witnesses rising demand as manufacturing relocations boost white-collar employment and spark office-park construction near industrial clusters. South Korea’s chaebol headquarters commission fully connected smart-desk arrays to align with national AI-strategy mandates, blending furniture procurement with digital-twin initiatives. Collectively, these shifts highlight how the Asia-Pacific office furniture industry adapts to divergent macro cycles, meeting China’s retrofit focus while feeding India’s and ASEAN’s fresh build pipelines.
Competitive Landscape
The Asia-Pacific office furniture market exhibits moderate fragmentation, with the leading five players collectively accounting for a substantial portion of the revenue. This market structure provides opportunities for regional specialists to strategically position themselves and capture niche segments. HNI’s USD 2.2 billion acquisition of Steelcase exemplifies consolidation designed to secure scale in raw-material procurement, digital R&D, and regional assembly hubs[4]Davis Polk, “HNI USD 2.2 Billion Acquisition of Steelcase,” davispolk.com . Haworth, MillerKnoll, and Kokuyo continue to differentiate via in-house design studios that blend neuroscience insights with industrial aesthetics, enabling premium pricing on wellness-centric ranges. Chinese firms such as Sunon and UE Furniture leverage cost advantages and rapid product cycles to win domestic tenders, although they increasingly adopt BIFMA and GREENGUARD certifications to compete abroad. Indian giant Godrej Interio invests in robotic welding and powder-coat lines to meet surging local demand while ensuring export-grade finish quality.
Technology forms the battleground for next-wave advantage with integrated IoT modules in smart desks that transmit occupancy heat maps, and AI software predicts maintenance schedules to reduce downtime. Manufacturers partner with prop-tech startups to layer subscription analytics over physical assets, shifting revenue composition toward recurring service income. Sustainability remains a decisive tender criterion; firms with LEVEL 3 certified portfolios enjoy preferred-supplier status in multinational RFPs. Regional refurbishers, including Egans, strategically generate value by remanufacturing high-quality office furniture. This approach not only reduces landfill waste but also caters to the cost-sensitive segments within the Asia-Pacific office furniture market. Cross-border M&A continues as mid-cap brands seek access to local dealer networks and integrate supply chains vertically.
Marketing strategies hinge on omnichannel presence; flagship showrooms cultivate brand story, while online configurators shorten sales cycles and capture buyer data for upselling. After-sales packages bundle ergonomic training, asset tracking, and end-of-lease removal, enhancing customer stickiness. Competitive intensity is expected to sharpen as Chinese cost leaders mature their design language and as Western giants exploit newly combined portfolios, thereby realigning the Asia-Pacific office furniture market on value-added services rather than price alone. Suppliers that master both sustainability compliance and digital-service integration are poised to outpace rivals over the forecast horizon.
Asia-Pacific Office Furniture Industry Leaders
Steelcase Inc.
Okamura Corporation
Haworth Inc.
MillerKnoll (Herman Miller)
KOKUYO Co., Ltd.
- *Disclaimer: Major Players sorted in no particular order

Recent Industry Developments
- August 2025: HNI Corporation finalized its USD 2.2 billion acquisition of Steelcase, issuing USD 7.20 cash and 0.2192 HNI shares per Steelcase share to create an entity with USD 5.8 billion annual revenue.
- May 2025: Kokuyo debuted the ingCloud chair at Orgatec Tokyo 2025, featuring a 3D Ultra Auto Fit mechanism that adapts to user movement.
- May 2024: HNI announced the closure of its Hickory, North Carolina, plant and consolidation into other facilities, targeting USD 11 million annual savings by 2026.
- February 2024: Haworth Group posted USD 2.57 billion 2023 revenue, a 3% rise year-over-year, and secured Science Based Targets Initiative-validated emissions goals.


Asia-Pacific Office Furniture Market Report Scope
Office furniture is furniture that is used in an office or home for setting to create a comfortable, functional, and organized work environment and is free-standing and does not require installation with component parts. Examples are desks, chairs, file cabinets, tables, lounge seating, and computer desks. Asia Pacific office furniture market is segmented by material, products, distribution channel, and country. Material are segmented by wood, metal, plastics, and others. Products are segmented by seating, storage units, workstations, tables, and other accessories. Distribution channels are segmented offline, and online, and countries are segmented by China, India, Japan, South Korea, Australia, New Zealand, rest of Asia Pacific. the report offers market size and forecasts for the Asia Pacific office furniture market in value (USD) for all the above segments.
By Material
| Wood |
| Metal |
| Plastics |
| Other Materials |
By Product
| Meeting Chairs |
| Lounge Chairs |
| Swivel Chairs |
| Office Tables |
| Storage Cabinets |
| Desks |
By Distribution Channel
| Multi-branded Stores |
| Specialty Stores |
| Online Platforms |
| Other Distribution Channels |
By Geography
| India | |
| China | |
| Japan | |
| Australia | |
| South Korea | |
| South-East Asia | Singapore |
| Malaysia | |
| Thailand | |
| Indonesia | |
| Vietnam | |
| Philippines | |
| Rest of Asia-Pacific |
| By Material | Wood | |
| Metal | ||
| Plastics | ||
| Other Materials | ||
| By Product | Meeting Chairs | |
| Lounge Chairs | ||
| Swivel Chairs | ||
| Office Tables | ||
| Storage Cabinets | ||
| Desks | ||
| By Distribution Channel | Multi-branded Stores | |
| Specialty Stores | ||
| Online Platforms | ||
| Other Distribution Channels | ||
| By Geography | India | |
| China | ||
| Japan | ||
| Australia | ||
| South Korea | ||
| South-East Asia | Singapore | |
| Malaysia | ||
| Thailand | ||
| Indonesia | ||
| Vietnam | ||
| Philippines | ||
| Rest of Asia-Pacific | ||


Key Questions Answered in the Report
What is the forecast value of the Asia Pacific office furniture market in 2031?
The market is projected to reach USD 99.12 billion by 2031.
Which material segment is growing fastest in regional demand?
Plastics are expanding at a 10.05% CAGR as firms adopt lightweight, recyclable alternatives.
How will online channels influence procurement trends?
Online platforms are expected to grow at a 14.7% CAGR thanks to augmented-reality visualization and rapid quote tools.
Why are smart desks gaining traction across Asia Pacific offices?
They integrate occupancy sensors and wellness features that support hybrid work models and data-driven space planning.
What role do ESG mandates play in furniture purchasing decisions?
Corporate ESG goals are pushing buyers toward circular-economy leasing and certified low-VOC products verified by frameworks like BIFMA LEVEL.
How concentrated is competition among leading suppliers?
The top five vendors command more than one-fifth of the share, indicating a moderately fragmented market with room for specialist firms.
Page last updated on:


