
Asia-Pacific Net-Zero Energy Buildings Market Size and Share
Market Overview
| Study Period | 2020 - 2031 |
|---|---|
| Forecast Data Period | 2026 - 2031 |
| Base Year Market Size (2025) | USD 13.02 Billion |
| Market Size (2026) | USD 14.03 Billion |
| Market Size (2031) | USD 30.42 Billion |
| Growth Rate (2026 - 2031) | 16.74 % |
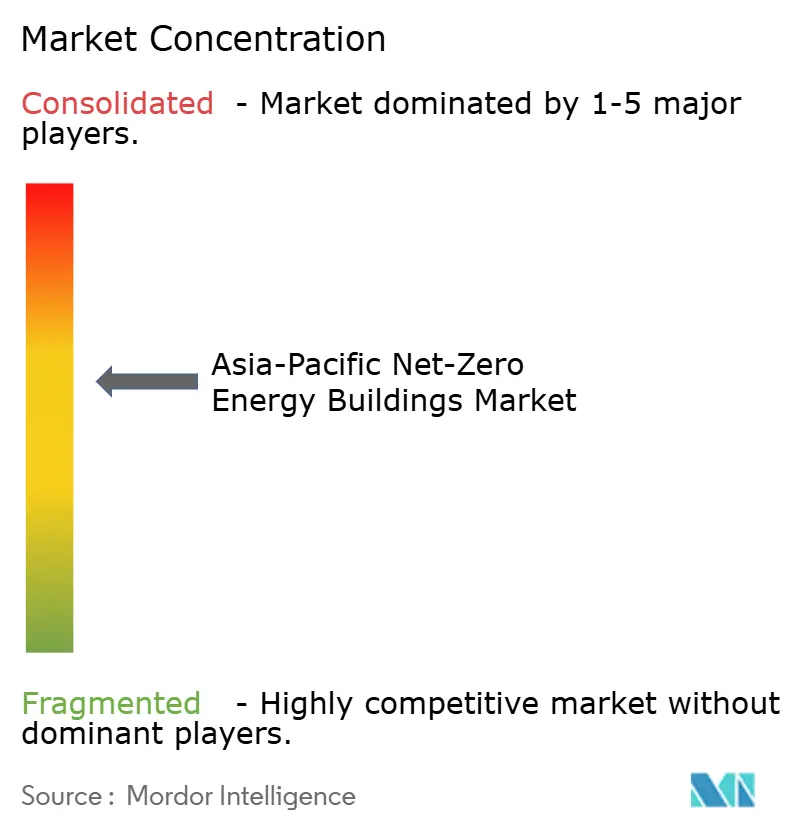
| Market Concentration | Medium |
Major Players *Disclaimer: Major Players sorted in no particular order Image © Mordor Intelligence. Reuse requires attribution under CC BY 4.0. | |
Asia-Pacific Net-Zero Energy Buildings Market Analysis by Mordor Intelligence
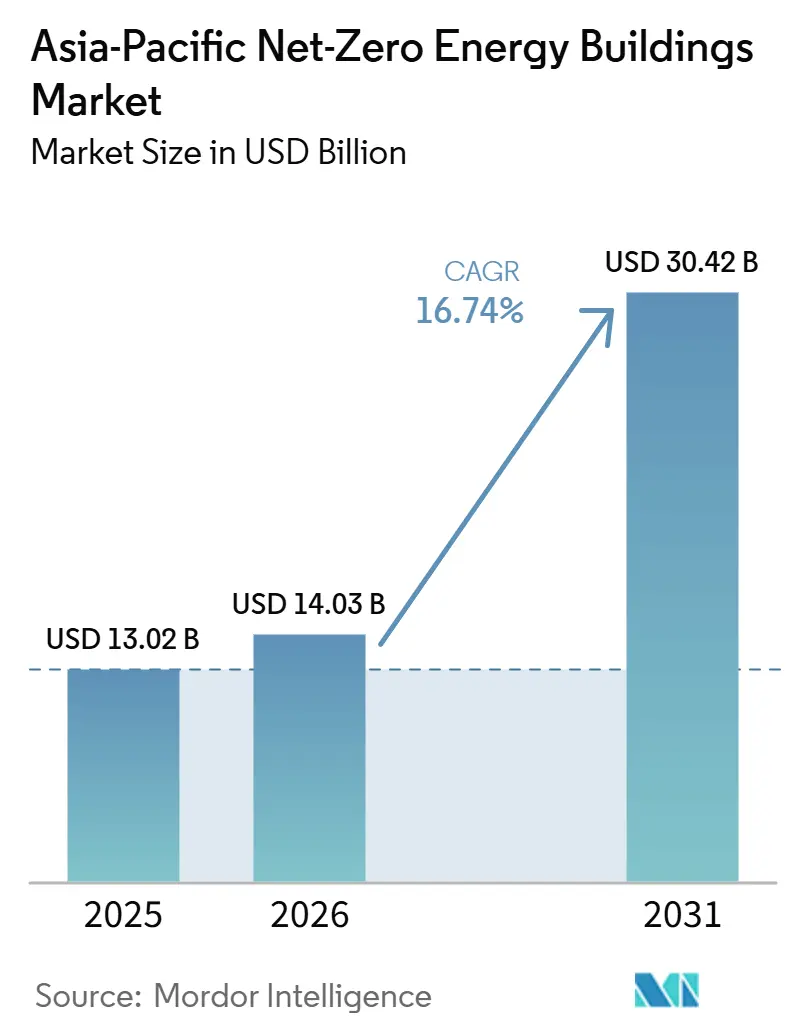
The Asia-Pacific Net-Zero Energy Buildings Market size is projected to be USD 13.02 billion in 2025, USD 14.03 billion in 2026, and reach USD 30.42 billion by 2031, growing at a CAGR of 16.74% from 2026 to 2031.
Building codes are shifting net-zero design from a voluntary objective to a project approval requirement across major regional economies. Japan is set to make energy conservation compliance mandatory for all new buildings from April 2025, with targets for new construction to achieve ZEH/ZEB-level performance by 2030 and for the entire building stock to reach that level by 2050. China plans to mandate green building standards for 100% of new urban buildings starting in 2025, supported by a 2022 national code that requires up to 75% energy savings in cold-climate zones. Its green building materials market alone is expected to reach USD 216.3 billion in 2025.
Declining costs for solar generation, storage, heat pumps, and digital controls are strengthening the economics of high-performance buildings. At the same time, tenant demand and the risk of asset devaluation are encouraging developers to invest in upgrades. These trends are creating opportunities across integrated design, equipment, commissioning, and operational services. However, the outlook depends on consistent code enforcement, access to financing, and the ability to verify building performance after occupancy.
Key Report Takeaways
- By building type, commercial buildings held 45.9% of the Asia-Pacific net-zero energy buildings market share in 2025, while institutional buildings are forecast to grow at an 18.1% CAGR through 2031.
- By offerings, solutions accounted for 70.3% of the Asia-Pacific net-zero energy buildings market size in 2025, while services are projected to expand at an 18.3% CAGR through 2031.
- By construction type, new construction accounted for 74.2% of revenue in 2025, while renovation is forecast to grow at a 17.9% CAGR through 2031.
- By geography, China held 47.6% of the Asia-Pacific net-zero energy buildings market share in 2025, while India is forecast to grow at a 19.4% CAGR through 2031.
Note: Market size and forecast figures in this report are generated using Mordor Intelligence’s proprietary estimation framework, updated with the latest available data and insights as of January 2026.
Asia-Pacific Net-Zero Energy Buildings Market Trends and Insights
Drivers Impact Analysis*
| Drivers | (~) % Impact on CAGR Forecast | Geographic Relevance | Impact Timeline |
|---|---|---|---|
| Mandatory Net-Zero and Zero-Energy Building Codes Accelerate Market Adoption | +4.0% | China, Japan, South Korea, Singapore, India, with code spillovers to ASEAN | Medium term (2-4 years) |
| Commercial Retrofit Programs Reduce Building Asset Obsolescence | +2.8% | Australia, Japan, China, Singapore | Medium term (2-4 years) |
| Declining Costs of Solar, Storage, Heat Pumps, and Smart Controls Improve Adoption | +2.7% | Global, with strongest uptake in India and Southeast Asia | Long term (≥ 4 years) |
| Corporate Demand for Verified Energy Performance Drives Net-Zero Buildings | +2.3% | China, Singapore, Australia, Hong Kong | Short term (≤ 2 years) |
| Grid-Interactive Buildings Create Demand Response Revenue Opportunities | +1.2% | Australia, Japan, South Korea, India | Medium term (2-4 years) |
| Climate-Resilient Passive Design Supports Energy-Efficient Buildings in High-Heat Regions | +0.9% | Southeast Asia, India, South China | Long term (≥ 4 years) |
| Source: Mordor Intelligence | |||
Mandatory Net-Zero and Zero-Energy Building Codes Accelerate Market Adoption
Mandatory rules are a central force in the Asia-Pacific net-zero energy buildings market because they make energy performance part of the approval process. Japan made energy-efficiency compliance mandatory for all new residential and nonresidential buildings as of April 1, 2025, under the revised Building Energy Efficiency Act. The rule established ZEB-Oriented performance as the baseline for new nonresidential construction[1]Environmental Information Center, “Complete Guide to ZEB Types 2026 Net Zero Energy Buildings,” CEEC, ceec.jp. China issued national group standards in 2025 covering ultra-low-energy housing, public-building carbon intensity, and near-zero-energy design in hot-summer and warm-winter zones. Hainan issued a near-zero-energy building technical standard in March 2026 that requires consumption levels at least 45% below national mandatory norms, and it took effect on April 1, 2026. Different provincial and national requirements can increase the engineering workload for developers operating across multiple jurisdictions, favoring providers that can manage multiple code systems.
Commercial Retrofit Programs Reduce Building Asset Obsolescence
The Asia-Pacific net-zero energy buildings market is also supported by retrofit programs that address the risk of older commercial assets falling behind new performance expectations. Certified green buildings in Asia-Pacific reported energy savings of 20% to 60% and rental premiums of up to 11%, which strengthens the case for owners to invest in upgrades. Japan allocated JPY 14.4 billion (USD 96 million) to its FY2025 Decarbonization Building Renovation Acceleration program for commercial properties. The program targets a 30% to 40% reduction in primary energy use at facilities such as hotels, hospitals, and offices. At Hong Kong University of Science and Technology, Schneider Electric and Veolia financed the upfront retrofit costs for the Lee Shau Kee Business Building and planned to recover over 15 years from verified savings. This approach can make high-performance renovation more accessible to owners who cannot fund the initial upgrade cost directly.
Declining Costs of Solar, Storage, Heat Pumps, and Smart Controls Improve Adoption
Falling technology costs support the Asia-Pacific net-zero energy buildings market by improving project payback and broadening the range of viable building types. Japan had 4,711 ZEB-certified buildings covering 61.7 million sq m by June 2026, showing that the approach has moved beyond a small number of flagship projects. Taiwan requires solar photovoltaic installation on new or substantially expanded buildings above 1,000 sq m from August 1, 2026. The requirement is expected to add 660,000 kW of annual capacity, enough to supply 200,000 households. Trane Technologies launched its HSAG air-cooled magnetic-bearing chiller in Asia-Pacific in February 2026 with a coefficient of performance above 5.0 and a global warming potential below 1. Equipment that addresses energy use and refrigerant compliance in one purchase can simplify investment decisions for developers.
Corporate Demand for Verified Energy Performance Drives Net-Zero Buildings
Corporate occupiers are placing greater value on buildings that can demonstrate energy performance after occupation, not only at the design stage. This preference supports demand for metering, building-management systems, commissioning, and ongoing performance reporting. Certified green buildings in Asia-Pacific reported energy savings of 20% to 60% and rental premiums of up to 11%, giving owners a measurable basis to invest in verified performance. The Asia-Pacific net-zero energy buildings market benefits when landlords use performance results to retain tenants and protect asset value. Verified operational data also helps occupiers assess whether a property supports their energy and emissions commitments. Providers that combine design support with monitoring and performance verification can respond to this requirement more effectively.
Restraints Impact Analysis*
| Restraints | (~) % Impact on CAGR Forecast | Geographic Relevance | Impact Timeline |
|---|---|---|---|
| High Upfront Costs and Uncertain Payback Limit Adoption in Secondary Markets | -2.3% | India Tier 2 and Tier 3 cities, Southeast Asia, Pacific Island markets | Medium term (2-4 years) |
| Fragmented Building Codes and Renewable Energy Accounting Increase Compliance Complexity | -1.5% | ASEAN, India, Rest of Asia-Pacific | Short term (≤ 2 years) |
| Shortage of Skilled Designers, Commissioning Professionals, and Operators Delays Projects | -1.1% | India, Vietnam, Indonesia, Malaysia | Medium term (2-4 years) |
| Occupant Behavior and Incomplete Measurement Create Building Performance Gaps | -0.7% | Global, concentrated in markets with early-stage operational monitoring | Long term (≥ 4 years) |
| Source: Mordor Intelligence | |||
High Upfront Costs and Uncertain Payback Limit Adoption in Secondary Markets
High initial costs remain a material limit on the Asia-Pacific net-zero energy buildings market, especially where construction finance is already constrained. The cost issue is most acute in secondary cities, where developers must weigh long-term energy savings against immediate capital requirements. Research by the World Green Building Council found that green-certified buildings can save 20% to 60% on energy and earn rental premiums of up to 11%. These benefits do not remove the need for financing tools that can convert future savings into capital available at the start of a project. A lack of local green-finance products can slow adoption in markets such as Vietnam and Indonesia. Performance contracts, guarantees, and targeted public support are therefore important for widening access beyond large asset owners.
Fragmented Building Codes and Renewable Energy Accounting Increase Compliance Complexity
Different building codes add cost and uncertainty for companies that develop portfolios across several Asia-Pacific markets. Provincial near-zero-energy rules in China can use energy-intensity baselines and carbon-accounting methods that differ from national requirements. Renewable electricity accounting also varies when a building uses off-site power purchase agreements or renewable energy certificates. A strategy accepted in one jurisdiction may not receive equivalent treatment in another. This requires developers to maintain separate compliance approaches even when projects use similar technical designs. The Asia-Pacific net-zero energy buildings market therefore rewards service providers with experience in certification, accounting, and documentation across multiple national frameworks.
*Our forecasts treat driver/restraint impacts as directional, not additive. The impact forecasts reflect baseline growth, mix effects, and variable interactions.
Segment Analysis
By Building Type: Institutional Buildings Lead the Growth Outlook
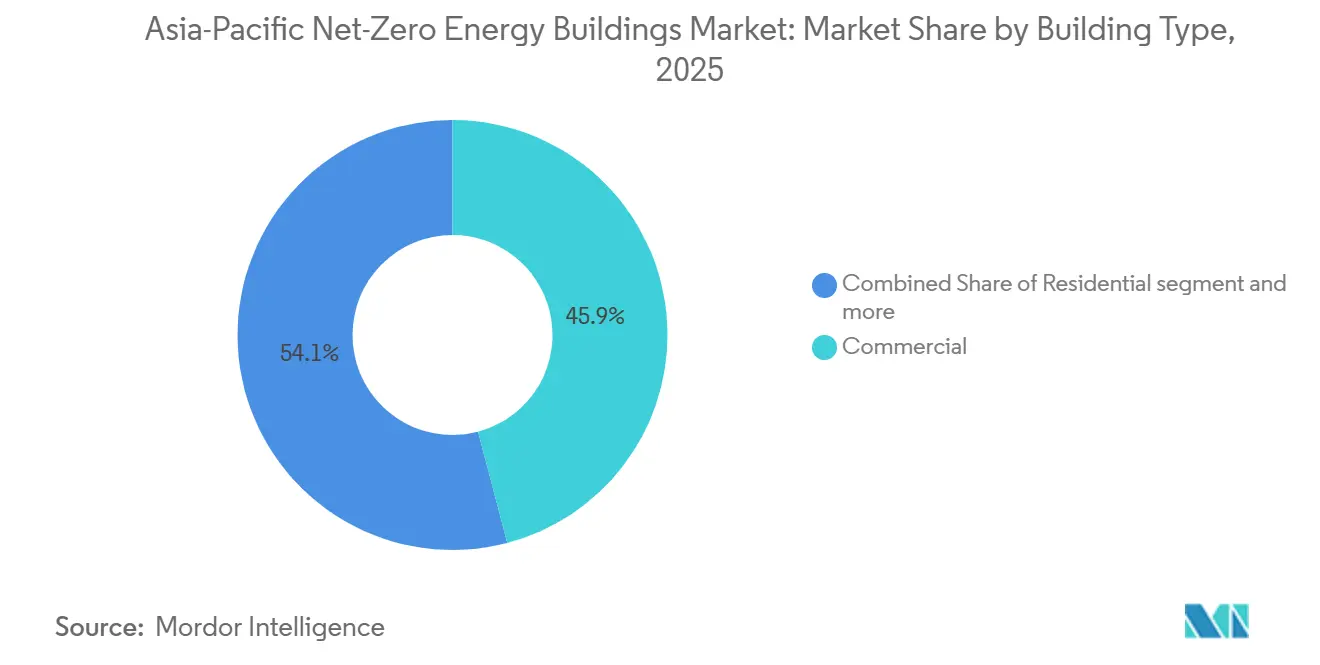
Commercial buildings accounted for 45.9% of the Asia-Pacific net-zero energy buildings market share in 2025, driven by corporate sustainability commitments and demand for higher-quality office space. The segment benefits when tenants consider energy performance in leasing and asset selection. Research by the World Green Building Council reported energy savings of 20% to 60% in certified green buildings and rental premiums of up to 11%[2]World Green Building Council, “A Changing Business Case Sustainable Buildings Outperforming Conventional Assets Across Asia Pacific,” World Green Building Council, worldgbc.org. These operating and rental outcomes provide developers with a basis for including net-zero specifications at the design stage. Residential buildings remain a major part of the regional opportunity because Japan and South Korea are advancing zero-energy requirements for new homes. Industrial facilities are also relevant as occupiers align building performance with wider Scope 1 and Scope 2 emissions programs.
Institutional buildings are forecast to grow at an 18.1% CAGR through 2031, the fastest rate among building types. Government facilities, universities, and hospitals are often subject to earlier public-sector requirements than private facilities. Taizhou began construction in 2025 of a fever clinic building at the Sixth People’s Hospital, described as the city’s first near-zero-energy public facility. The project is expected to reduce annual carbon emissions by 3,870 metric tons. The National University of Singapore began work in May 2026 on ArCLab, a historic-building retrofit seeking BCA Green Mark Platinum Zero Energy certification. Public procurement cycles can favor contractors and technology providers that have documented performance in regulated institutional projects.


By Offerings: Services Expand as Operational Requirements Increase
Solutions accounted for 70.3% of the Asia-Pacific net-zero energy buildings market size in 2025 because new development, major retrofits, design, delivery, and smart systems require significant capital investment. The category includes prefabricated construction, renewable-energy systems, building envelopes, HVAC equipment, and digital building-management platforms. China State Construction Engineering delivered a 470,000 sq m, 2,000-bed modular hospital in Shenzhen in January 2026 with 95% prefabrication. High-performance operating facilities show how solutions combine renewable generation, energy-efficient equipment, and digital controls. These examples show that solutions cover both large, new projects and operating facilities with demanding energy targets. Integrated offerings can reduce coordination needs between design, equipment, construction, and controls providers.
Services are forecast to grow at an 18.3% CAGR through 2031, faster than solutions, as owners need external support for commissioning, certification, and operational performance. Certification frameworks in Singapore and Japan require third-party verification and performance information after occupation. This creates repeat demand for design, commissioning, consulting, and compliance work. The Asia-Pacific net-zero energy buildings industry needs qualified professionals who can work across energy models, building systems, and national requirements. Short supply of commissioning specialists can provide pricing power to firms with verified project records. Services also help close the gap between design-stage certification and actual energy performance after a building enters use.
By Construction Type: Renovation Gains Importance Alongside New Construction
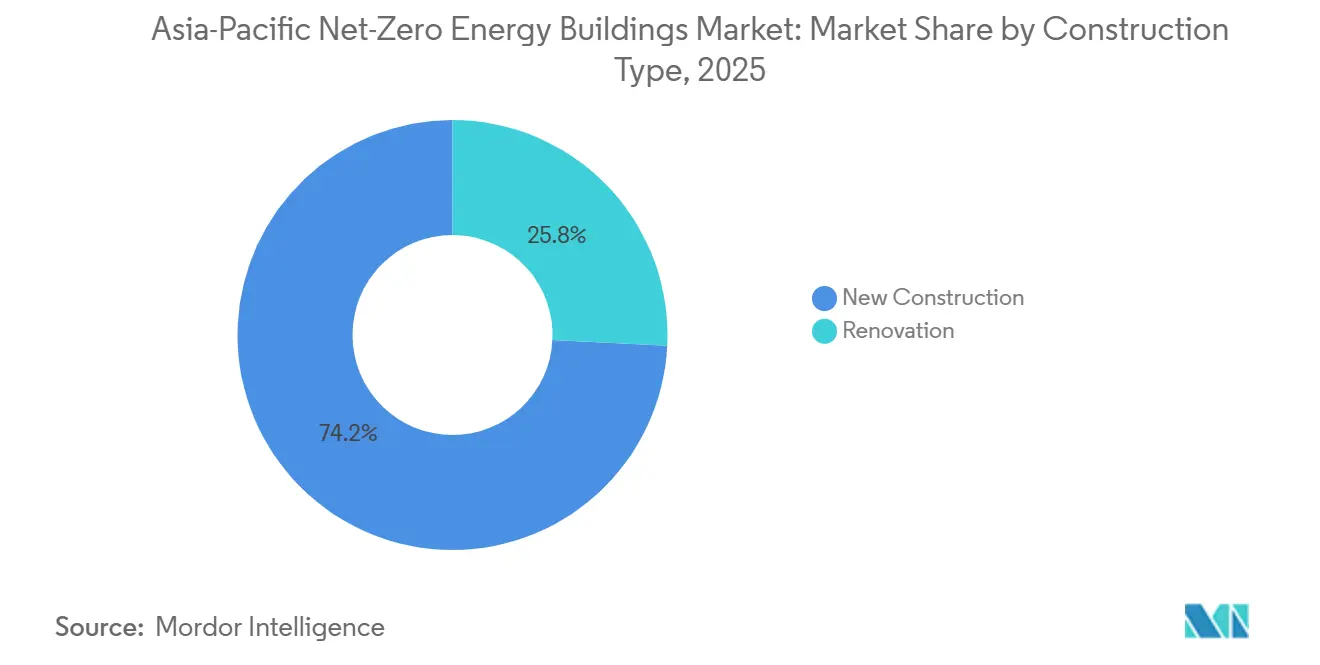
New construction held 74.2% of revenue in 2025, reflecting the ability to include net-zero measures before building systems are installed. The Asia-Pacific net-zero energy buildings market benefits from the large volume of urban development in China and India. New projects can integrate insulation, efficient HVAC, solar, storage, and controls without modifying occupied space. Prefabrication and modular construction can also support faster delivery and more consistent specifications. China State Construction Engineering’s Shenzhen hospital project used 95% prefabrication, illustrating how industrialized methods can support major institutional delivery. Existing building exemptions under some codes have also concentrated stricter requirements on new permitting.
Renovation is projected to grow at a 17.9% CAGR through 2031 as asset owners address retrofit obligations, corporate targets, and stranded-asset risk. Japan’s FY2025 renovation program provides JPY 14.4 billion (USD 96 million) for upgrades designed to reduce primary energy use by 30% to 40%. Malaysia’s nearly ZEB retrofit demonstration at SEDA Malaysia’s headquarters in Cyberjaya combines energy-efficiency measures with renewable-energy technologies. AGC supplies low-emissivity glass and building-integrated photovoltaic products for the initiative. Renovation can expand the addressable base because most future building stock already exists. Wider financing and more standardized retrofit packages would help translate this potential into project volume.
Geography Analysis
China held 47.6% of the Asia-Pacific net-zero energy buildings market share in 2025, supported by construction volume, policy depth, and local manufacturing capacity. National group standards issued in 2025 cover ultra-low-energy residential buildings, public-building carbon intensity, and near-zero-energy design. Hainan’s near-zero-energy standard became effective in April 2026 and requires consumption levels at least 45% below national mandatory norms. Provincial rules increase demand for design, equipment, and verification services. China State Construction Engineering’s January 2026 delivery of a 95%-prefabricated, 2,000-bed Shenzhen hospital shows how industrialized construction can shorten project delivery. Financing pressure in weaker secondary real estate markets could still limit the ability to absorb higher upfront costs.
India is forecast to grow at a 19.4% CAGR through 2031, making it the fastest-growing country in the regional outlook. The country’s expansion is linked to the scale of new construction, rising cooling demand, and the potential for on-site renewable generation. The International Energy Agency expects India to add 130 million to 150 million air-conditioning units from 2025 to 2030. Japan has the region’s most mature ZEB ecosystem, with 4,711 certified units covering 61.7 million sq m as of June 2026. Australia faces differing adoption schedules for the NCC 2025, which can create uneven near-term planning conditions between states.
The Rest of Asia-Pacific grouping includes Singapore, South Korea, Taiwan, Malaysia, Indonesia, and other ASEAN markets, where regulatory progress is advancing at different speeds. Taiwan’s solar photovoltaic requirement for qualifying new or expanded buildings takes effect in August 2026 and supports closer integration of building design with distributed energy generation. Malaysia’s first Nearly ZEB retrofit demonstration at SEDA Malaysia’s headquarters in Cyberjaya includes AGC low-emissivity glass and building-integrated photovoltaic products. The project targets a primary-energy reduction of 75% or more. Singapore provides a concentrated case for historic-building renovation through the ArCLab project, which started work in May 2026. Regional markets with clear rules and reliable financing are likely to convert policy objectives into activity more quickly than markets with fragmented standards.
Competitive Landscape
The Asia-Pacific net-zero energy buildings market has moderate consolidation among systems integrators and greater fragmentation among specialist material and service providers. Johnson Controls, Schneider Electric, Siemens, and Honeywell compete through platforms that combine HVAC control, energy management, and carbon information. In January 2026, Johnson Controls committed up to USD 60 million over 5 years to expand its Singapore Innovation Centre for data-center cooling and smart-building integration. The company also completed the Thamrin Nine project in Jakarta in November 2025, achieving BCA Green Mark Platinum certification and delivering up to 30% energy savings[3] Johnson Controls International, “Johnson Controls’ 2026 Sustainability Report Highlights Energy Efficiency Returns in Mission-Critical Industries,” Johnson Controls, johnsoncontrols.com. Providers that can guarantee in-use outcomes, rather than only design compliance, can strengthen their contract position.
Material suppliers are developing products that help buildings meet energy and carbon targets within limited construction timelines. AGC participates in the Malaysia Nearly ZEB retrofit demonstration by supplying low-emissivity glass and building-integrated photovoltaic products. Trane Technologies introduced an air-cooled magnetic-bearing chiller for Asia-Pacific in February 2026, designed for data-center and commercial-cooling use. The equipment has a coefficient of performance above 5.0 and a global warming potential below 1. Regional construction companies can internalize green design and prefabrication capability, reducing reliance on separate providers. Smaller commissioning consultancies and energy-service companies continue to occupy local niches that larger platforms have not standardized.
Competition also depends on access to documented project results, certification expertise, and long-term operational data. Japan’s SUSTIE test facility received recognition as an ASHRAE Technology Awards Asia Regional Winner in the 2025-2026 cycle. Panasonic is developing AI-enabled smart infrastructure and facility-management solutions with JTC Corporation at Singapore’s Punggol Digital District. The arrangement provides a live environment for testing building operations that could be applied elsewhere in Asia. ISO 50001 documentation is becoming an important qualification for institutional and public procurement in several countries. No combined market-share figure for leading companies was provided, so the source material does not support a numerical assessment of concentration.
Asia-Pacific Net-Zero Energy Buildings Industry Leaders
Johnson Controls International plc
Schneider Electric SE
Siemens Aktiengesellschaft
Daikin Industries, Ltd.
Honeywell International Inc.
- *Disclaimer: Major Players sorted in no particular order

Recent Industry Developments
- July 2026: Panasonic signed a Memorandum of Understanding with JTC Corporation to jointly develop and deploy AI-enabled smart infrastructure and facility management solutions at Singapore’s Punggol Digital District, creating a live demonstration environment for next-generation building operations scalable across Asia.
- June 2026: AGC Inc. confirmed participation in Malaysia’s first-ever Nearly ZEB retrofit demonstration project at SEDA Malaysia’s headquarters in Cyberjaya, supplying high-performance low-emissivity glass and building-integrated photovoltaic products. The NEDO-SEDA initiative targets a 75% or greater reduction in primary energy consumption.
- May 2026: NUS Architectural Conservation Laboratory commenced restoration works with a target of achieving BCA Green Mark Platinum Zero Energy certification, making it Singapore’s first historic building to be retrofitted to a net-zero operational energy standard.


Asia-Pacific Net-Zero Energy Buildings Market Report Scope
| Residential |
| Commercial |
| Institutional |
| Industrial |
| Solutions (New Net-Zero Energy Building Development, Net-Zero Building Retrofit, Integrated Design & Delivery and Smart Net-Zero Building Solutions) |
| Services (Architectural & Engineering Design, Construction Services, Commissioning & Certification Services and Consulting Services) |
| New Construction |
| Renovation |
| China |
| Japan |
| India |
| Australia |
| Rest of Asia-Pacific |
| By Building Type | Residential |
| Commercial | |
| Institutional | |
| Industrial | |
| By Offerings | Solutions (New Net-Zero Energy Building Development, Net-Zero Building Retrofit, Integrated Design & Delivery and Smart Net-Zero Building Solutions) |
| Services (Architectural & Engineering Design, Construction Services, Commissioning & Certification Services and Consulting Services) | |
| By Construction Type | New Construction |
| Renovation | |
| By Country | China |
| Japan | |
| India | |
| Australia | |
| Rest of Asia-Pacific |


Key Questions Answered in the Report
What is the projected value of Asia-Pacific net-zero energy buildings by 2031?
The sector is projected to reach USD 30.42 billion by 2031, from USD 14.03 billion in 2026, at a 16.74% CAGR.
Which building type is growing fastest in Asia-Pacific net-zero energy buildings?
Institutional buildings are projected to grow at an 18.1% CAGR through 2031, faster than other building types.
Why are commercial building owners investing in net-zero upgrades?
Certified green buildings reported energy savings of 20% to 60% and rental premiums of up to 11%, while retrofit programs can reduce asset-obsolescence risk
What role do services play in net-zero building projects?
Services are forecast to grow at an 18.3% CAGR through 2031 because owners need commissioning, certification, design, and operational-performance support.
Page last updated on:





