Market Overview
| Study Period | 2021 - 2031 |
|---|---|
| Forecast Data Period | 2026 - 2031 |
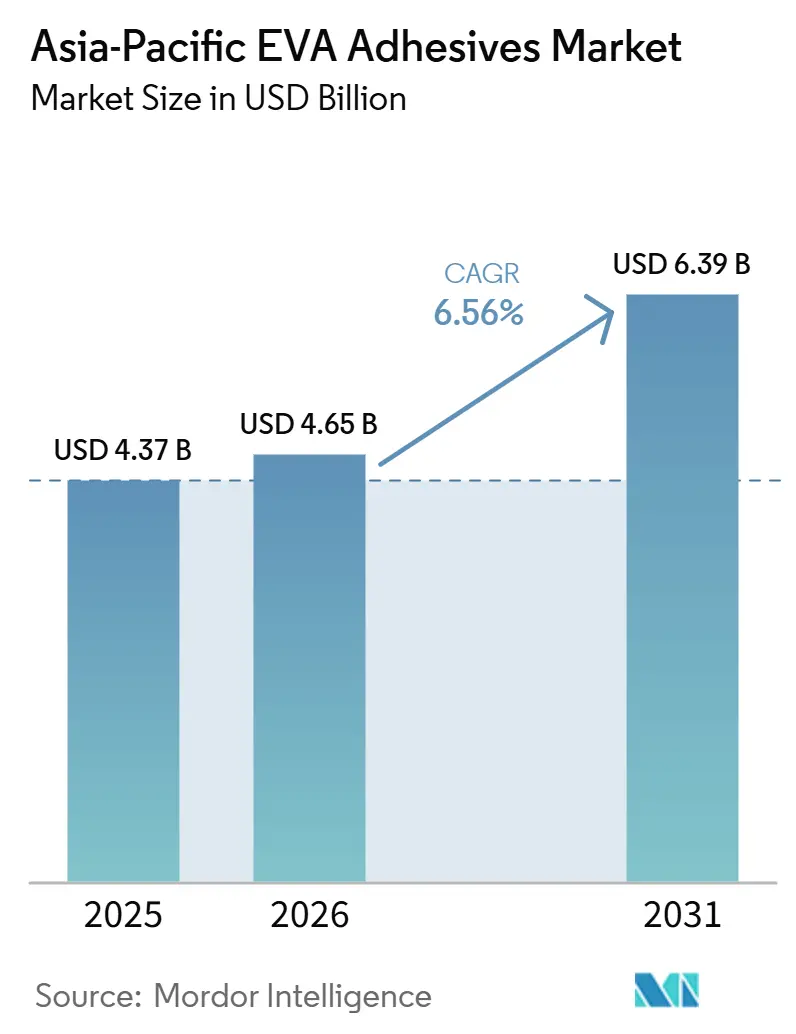
| Base Year Market Size (2025) | USD 4.37 Billion |
| Market Size (2025) | USD 4.65 Billion |
| Market Size (2031) | USD 6.39 Billion |
| Growth Rate (2026 - 2031) | 6.56% CAGR |
| Market Concentration | Medium |
Major Players *Disclaimer: Major Players sorted in no particular order Image © Mordor Intelligence. Reuse requires attribution under CC BY 4.0. | |
Asia-Pacific EVA Adhesives Market Analysis by Mordor Intelligence
The Asia-Pacific EVA-based adhesives market, valued at USD 4.37 billion in 2025, is projected to grow to USD 4.65 billion in 2026 and reach USD 6.39 billion by 2031, marking a CAGR of 6.56% from 2026 to 2031. Demand is shifting from traditional footwear and packaging, driven by the substitution of solvent-borne lines, the expansion of solar photovoltaic encapsulation capacity, and swift adoption in healthcare. Regulations like Beijing’s DB11/1983-2022 VOC cap and India’s 2026 low-VOC rule are steering preferences towards water-borne platforms. However, the dominance of hot-melts is bolstered by the e-commerce logistics sector. While feedstock volatility remains a concern, with Japanese Vinyl Acetate Monomer (VAM) prices fluctuating by 16% in 2025, China's domestic oversupply of EVA resin has provided a temporary buffer for converters against rising raw material costs. To safeguard margins, multinational formulators are consolidating their portfolios, while regional players are expanding new plants, driven by tariff-induced localization. These dynamics intensify competitive pressures, with new entrants exploring niches like bio-based and ultra-low-temperature grades.
Key Report Takeaways
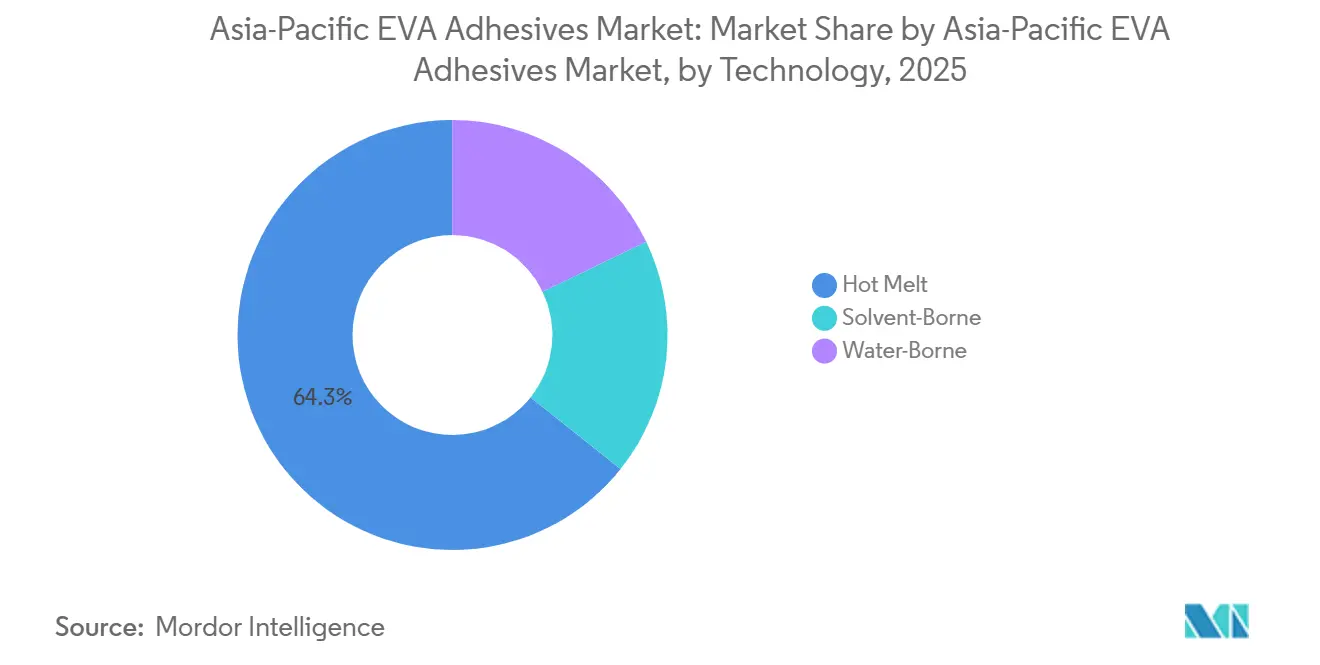
- By technology, hot-melt held 64.28% of the Asia-Pacific EVA-based adhesives market share in 2025, while water-borne formulations are advancing at a 7.56% CAGR between 2026 and 2031.
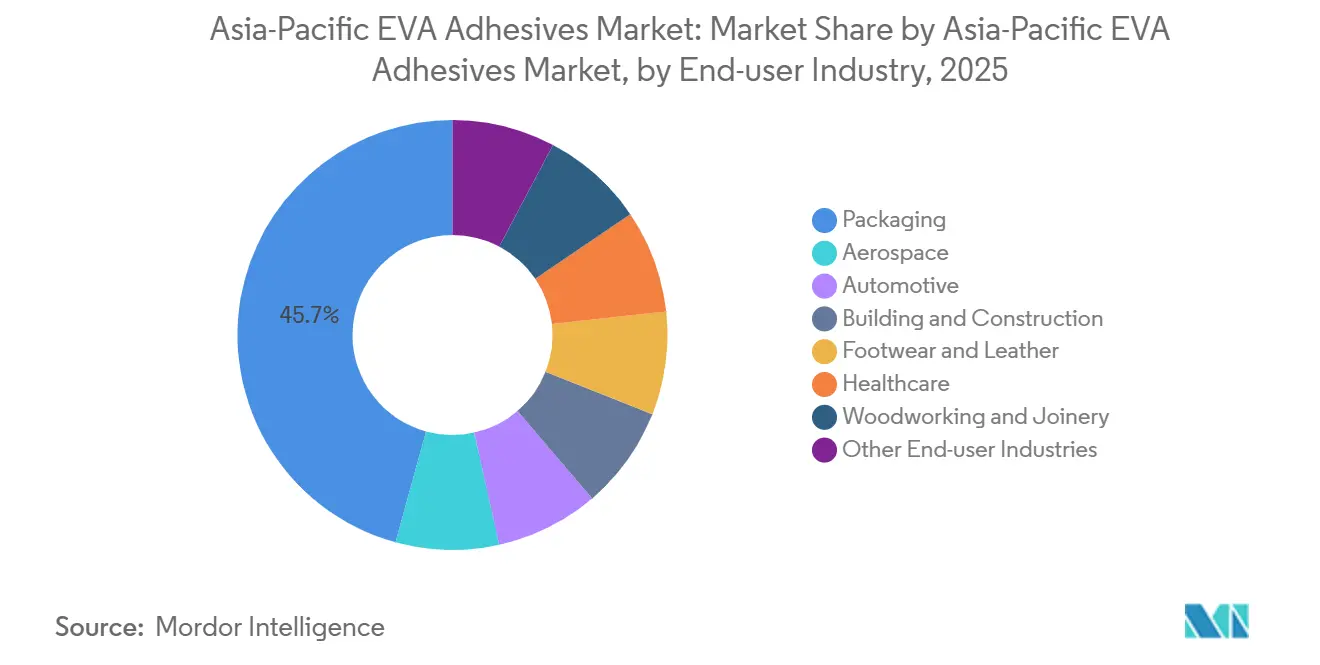
- By end-user, packaging led with 45.73% revenue share in 2025; healthcare is forecast to expand at a 7.71% CAGR between 2026 and 2031.
- By country, China commanded 54.18% of the Asia-Pacific EVA-based adhesives market size in 2025, whereas India records the highest projected CAGR at 7.76% between 2026 and 2031.
Note: Market size and forecast figures in this report are generated using Mordor Intelligence’s proprietary estimation framework, updated with the latest available data and insights as of January 2026.
Asia-Pacific EVA Adhesives Market Trends and Insights
Drivers Impact Analysis*
| Driver | (≈) % Impact on CAGR Forecast | Geographic Relevance | Impact Timeline |
|---|---|---|---|
| E-commerce boom driving hot-melt packaging demand | +1.2% | China, India, Southeast Asia | Medium term (2-4 years) |
| Footwear automation spurring low-temperature EVA uptake | +0.8% | China, Vietnam, Indonesia | Short term (≤ 2 years) |
| Shift to medical-grade EVA films in APAC healthcare | +1.5% | China, India, Japan, South Korea | Long term (≥ 4 years) |
| Solar PV encapsulation capacity additions | +1.9% | China, India | Medium term (2-4 years) |
| Bio-based EVA scale-up in Southeast Asia | +0.6% | Thailand, Malaysia, Indonesia | Long term (≥ 4 years) |
| Source: Mordor Intelligence | |||
E-Commerce Boom Driving Hot-Melt Packaging Demand
Cross-border fulfillment centers are increasingly adopting EVA hot-melt systems. These systems eliminate drying steps and reduce line downtime by 30-40%. This trend bolsters the EVA-based adhesives market in the Asia-Pacific region. In China, food-contact migration limits, as per GB 9685-2016, and Japan's Food Sanitation Law, are driving up demand for low-odor grades. Henkel inaugurated its EUR 60 million Shanghai Inspiration Center in 2025[1]Henkel, “Shanghai Inspiration Center Opens,” henkel.com. The center can prototype custom hot-melts in just 48 hours, enabling brand owners to expedite their qualification cycles. With rising minimum wages, automation has led to a reduction of two to three operators per packaging line. While these advancements are notable, they come against the backdrop of slowing consumption in China.
Footwear Automation Spurring Low-Temperature EVA Uptake
In 2024, Aica Kogyo, after collaborating with OEMs to develop 15-20 second open-time formulations, achieved hot-melt sales of JPY 74.74 billion in the Asia-Pacific region[2]Aica Kogyo, “FY 2024 Financial Results,” aica.co.jp. Automated shoe plants in Guangdong and Dong Nai, utilizing EVA grades with activation points between 90-110 °C, have successfully minimized heat damage while maintaining a throughput of 1,200 pairs per hour. Additionally, EVA provides a buffer against price fluctuations in natural rubber, thanks to quarterly VAM contracts. While this advantage is primarily seen in Vietnam and Indonesia, it stands to diminish if global footwear sourcing undergoes tariff-induced shifts.
Shift to Medical-Grade EVA Films in APAC Healthcare
Transdermal patches and wound dressings are shifting from acrylics to medical-grade EVA, ensuring adhesion at body temperature without causing skin irritation. In 2024, Celanese obtained ISO 10993 certification for its films, paving the way for supply agreements with contract manufacturers in India and China. While an aging population, projected to reach 630 million individuals aged 65 and older by 2030, bolsters demand, reimbursement gaps hinder widespread adoption.
Solar PV Encapsulation Capacity Additions in China and India
In 2025, China alone accounted for 250 GW of solar installations, meeting 54% of the global demand for EVA encapsulant films. Responding to domestic antidumping duties, Sinopec and Wanhua ramped up their resin output by 940,000 tons, providing local converters with a significant feedstock edge. While India’s duties on Chinese films have led to the establishment of new production lines compliant with IEC 61215 standards, the emergence of polyolefin elastomers (POE) encapsulants poses a challenge to EVA's dominance in next-generation modules.
Restraints Impact Analysis*
| Restraint | (≈) % Impact on CAGR Forecast | Geographic Relevance | Impact Timeline |
|---|---|---|---|
| Volatile VAM feedstock prices | –1.1% | Japan, South Korea, China, India | Short term (≤ 2 years) |
| Tight VOC limits on solvent-borne lines | –0.7% | China, Japan, South Korea | Medium term (2-4 years) |
| Competition from polyolefin pressure-sensitives | –0.5% | China, India | Medium term (2-4 years) |
| Source: Mordor Intelligence | |||
Volatile VAM Feedstock Prices
In Japan, the spot price of Vinyl Acetate Monomer (VAM) jumped from USD 816/ton in Q1 2025 to USD 943/ton by Q4. This price surge has squeezed converters’ EBITDA by as much as 5%. Smaller players, unable to hedge, face 30-60 day pricing lags, jeopardizing their relationships. Meanwhile, H.B. Fuller’s "Project Quantum Leap" aims to centralize VAM procurement, allowing the company to secure fixed-price collars and target annual savings of USD 150 million. As a result, the divide between integrated multinationals and merchant buyers is widening, pushing the industry towards faster consolidation.
Tight VOC Limits on Solvent-Borne Lines
Beijing's DB11/1983-2022 cap of 10 g/kg VOC and Japan Adhesive Industry Association's (JAIA) 4VOC rule (less than 0.05 wt % toluene) act as restraints, forcing legacy lines to either invest USD 2-5 million in oxidizers or shut down. India's 2026 regulation, which exempts hot-melt and water-borne platforms, is steering investments towards cleaner systems.
*Our forecasts treat driver/restraint impacts as directional, not additive. The impact forecasts reflect baseline growth, mix effects, and variable interactions.
Segment Analysis
By Technology: Regulation Pushes Water-Borne Growth
In 2025, hot-melt adhesives held a dominant 64.28% share of the Asia-Pacific EVA-based adhesives market. However, water-borne grades are on the rise, boasting a robust CAGR of 7.56%. As converters adapt to meet VOC caps, the Asia-Pacific EVA-based adhesives market is set for growth. While water-borne systems offer benefits like reduced insurance premiums and easier operator training, challenges such as freeze-thaw issues hinder their adoption in cold chains. Highlighting a strategic shift, Henkel’s Singapore Electronic Adhesives Technical Centre is moving away from solvent-borne R&D.
Water-borne systems' growth is closely tied to labor and compliance trends. By opting for water-borne systems, facilities sidestep the need for explosion-proof wiring, resulting in significant capital savings. NANPAO has demonstrated the potential for margin enhancement, with over 60% of its revenue mix now water-based, despite the longer drying cycles. Nevertheless, the ultra-fast e-commerce sector continues to lean towards hot-melt adhesives, suggesting a gradual shift in capital investment.


By End-User Industry: Healthcare Accelerates
In 2025, packaging commanded a 45.73% share of the Asia-Pacific EVA-based adhesives market, but its growth has slowed due to weaker retail sales in China. The healthcare sector, growing at a 7.71% CAGR, is reaping the benefits of ISO 10993-approved EVA films, an aging demographic, and the harmonization of medical devices.
EVA is the material of choice for automotive wiring, construction membranes, and electronics due to its low-temperature flexibility. While footwear and woodworking continue to be significant volume contributors, they are experiencing price pressures from competing polyolefins. Niche markets, like wound-care dressings, can command price premiums of 20-30%, whereas the more commoditized carton sealing market is highly sensitive to price fluctuations, even down to cents per kilogram.
Geography Analysis
In 2025, China dominated the Asia-Pacific EVA-based adhesives market, capturing a 54.18% share, thanks to its robust domestic resin capacity of 2.38 million tons and concentrated downstream clusters in Jiangsu, Zhejiang, and Guangdong. While demand dipped by 6.79% in 2024 due to a slowdown in footwear exports and rebate cuts for solar modules, ongoing policy support for water-borne migration has kept local investments buoyant.
India, buoyed by Pidilite’s new plant in Punjab and localization mandates in the solar and automotive sectors, boasts the region's fastest growth at a 7.76% CAGR. The country's allure is further heightened by lower labor costs and tariff incentives, attracting multinational formulators keen on bolstering their supply-chain resilience.
Thailand's Selic bolsters its position with the acquisition of 3M’s assets, while Malaysia's bio-based initiatives and Vietnam's thriving footwear exports anchor the region's capacity. Japan and South Korea, as specialty hubs, capitalize on stringent VOC regulations, marketing ultra-low-emission grades at a premium. Meanwhile, Australia and other parts of the Asia-Pacific, though contributing smaller volumes, reap rewards from stringent building codes that favor high-performance adhesives.
Competitive Landscape
In the Asia-Pacific EVA-based adhesives market, the landscape is moderately fragmented. In a strategic move, Henkel acquired Stahl for EUR 2.1 billion in 2026, broadening its reach into leather and textile systems and enhancing its scale and specialty margins. Meanwhile, Arkema's USD 150 million acquisition of Dow's laminating adhesives in 2024 propelled Bostik to the position of the region's second-largest player in flexible packaging.
Regional contenders are fortifying their positions through greenfield developments. Pidilite's new USD 36 million plant in Punjab, set to commence operations in 2027, is poised to cater to the construction and woodworking sectors. Concurrently, Tex Year is expanding its capacity in India, targeting the optoelectronics market. In a notable shift, NANPAO's pivot towards bio-content not only underscores its commitment to sustainability but also attracts brand-owner contracts, with many willing to pay a premium of 15-25%.
Technology and regulatory compliance are becoming significant competitive advantages. Celanese's ISO 10993 certified EVA films are securing multi-year contracts with medical buyers. H.B. Fuller is utilizing digitized procurement strategies to mitigate VAM costs. In contrast, smaller converters are finding it challenging to secure capital for VOC abatement, positioning them as potential M&A targets or prompting relocations.
Asia-Pacific EVA Adhesives Industry Leaders
Henkel AG & Co. KGaA
Dow
Arkema
H.B. Fuller Company
3M
- *Disclaimer: Major Players sorted in no particular order

Recent Industry Developments
- February 2026: Henkel closed the EUR 2.1 billion Stahl acquisition, adding specialty textile and leather adhesives and bolstering automotive interior trim capabilities.
- January 2026: Henkel moved its Singapore Science Park site, establishing the region’s largest electronic-adhesives center focused on water-borne and hot-melt EVA platforms.


Asia-Pacific EVA Adhesives Market Report Scope
EVA (Ethylene Vinyl Acetate) adhesives are a versatile, fast-setting thermoplastic adhesive, commonly used as hot melt sticks or pellets for bonding porous and non-porous materials like wood, plastics, foam, fabric, and packaging. It provides strong, flexible bonds that are water-resistant and solidify rapidly upon cooling.
The Asia-Pacific EVA Adhesives market report is segmented by technology, end-user industry, and geography. By technology, the market is segmented into hot melt, solvent-borne, and water-borne. By end-user industry, the market is segmented into aerospace, automotive, building and construction, footwear and leather, healthcare, packaging, woodworking, and joinery. The report also covers the market size and forecasts for Asia-Pacific EVA Adhesives Market in 9 countries across the Asia-Pacific region. For each segemnt market sizing and forecasts are provided in terms of value (USD).
By Technology
| Hot-Melt |
| Solvent-Borne |
| Water-Borne |
By End-user Industry
| Aerospace |
| Automotive |
| Building and Construction |
| Footwear and Leather |
| Healthcare |
| Packaging |
| Woodworking and Joinery |
| Other End-user Industries |
By Country
| Australia |
| China |
| India |
| Indonesia |
| Japan |
| Malaysia |
| Singapore |
| South Korea |
| Thailand |
| Rest of Asia-Pacific |
| By Technology | Hot-Melt |
| Solvent-Borne | |
| Water-Borne | |
| By End-user Industry | Aerospace |
| Automotive | |
| Building and Construction | |
| Footwear and Leather | |
| Healthcare | |
| Packaging | |
| Woodworking and Joinery | |
| Other End-user Industries | |
| By Country | Australia |
| China | |
| India | |
| Indonesia | |
| Japan | |
| Malaysia | |
| Singapore | |
| South Korea | |
| Thailand | |
| Rest of Asia-Pacific |


Market Definition
- End-user Industry - Building & Construction, Packaging, Automotive, Aerospace, Woodworking & Joinery, Footwear & Leather, Healthcare, and Others are the end-user industries considered under the EVA adhesives market.
- Product - All EVA adhesive products are considered in the market studied
- Resin - Under the scope of the study, flexible Ethylene Vinyl Acetate Copolymer resin is considered
- Technology - For the purpose of this study, Water-borne, Solvent-borne, and Hot Melt adhesive technologies are taken into consideration.
| Keyword | Definition |
|---|---|
| Hot-melt Adhesive | Hot melt adhesives are generally 100% solid formulations, based on thermoplastic polymers. They are solid at room temperature and are activated upon heating above their softening point, at which stage they are liquid, and hence, can be processed. |
| Reactive Adhesive | A reactive adhesive is made up of monomers that react in the adhesive curing process and do not evaporate from the film during use. Instead, these volatile components become chemically incorporated into the adhesive. |
| Solvent-borne Adhesive | Solvent-borne adhesives are mixtures of solvents and thermoplastic, or slightly cross-linked polymers, such as polychloroprene, polyurethane, acrylic, silicone, and natural and synthetic rubbers (elastomers). |
| Water-borne Adhesive | Water-borne adhesives use water as a carrier or diluting medium to disperse a resin. They are set by allowing the water to evaporate or be absorbed by the substrate. These adhesives are compounded with water as a diluent, rather than a volatile organic solvent. |
| UV Cured Adhesive | UV curing adhesives induce curing and create a permanent bond without heating by using ultraviolet (UV) light or other radiation sources. An aggregation of monomers and oligomers is cured or polymerized by ultraviolet (UV) or visible light in a UV adhesive. Because UV is a radiating energy source, UV adhesives are often referred to as radiation curing or rad-cure adhesives. |
| Heat-resistant Adhesive | Heat-resistant Adhesives refer to those that do not break down under high temperatures. One aspect of a complicated system of circumstances is the adhesive's capacity to withstand disintegration brought on by high temperatures. As the temperature rises, adhesives may liquefy. They can withstand stresses resulting from differing coefficients of expansion and contraction, which might be an additional advantage. |
| Reshoring | Reshoring is the practice of moving commodity production and manufacturing back to the nation where the business was founded. Onshoring, inshoring, and back shoring are further terms used. Offshoring, the practice of producing items abroad to lower labor and manufacturing costs, is the opposite of this. |
| Oleochemicals | Oleochemicals are compounds produced from biological oils or fats. They resemble petrochemicals, which are substances made from petroleum. The oleochemical business is built on the hydrolysis of oils or fats. |
| Nonporous Materials | Nonporous materials are substances that do not permit the passage of liquid or air. Nonporous materials are those that are not porous, such as glass, plastic, metal, and varnished wood. Since no air can get through, less airflow is required to raise these materials, negating the requirement for high airflow. |
| EU-Vietnam Free Trade Agreement | A trade agreement and an investment protection agreement were concluded between the European Union and Vietnam on June 30, 2019. |
| VOC content | Compounds with limited solubility in water and high vapor pressure are known as Volatile Organic Compounds (VOCs). Many VOCs are human-made chemicals that are used and produced in the manufacture of paints, pharmaceuticals, and refrigerants. |
| Emulsion Polymerization | Emulsion polymerization is a method of producing polymers or connected groups of smaller chemical chains known as monomers, in a water solution. The method is often used to make water-based paints, adhesives, and varnishes, in which the water stays with the polymer and is marketed as a liquid product. |
| 2025 National Packaging Targets | In 2018, the Australian Environment Ministry set the following 2025 National Packaging Targets: 100% of the packaging must be reusable, recyclable, or compostable by 2025, 70% of plastic packaging must be recycled or composted by 2025, 50% of average recycled content must be included in packaging by 2025, and problematic and unnecessary single-use plastic packaging must be phased out by 2025. |
| Russian Government’s Import Substitution Policy | The Western sanctions suspended the distribution of several high-tech items to Russia, including those required by the raw material export sectors and the military-industrial complex. In response, the government launched an "import substitution" scheme, appointing a special commission to oversee its implementation in early 2015. |
| Paper Substrate | Paper substrates are paper sheets, reels, or boards with a base weight of up to 400 g/m2 that has not been converted, printed or otherwise altered. |
| Insulation Material | A material that inhibits or blocks heat, sound, or electrical transmission is known as Insulation Material. The variety of insulation materials includes thick fibers like fiberglass, rock and slag wool, cellulose, and natural fibers as well as stiff foam boards and sleek foils. |
| Thermal Shock | A temperature change known as thermal shock generates stress in a material. It commonly results in material breakdown and is especially prevalent in brittle materials like ceramics. When there is a quick temperature change, either from hot to cold or vice versa, this process occurs abruptly. It occurs more frequently in materials with poor heat conductivity and insufficient structural integrity. |


Research Methodology
Mordor Intelligence follows a four-step methodology in all our reports.
- Step-1: Identify Key Variables: The quantifiable key variables (industry and extraneous) pertaining to the specific product segment and country are selected from a group of relevant variables & factors based on desk research & literature review; along with primary expert inputs. These variables are further confirmed through regression modeling (wherever required).
- Step-2: Build a Market Model: In order to build a robust forecasting methodology, the variables and factors identified in Step-1 are tested against available historical market numbers. Through an iterative process, the variables required for market forecast are set and the model is built on the basis of these variables.
- Step-3: Validate and Finalize: In this important step, all market numbers, variables and analyst calls are validated through an extensive network of primary research experts from the market studied. The respondents are selected across levels and functions to generate a holistic picture of the market studied.
- Step-4: Research Outputs: Syndicated Reports, Custom Consulting Assignments, Databases & Subscription Platforms


