
Asia-Pacific Dumpsters Market Size and Share
Market Overview
| Study Period | 2021 - 2032 |
|---|---|
| Forecast Data Period | 2027 - 2032 |
| Base Year Market Size (2026) | USD 1.86 Billion |
| Market Size (2027) | USD 1.96 Billion |
| Market Size (2032) | USD 2.58 Billion |
| Growth Rate (2027 - 2032) | 5.65 % |
| Market Concentration | Medium |
Major Players *Disclaimer: Major Players sorted in no particular order Image © Mordor Intelligence. Reuse requires attribution under CC BY 4.0. | |
Asia-Pacific Dumpsters Market Analysis by Mordor Intelligence
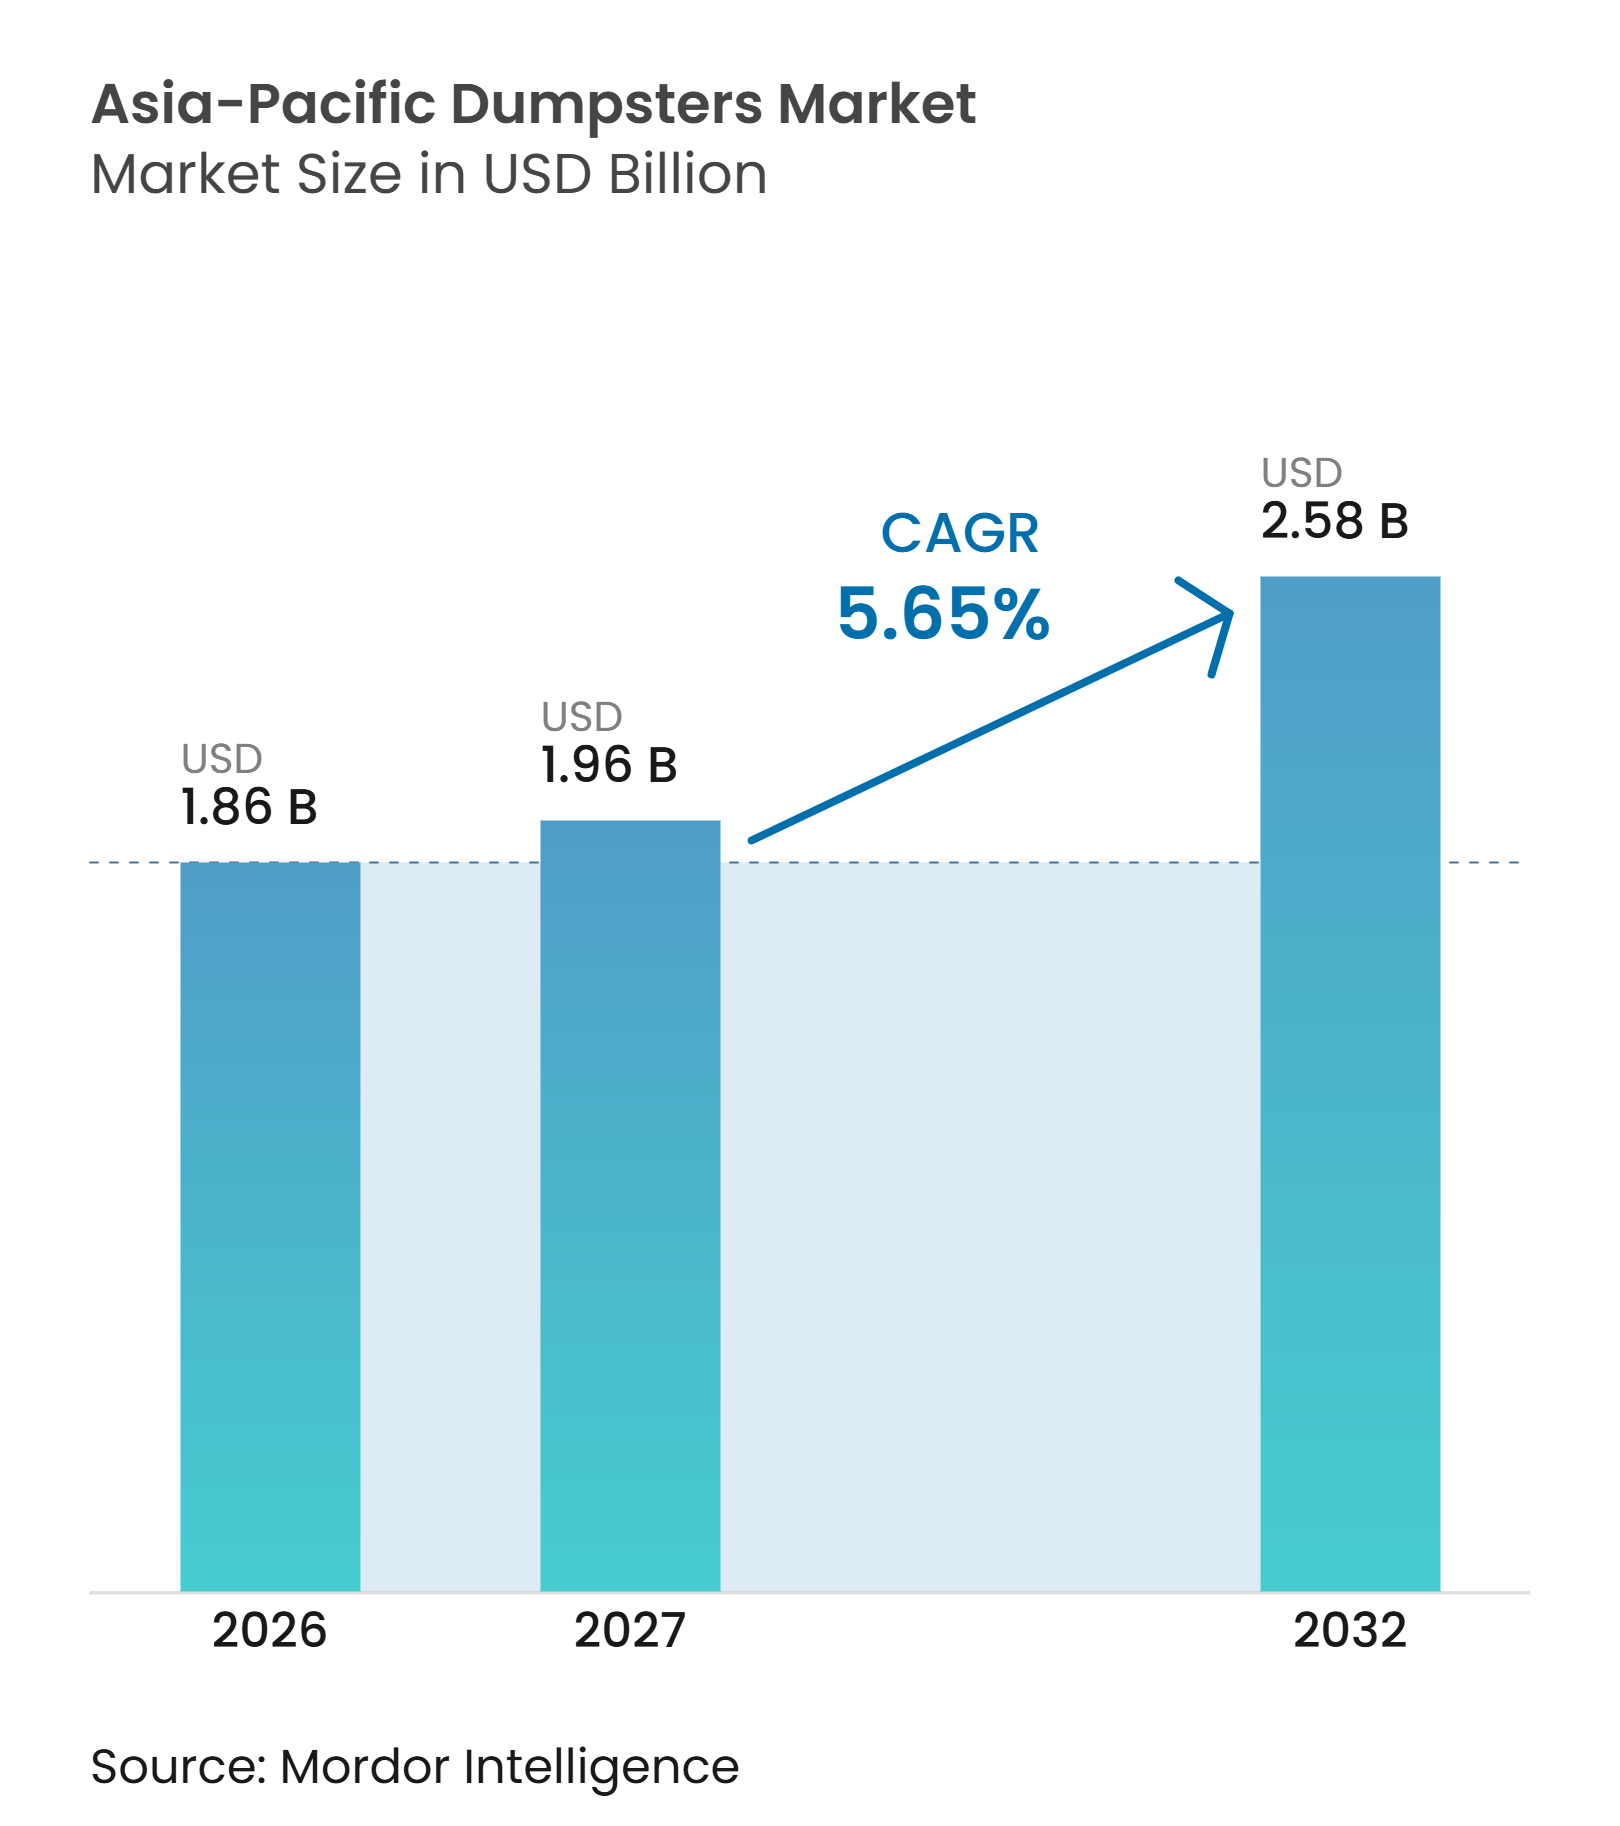
The Asia-Pacific Dumpsters Market size is projected to be USD 1.86 billion in 2026, USD 1.96 billion in 2027, and reach USD 2.58 billion by 2032, growing at a CAGR of 5.65% from 2027 to 2032.
Municipal source-segregation rules are changing container procurement from a single-stream purchase into a recurring need for separate collection units, including dedicated containers for wet, dry, recyclable, and hazardous waste. Construction and demolition regulations in China and India are also making container provision a documented part of project compliance, supporting demand for heavy-duty roll-off dumpsters, skip containers, and high-capacity collection units. Industrial parks, warehouses, manufacturing facilities, and logistics hubs add steady demand for bulk-waste and front-load units as new facilities enter operation. Rapid urbanisation, expanding commercial infrastructure, and rising waste generation are further increasing the need for organised waste collection systems across metropolitan and emerging industrial centres. Demand is also shifting towards containers with higher load-bearing capacity, corrosion-resistant coatings, weather-resistant construction, and designs suited to frequent handling and mechanised collection. Suppliers offering durable, certified, and sensor-ready equipment can address higher-value requirements, particularly among large waste-management operators seeking improved asset utilisation and collection efficiency. Smart monitoring solutions, including fill-level sensors and fleet-connected tracking systems, also create opportunities to optimise collection frequency and reduce unnecessary vehicle movements.
Key Report Takeaways
- By dumpster type, detachable bulk waste containers held 51.8% of the Asia-Pacific dumpsters market share in 2026, while front-load dumpsters are forecast to grow at a 5.9% CAGR through 2032.
- By end-user, municipalities and public waste authorities held 38.3% of the Asia-Pacific dumpsters market size in 2026, while construction, demolition, and infrastructure contractors are forecast to expand at a 6.2% CAGR through 2032.
- By waste type, general and mixed non-hazardous solid waste held a 41.7% share in 2026, while organic and green waste is forecast to expand at a 6.9% CAGR through 2032.
- By bin size, the 10-to-20 cubic-yard class held a 29.8% share in 2026, while the 20-to-30 cubic-yard range is forecast to grow at a 5.9% CAGR through 2032.
- By geography, China held a 41.4% share in 2026, while India is forecast to expand at a 10.7% CAGR through 2032.
Note: Market numbers in this report are based on Mordor Intelligence's proprietary estimation framework, which combines nine months of actuals with Q4 projections for base year 2026.
Market Trends and Insights
Drivers Impact Analysis of Asia-Pacific Dumpsters Market*
| Driver | (~) % Impact on CAGR Forecast | Geographic Relevance | Impact Timeline |
|---|---|---|---|
| Expansion of Municipal Source-Segregation Programs | +1.5% | China, South Korea, ASEAN core, including Thailand, Vietnam, and the Philippines | Short term (≤ 2 years) |
| Construction and Demolition Waste Formalization | +1.2% | China, India, Australia | Medium term (2-4 years) |
| Urban Density and High-Rise Development | +0.9% | China, India, South Korea | Long term (≥ 4 years) |
| Industrial and Logistics-Facility Expansion | +0.8% | ASEAN, including Singapore, Malaysia, Indonesia, and Vietnam, and India | Medium term (2-4 years) |
| Multi-Stream Dumpster Procurement for Food and Organic Waste | +0.6% | South Korea, Australia, Japan, ASEAN | Medium term (2-4 years) |
| Localized Manufacturing to Reduce Imported-Equipment Lead Times | +0.4% | China, India, Vietnam | Long term (≥ 4 years) |
| Source: Mordor Intelligence | |||
Expansion of Municipal Source-Segregation Programs
Municipal segregation programs are increasing the number and type of containers needed at each collection point. Shanghai’s amended urban garbage rules require responsible parties to install and maintain classified waste containers, making usable segregation equipment an ongoing operating requirement.[1] South Korea’s pay-as-you-throw system separates residual waste from recyclables, supporting regular replacement demand in dense urban collection systems.[2] The Asia-Pacific dumpsters market benefits when rules require multiple streams at one site rather than a single general-waste unit. Basel Convention waste-minimization principles and ISO 14001 environmental management practices increasingly inform municipal procurement, strengthening the preference for traceable and multi-stream collection equipment.
Construction and Demolition Waste Formalization
China’s State Council required cities at the prefecture level and above to target construction-waste resource utilization of at least 50% by 2027, while calling for classified storage areas and qualified transport arrangements at worksites.[3] Shanghai also requires contractors to file disposal plans and provide detailed information for separate engineering, demolition, and renovation waste streams. India’s 2025 rules require eligible construction projects to prepare waste-management plans, register with the Central Pollution Control Board, and meet phased recycling targets. These measures make on-site storage and removal equipment part of project administration rather than an optional operating choice. Demand is strongest for hook-lift, roll-off, and skip-type containers that can handle heavy and separated debris. This compliance-led ordering provides the Asia-Pacific dumpsters market with a demand base that is less dependent on short-term construction sentiment.
Urban Density, High-Rise Development
High-rise development increases waste volumes within tight sites and requires dedicated storage capacity at building and precinct level. Jiangsu’s solid-waste rules require residential property managers to provide classified collection containers at accessible locations in apartment complexes. Initial building fit-outs create container orders, while intensive use supports a later replacement cycle. Smaller suppliers in China, India, and Vietnam can shorten delivery times by producing near customer locations, although their ability to meet fixed-price tenders depends on stable material access. In the Asia-Pacific dumpsters market, dense urban sites also favor smaller and modular units where vehicle access and staging space are limited.
Industrial, Logistics, and Organic-Waste Infrastructure
New logistics assets create a sustained need for containers handling packaging, general industrial waste, and separated food waste. ESR began work in 2025 on a 143,000 sqm Singapore logistics and container hub, which is expected to operate in 2027. Separate food-waste programs in South Korea, Japan, Australia, and ASEAN cities are adding a second reason to procure multi-stream equipment. Seoul’s food-waste model uses RFID-enabled collection points and weight-based charging, demonstrating the role of sensor-ready bins in formal organic-waste systems. The Asia-Pacific dumpsters market therefore serves both facility expansion and the move toward specialized collection routes. Operators that pair containers with maintenance, collection compatibility, and monitoring features are better positioned for these applications.
Restraints Impact Analysis of Asia-Pacific Dumpsters Market*
| Restraint | (~) % Impact on CAGR Forecast | Geographic Relevance | Impact Timeline |
|---|---|---|---|
| Steel and Polymer-Resin Cost Volatility | -0.5% | East Asia fabricators in China and South Korea | Short term (≤ 2 years) |
| Fragmented Municipal Procurement and Long Tender Cycles | -0.4% | ASEAN and India secondary cities | Medium term (2-4 years) |
| Limited Standardization Across Asia-Pacific Collection Systems | -0.3% | Cross-border ASEAN and the Australia-ASEAN interface | Long term (≥ 4 years) |
| Unmonitored-Site Damage, Contamination, and Unauthorized Use | -0.2% | Secondary and peri-urban areas across Asia-Pacific | Medium term (2-4 years) |
| Source: Mordor Intelligence | |||
Steel and Polymer-Resin Cost Volatility
Structural steel and polymer resin determine much of a dumpster’s manufacturing cost, making input-price movements a significant influence on procurement bids, production expenses, and supplier margins. Volatile steel and resin prices force fabricators to decide whether to increase tender prices or absorb higher costs under fixed municipal and long-term commercial contracts, creating pressure on profitability when price adjustments cannot be implemented immediately. Smaller manufacturers in Vietnam and Indonesia face added exposure, as imported rolled steel, resin-based components, and currency fluctuations increase their input costs and make procurement planning more difficult. Changes in energy, transportation, and fabrication costs further affect the final price of finished containers, particularly for heavy-duty roll-off dumpsters and large-capacity steel units that require substantial material inputs. Manufacturers may also face difficulties maintaining competitive quotations when customers expect fixed pricing and predictable delivery schedules. These conditions can limit capacity investment, increase working-capital requirements, and make long delivery commitments harder to price, particularly for suppliers operating with limited inventory buffers. In addition, fluctuations in material availability can disrupt production schedules and delay deliveries to waste haulers, construction companies, and municipal customers.
Fragmented Municipal Procurement and Long Tender Cycles
Local procurement systems can slow the conversion of waste-policy requirements into container orders. The International Solid Waste Association noted that Southeast Asian waste programs often rely on separate funding channels for material recovery facilities and bin deployment, creating coordination challenges. A municipality may need separate approvals for containers, trucks, and maintenance, even when all three are needed for one collection program. The Philippines’ decentralized approach under the Ecological Solid Waste Management Act can divide decisions among many local units. Different container standards across ASEAN and Australian systems also complicate cross-border fleet planning. Damage, contamination, and unauthorized use at unmonitored sites add maintenance costs and shorten equipment life. These conditions extend order cycles and can defer revenue for suppliers in the Asia-Pacific dumpsters market.
*Our forecasts treat driver/restraint impacts as directional, not additive. The impact forecasts reflect baseline growth, mix effects, and variable interactions.
Asia-Pacific Dumpsters Market Segment Analysis
By Dumpster Type:
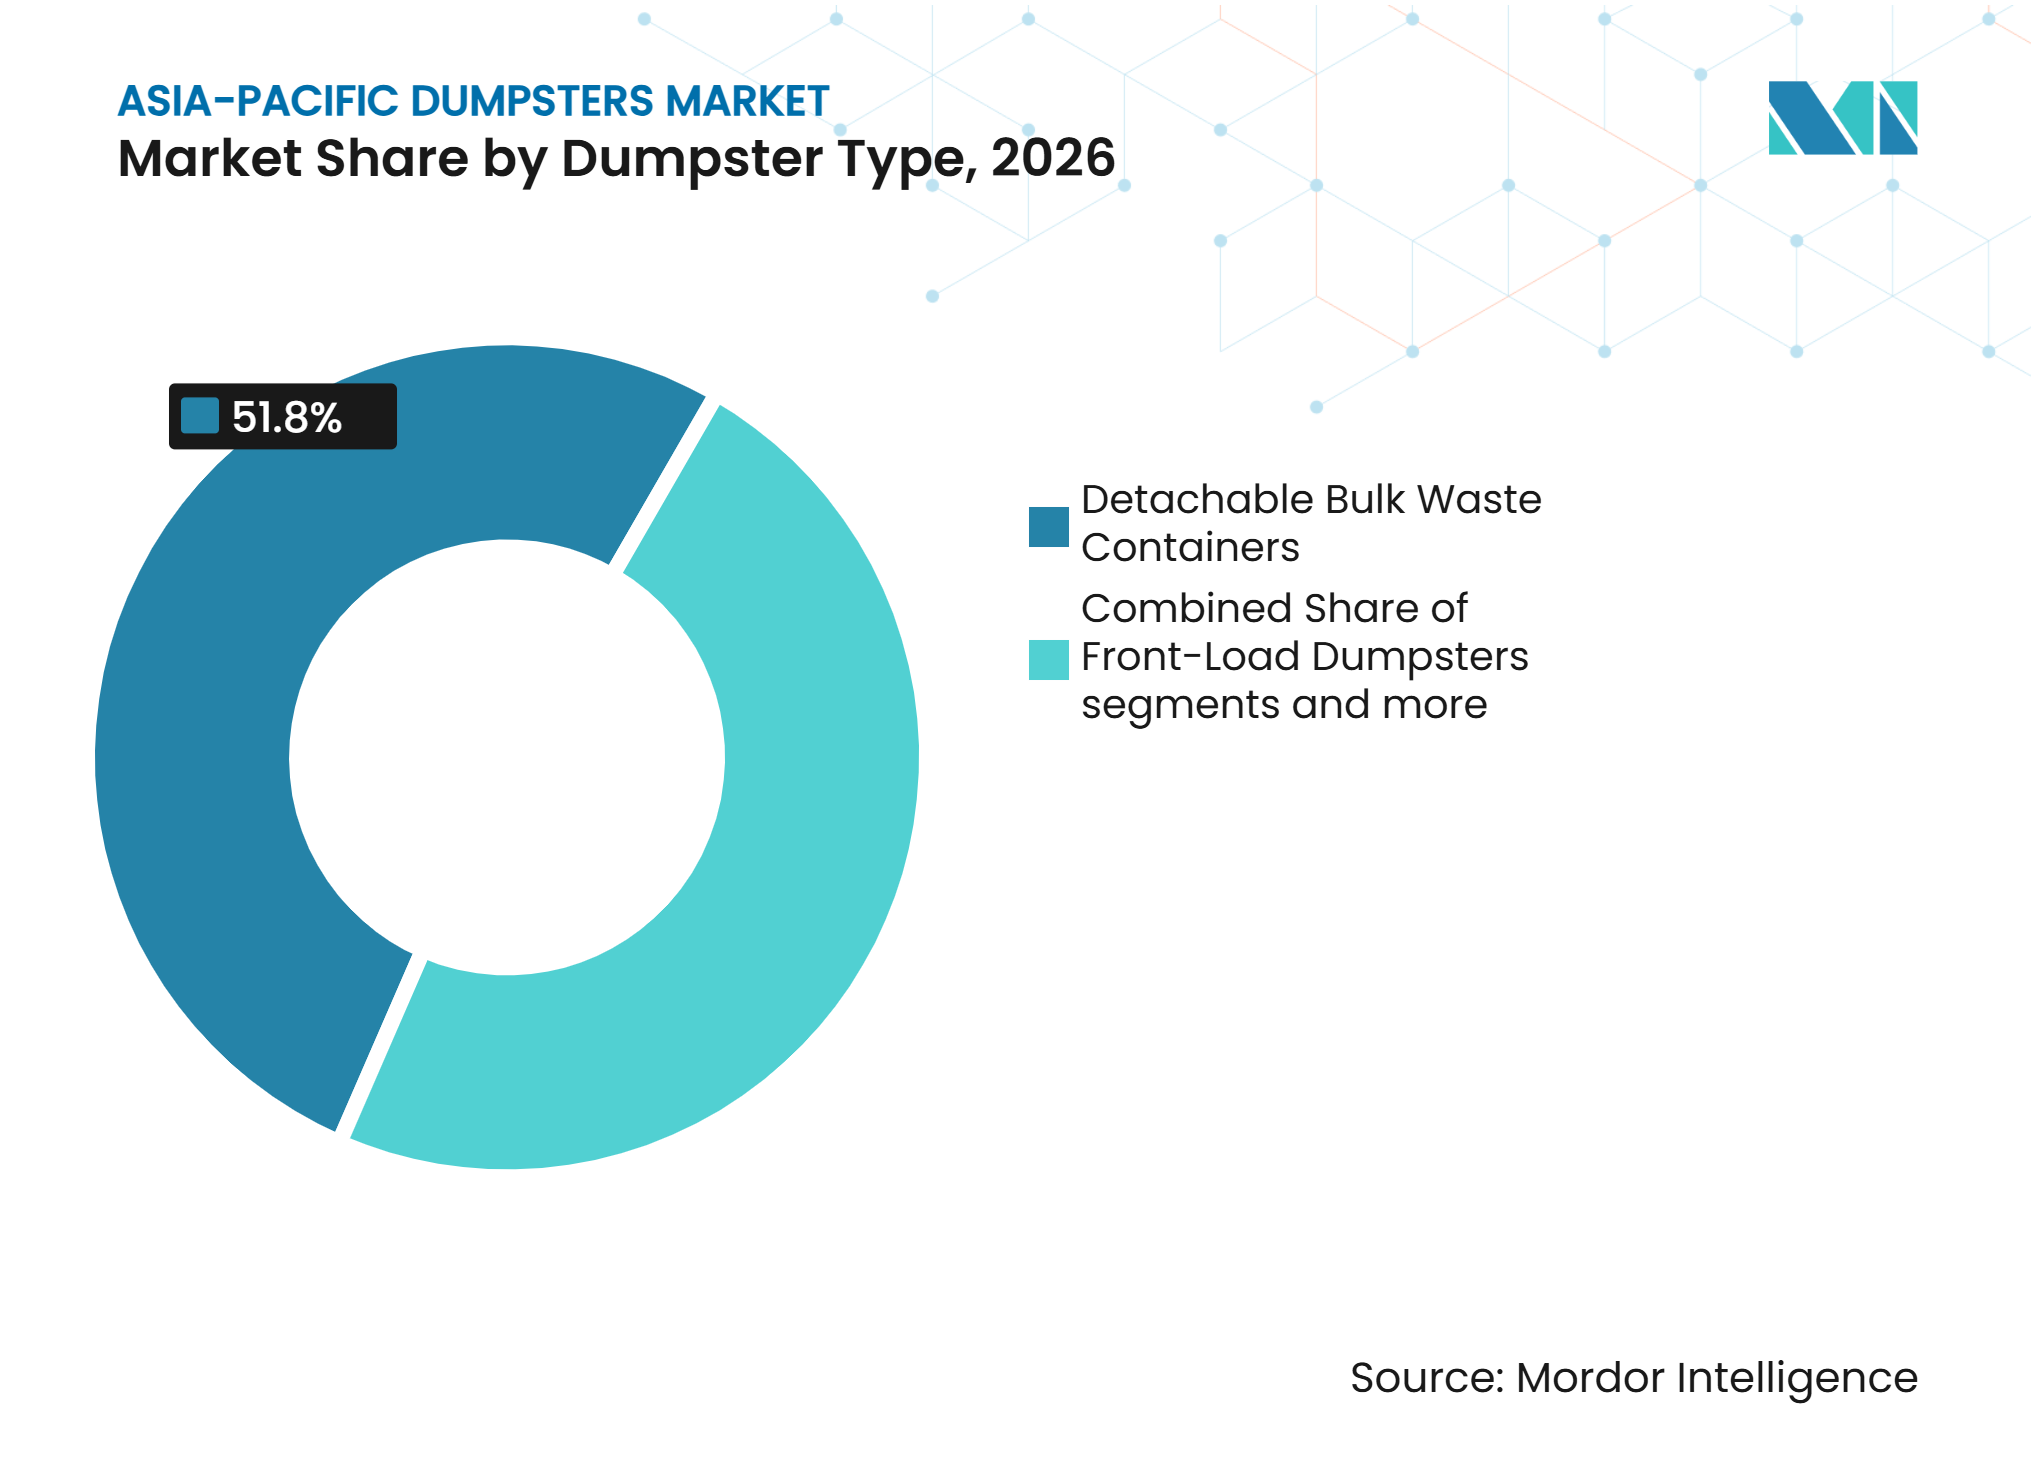
Infrastructure Scale Favors Detachable BulkDetachable bulk waste containers held 51.8% of the Asia-Pacific dumpsters market share in 2026 because high-volume construction, industrial, and transfer applications need roll-off, hook-lift, or cable-hoist collection. Hook-lift units suit dense city sites, while cable-hoist and rail roll-off containers remain suited to open construction yards and port logistics areas. Front-load dumpsters are forecast to grow at a 5.9% CAGR through 2032 as commercial districts adopt mechanized collection that reduces crew needs. Shanghai’s Xuhui District piloted mobile intelligent collection points and autonomous transfer systems in 2025, showing how standardized front-load collection can support smart waste logistics.
Rear-load dumpsters retain stable demand in residential and hospitality routes where front-loading access is not practical. Procurement increasingly considers lifting compatibility, route design, and whether a bin can support multiple waste streams. The Asia-Pacific dumpsters market gains support from urban districts seeking mechanized operations, while detachable systems remain the core option for large loads. Compatible equipment across truck types can address municipal, commercial, and contractor requirements without forcing fleet redesign.



By End-User/Buyer:
Contractors Outpace Municipalities in GrowthMunicipalities and public waste authorities held a 38.3% share of 2026 demand, reflecting their central role in residential and commercial collection services. Beijing conducted monthly inspections across 6,732 waste-collection nodes and processing facilities in 2025, supporting ongoing maintenance and replacement purchases where equipment did not meet operating standards. Waste haulers need several container types on a single route as segregation mandates expand. Commercial properties, hospitality sites, and food-service facilities also require specialized collection capacity.
Construction, demolition, and infrastructure contractors are forecast to grow at a 6.2% CAGR through 2032, the fastest rate among buyer groups. India’s C&D rules and China’s construction-waste governance requirements make detailed site planning and separated storage more common. Dumpster rental and leasing providers benefit where contractors prefer temporary access for project-based work. Material recovery businesses are another developing customer group as stream-specific collection improves the value of separated inputs. These buyer groups extend the Asia-Pacific dumpsters market beyond direct municipal fleet purchases.
By Waste Type:
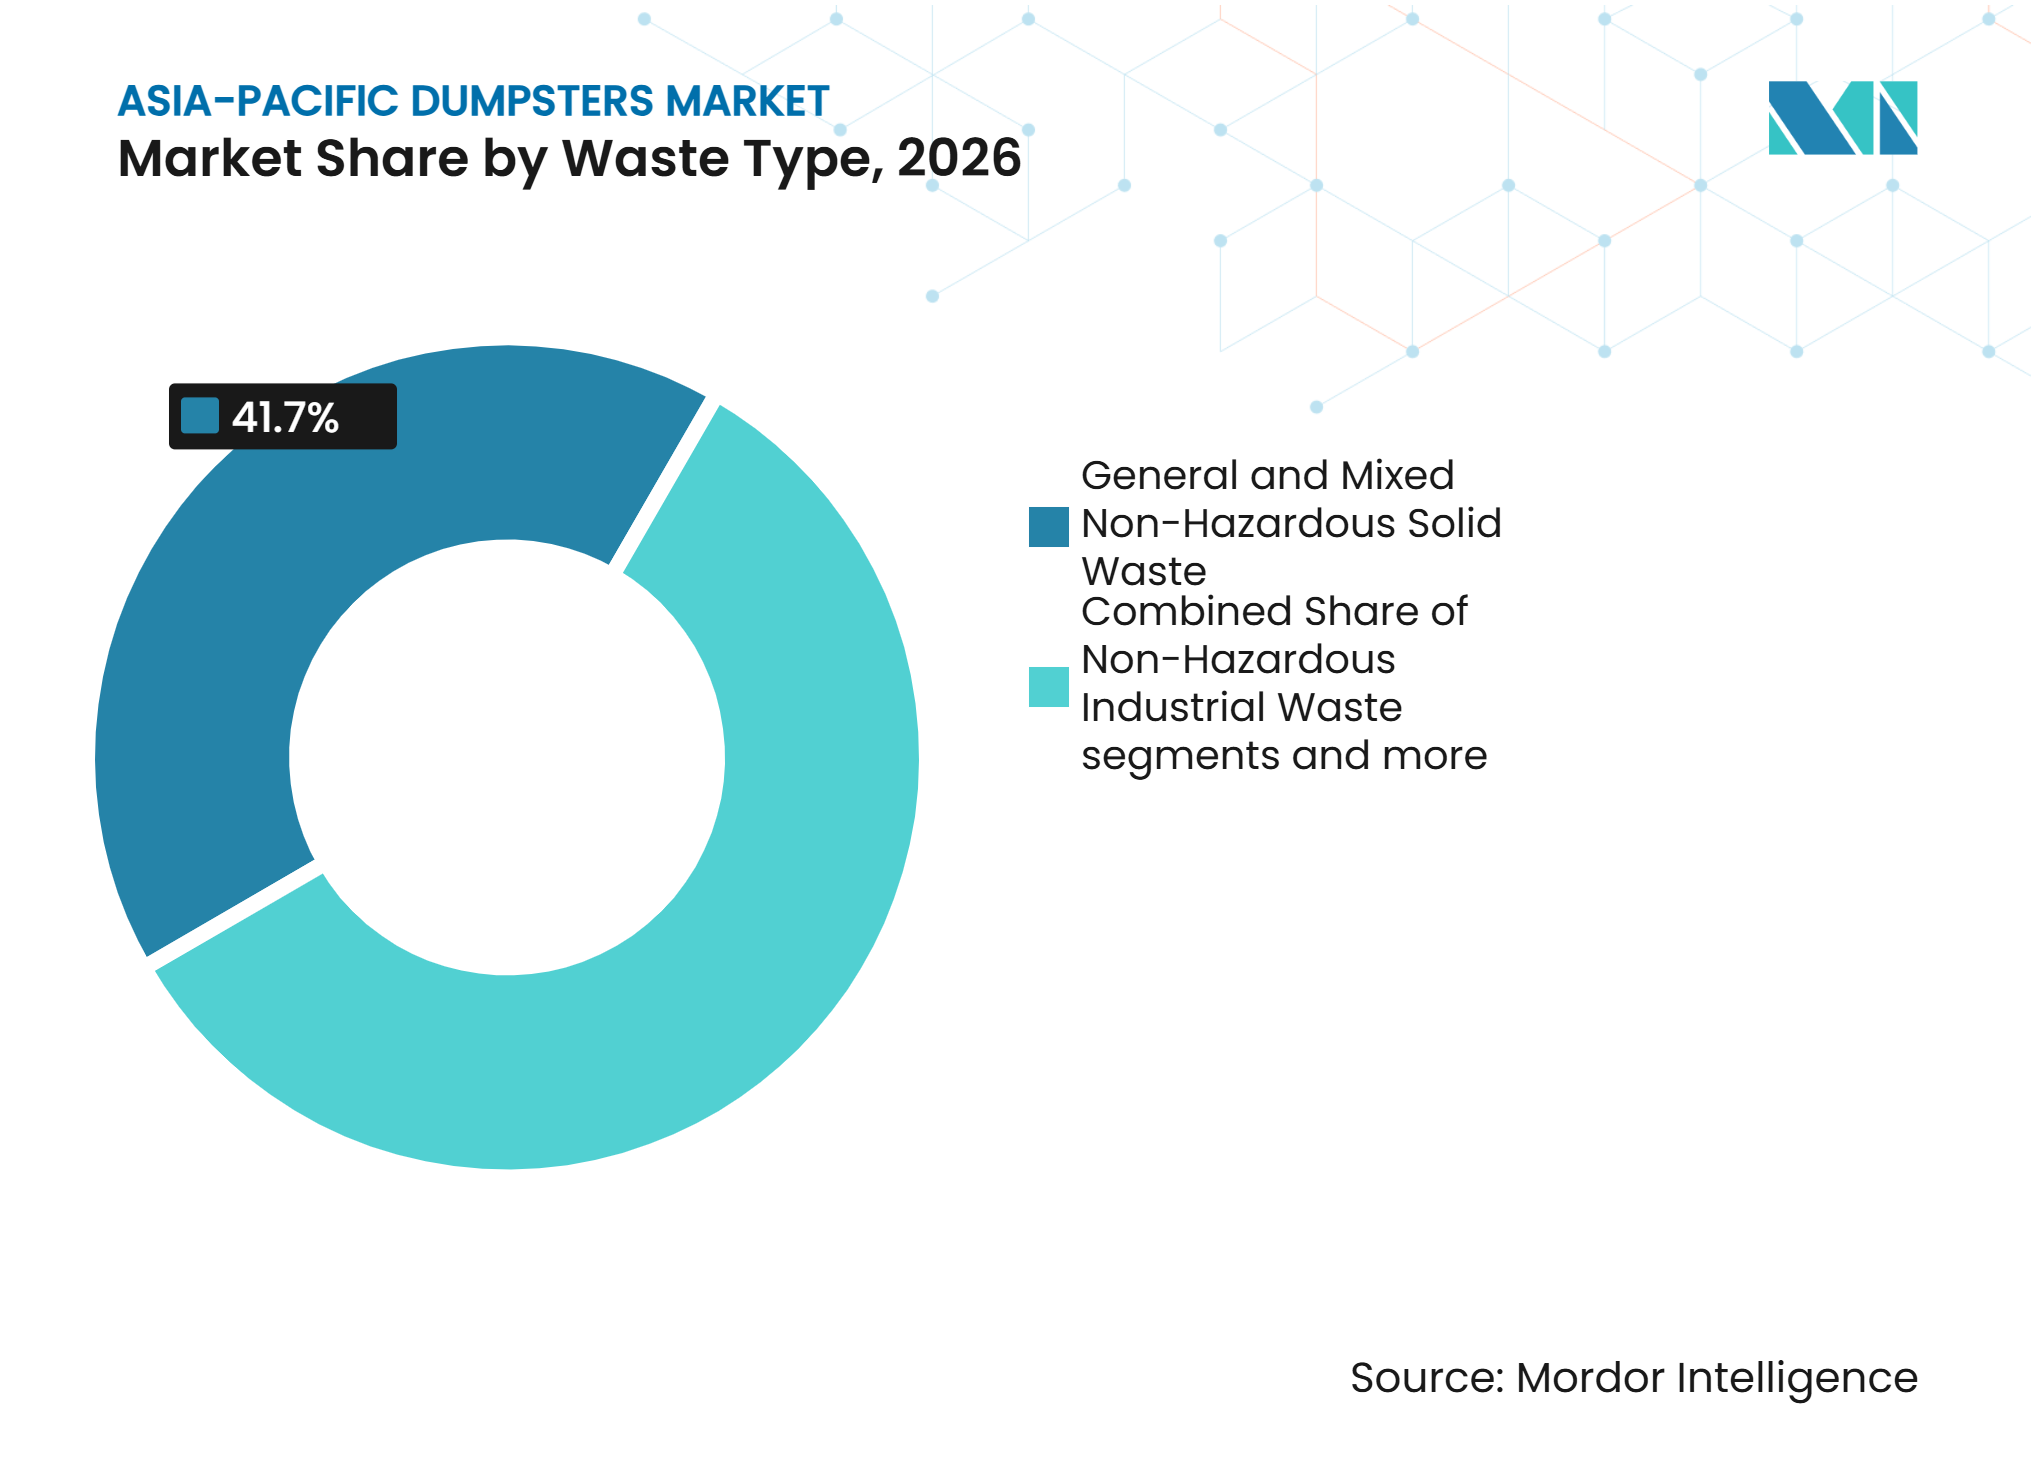
Organics Drive Fastest GrowthGeneral and mixed non-hazardous solid waste held a 41.7% share in 2026 because residual-waste containers remain present across most municipal, commercial, and residential collection routes. Collection providers still need these containers even where segregation policies have expanded. Construction and demolition waste is another large stream, supported by formalized rules that require classified storage and transport arrangements. General waste remains the default collection stream for locations that cannot fully separate material.
Organic and green waste is forecast to grow at a 6.9% CAGR through 2032, the fastest among waste types. Seoul’s RFID system applies a 130 Korean won per kilogram charge at collection points, supporting the use of dedicated and increasingly sensor-enabled bins. Recyclable paper, plastic, glass, and metal containers also benefit as EPR arrangements expand across ASEAN. These waste streams give the Asia-Pacific dumpsters market a growing need for designs that limit contamination and preserve material separation during collection.

By Bin Size (Capacity):
Mid-Range Sizes Lead, Larger Units Gain ShareThe 10-to-20 cubic-yard capacity class held 29.8% of 2026 demand because it fits commercial sites, institutions, mid-scale construction, and municipal transfer operations. This size can reduce truck-dispatch frequency without creating excessive space or access requirements. The 6-to-10 cubic-yard range remains relevant for peri-urban commercial clusters and smaller construction projects. Capacity choice often follows the balance between available footprint, collection frequency, and truck access.
The 20-to-30 cubic-yard range is forecast to grow at a 5.9% CAGR through 2032 as logistics parks and industrial estates handle larger daily waste volumes. Smaller units, including up to 3 and 3-to-6 cubic yards, have a role in high-rise precincts with limited storage space. Shanghai’s Hongkou District introduced lightweight modular renovation-waste containers in apartment settings, demonstrating a compact option for constrained sites. These varied requirements broaden the Asia-Pacific dumpsters market for suppliers with both compact and high-capacity equipment.
Geography Analysis
China: Regulatory Depth Shapes the Market’s Core
China held 41.4% of the Asia-Pacific dumpsters market share in 2026, supported by large municipal waste volumes and established formal collection systems. Shanghai deployed 527 smart dumpsters with fill-level alerts in priority sanitation areas, including Lujiazui, Century Avenue, and Qiantan. Beijing reported a 98.3% waste-segregation participation rate in a 2025 survey of more than 3,200 residents, while average daily recyclables collection rose from more than 3,000 tons to 7,450 tons over five years. The State Council’s 2025 C&D policy adds demand from construction sites by requiring classified storage and a 2027 utilization target. Digital monitoring, including GPS, RFID disposal certificates, and electronic records, supports equipment that can work within traceable service workflows.
India: EPR-Led Growth Drives the Fastest Regional CAGR
India is forecast to grow at a 10.7% CAGR through 2032, the fastest geographic rate in the Asia-Pacific dumpsters market. The 2025 C&D Waste Management Rules place EPR obligations on eligible projects and require registration and waste-management planning. High-rise construction in Mumbai, Hyderabad, Bengaluru, and Gurugram increases the number of locations that must store waste within constrained sites. Regulatory requirements are strengthening demand for documented, separated, and recoverable waste flows. Uneven municipal capacity may slow implementation in some locations, but it leaves room for suppliers that can support compliance through equipment and service.
Regional Divergence Across ASEAN, Japan, South Korea, and Australia
Japan has a structured system for industrial waste collection under its Waste Management and Public Cleansing Act, which supports regular, compliance-driven replacement demand. Vietnam’s Can Tho City introduced classified collection rules that specify truck and container arrangements, showing the formalization of contracted collection in ASEAN cities. Australia’s collection systems are influenced by state permits and standards compliance, while Cleanaway opened a Western Sydney material recovery facility capable of processing 120,000 tons of recyclables annually. Across these mixed markets, container suppliers must accommodate different collection designs, labeling practices, and compliance requirements.
Competitive Landscape
Market Concentration
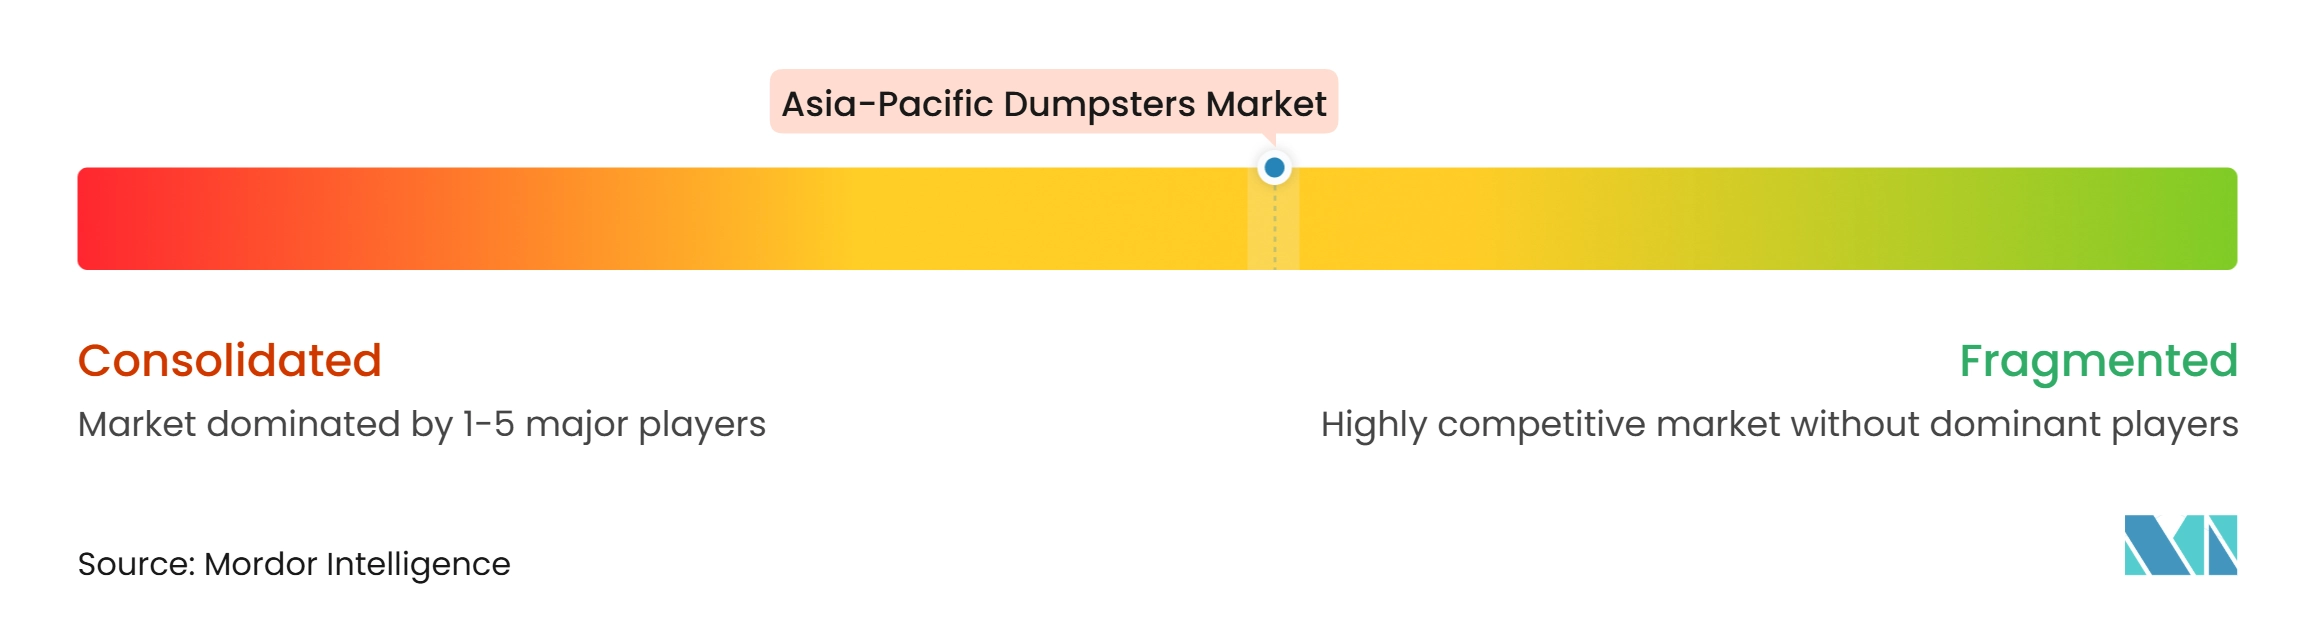
The Asia-Pacific dumpsters market exhibits a medium level of market concentration, with integrated waste operators prominent in Australia, New Zealand, and Japan, while specialist fabricators are concentrated in China and Malaysia. Cleanaway reported FY25 gross revenue of AUD 3.85 billion (USD 2.6 billion) and net revenue growth of 3.4%, while its Blueprint 2030 program continues to emphasize acquisitions and post-collection assets. REMONDIS Australia secured preferred-supplier status under the Western Australian CUARWD2025 arrangement, demonstrating the value of long-term procurement access. Chinese suppliers, including Hunan Tobro Machine, Shandong Brics Machinery, and Hero Equipment, compete on price and customization for hook-lift, roll-off, and front-load products. Their local production offers a cost advantage in export-oriented ASEAN markets.
Digital connectivity and affordable equipment design are important areas of competition in secondary Indian and ASEAN cities. ISO 14001 and national EPR requirements favor certified and traceable supply chains. Suppliers without certifications can be disadvantaged in tenders that assess environmental performance alongside price. Integrated service contracts also allow large operators to influence equipment selection through collection, treatment, and fleet-management arrangements.
Cleanaway’s October 2025 agreement with Acciona to supply waste to the Kwinana Energy Recovery Facility shows how treatment arrangements can influence collection-fleet specification. REMONDIS acquired a controlling interest in GO Organics and plans to double capacity to 124,000 tons annually, supporting increased organics collection in Western Australia. Cleanaway also acquired Citywide Waste and announced an AUD 35 million (USD 23.5 million) upgrade of the Dynon Road site, extending its post-collection resource-recovery platform.
Asia-Pacific Dumpsters Industry Leaders
-
J.J. Richards & Sons Pty Ltd
-
Cleanaway Waste Management Limited
-
MASTEC Pty Ltd
-
Sulomas Sdn Bhd
-
OTTO KOREA CO., LTD.
- *Disclaimer: Major Players sorted in no particular order
Asia-Pacific Dumpsters Market Companies Covered in this Report
- J.J. Richards & Sons Pty Ltd
- Cleanaway Waste Management Limited
- MASTEC Pty Ltd
- Sulomas Sdn Bhd
- OTTO KOREA CO., LTD.
- Wastech Engineering Pty Ltd
- Skip Factory
- Ecube Labs Co., Ltd.
- Hunan Tobro Machine Co., Ltd.
- Shandong Brics Machinery Manufacturing Co., Ltd.
- Hero Equipment (Yangzhou) Co., Ltd.
- Qingdao Ruijunyuan Container Co., Ltd.
- Winnson Ecotech Sdn Bhd
- Molok Oy
- SULO Group
- Veolia Environnement S.A.
- SUEZ S.A.
- REMONDIS Australia Pty Ltd
- WM New Zealand Limited
- Smart Environmental Limited
Recent Industry Developments in Asia-Pacific Dumpsters Market
- April 2026: Forcetech installed two SmaGO solar-powered smart waste bins at Ark Town Utsunomiya in Japan. The units feature automatic waste compaction, reducing waste volume to approximately one-fifth, and cloud-based fill-level monitoring to improve collection efficiency.
- October 2025: Cleanaway entered a long-term agreement with Acciona to supply waste to the Kwinana Energy Recovery Facility in Western Australia, diverting non-recyclable waste from landfill through energy-from-waste technology.
Asia-Pacific Dumpsters Market Report Scope
The Asia-Pacific Dumpsters Market Report is segmented by Dumpster Type (Front-Load Dumpsters, Rear-Load Dumpsters, and more), by End-User/Buyer (Waste Collection and Hauling Companies, and more), by Waste Type (General and Mixed Non-Hazardous Solid Waste, and more), by Bin Size (Up to 3 Cubic Yards, 3 to 6 Cubic Yards, and more), and by Geography (China, Japan, and more). The Market Forecasts are Provided in Terms of Value (USD).
Segmentation Overview
| Front-Load Dumpsters | |
| Rear-Load Dumpsters | |
| Detachable Bulk Waste Containers | Cable-Hoist / Rail Roll-Off Containers |
| Hook-Lift Containers | |
| Skip-Lift / Chain-Lift Containers | |
| Other Detachable Container Configurations | |
| Other Dumpster Types |
| Waste Collection and Hauling Companies | |
| Dumpster Rental and Leasing Companies | |
| Municipalities and Public Waste Authorities | |
| Construction, Demolition and Infrastructure Contractors | |
| Commercial and Institutional Establishments | Retail and Shopping Centers |
| Hospitality, Restaurants and Food Service | |
| Offices and Commercial Buildings | |
| Healthcare and Educational Institutions | |
| Real Estate and Facility Management Companies | |
| Other Commercial and Institutional Establishments | |
| Industrial and Manufacturing Companies | |
| Recycling and Material Recovery Companies | |
| Other Direct Buyers |
| General and Mixed Non-Hazardous Solid Waste |
| Construction and Demolition (C&D) Waste |
| Recyclable Waste (Paper, Cardboard, Plastics, Glass and Metals) |
| Organic and Green Waste (Food, Yard, Landscape and Horticultural Waste) |
| Non-Hazardous Industrial Waste |
| Bulky Waste and Cleanout Materials |
| Other Non-Hazardous Waste |
| Up to 3 Cubic Yards |
| 3 to 6 Cubic Yards |
| 6 to 10 Cubic Yards |
| 10 to 20 Cubic Yards |
| 20 to 30 Cubic Yards |
| 30 to 40 Cubic Yards |
| Above 40 Cubic Yards |
| China |
| Japan |
| India |
| South Korea |
| ASEAN (Indonesia, Thailand, Philippines, Malaysia, Vietnam) |
| Australia |
| Rest of Asia-Pacific |
| By Dumpster Type | Front-Load Dumpsters | |
| Rear-Load Dumpsters | ||
| Detachable Bulk Waste Containers | Cable-Hoist / Rail Roll-Off Containers | |
| Hook-Lift Containers | ||
| Skip-Lift / Chain-Lift Containers | ||
| Other Detachable Container Configurations | ||
| Other Dumpster Types | ||
| By End-User/Buyer | Waste Collection and Hauling Companies | |
| Dumpster Rental and Leasing Companies | ||
| Municipalities and Public Waste Authorities | ||
| Construction, Demolition and Infrastructure Contractors | ||
| Commercial and Institutional Establishments | Retail and Shopping Centers | |
| Hospitality, Restaurants and Food Service | ||
| Offices and Commercial Buildings | ||
| Healthcare and Educational Institutions | ||
| Real Estate and Facility Management Companies | ||
| Other Commercial and Institutional Establishments | ||
| Industrial and Manufacturing Companies | ||
| Recycling and Material Recovery Companies | ||
| Other Direct Buyers | ||
| By Waste Type | General and Mixed Non-Hazardous Solid Waste | |
| Construction and Demolition (C&D) Waste | ||
| Recyclable Waste (Paper, Cardboard, Plastics, Glass and Metals) | ||
| Organic and Green Waste (Food, Yard, Landscape and Horticultural Waste) | ||
| Non-Hazardous Industrial Waste | ||
| Bulky Waste and Cleanout Materials | ||
| Other Non-Hazardous Waste | ||
| By Bin Size (Capacity) | Up to 3 Cubic Yards | |
| 3 to 6 Cubic Yards | ||
| 6 to 10 Cubic Yards | ||
| 10 to 20 Cubic Yards | ||
| 20 to 30 Cubic Yards | ||
| 30 to 40 Cubic Yards | ||
| Above 40 Cubic Yards | ||
| By Geography | China | |
| Japan | ||
| India | ||
| South Korea | ||
| ASEAN (Indonesia, Thailand, Philippines, Malaysia, Vietnam) | ||
| Australia | ||
| Rest of Asia-Pacific | ||
Key Questions Answered in the Report
What is the projected value of the Asia-Pacific dumpsters market by 2032?
The market is projected to reach USD 2.58 billion by 2032, from USD 1.86 billion in 2026, at a 5.65% CAGR.
Which dumpster type has the largest share in Asia-Pacific?
Detachable bulk waste containers held a 51.8% share in 2026 because construction, industrial, and transfer sites need high-volume handling.
What is driving demand for waste containers in India?
India’s 10.7% CAGR forecast is supported by urban density, smart-city projects, and 2025 C&D rules that require waste-management planning and registration.
Which waste stream is growing fastest for dumpsters in Asia-Pacific?
Organic and green waste is forecast to grow at a 6.9% CAGR through 2032 as cities expand separate food-waste collection programs.
Why are front-load dumpsters growing in urban areas?
Front-load dumpsters are forecast to grow at a 5.9% CAGR through 2032 because mechanized collection can reduce crew requirements in commercial districts.
What factors slow procurement of dumpsters across Southeast Asia?
Fragmented local tender systems, different equipment specifications, and separate approvals for containers, trucks, and maintenance can delay deployment.