Market Overview
| Study Period | 2020 - 2031 |
|---|---|
| Forecast Data Period | 2026 - 2031 |
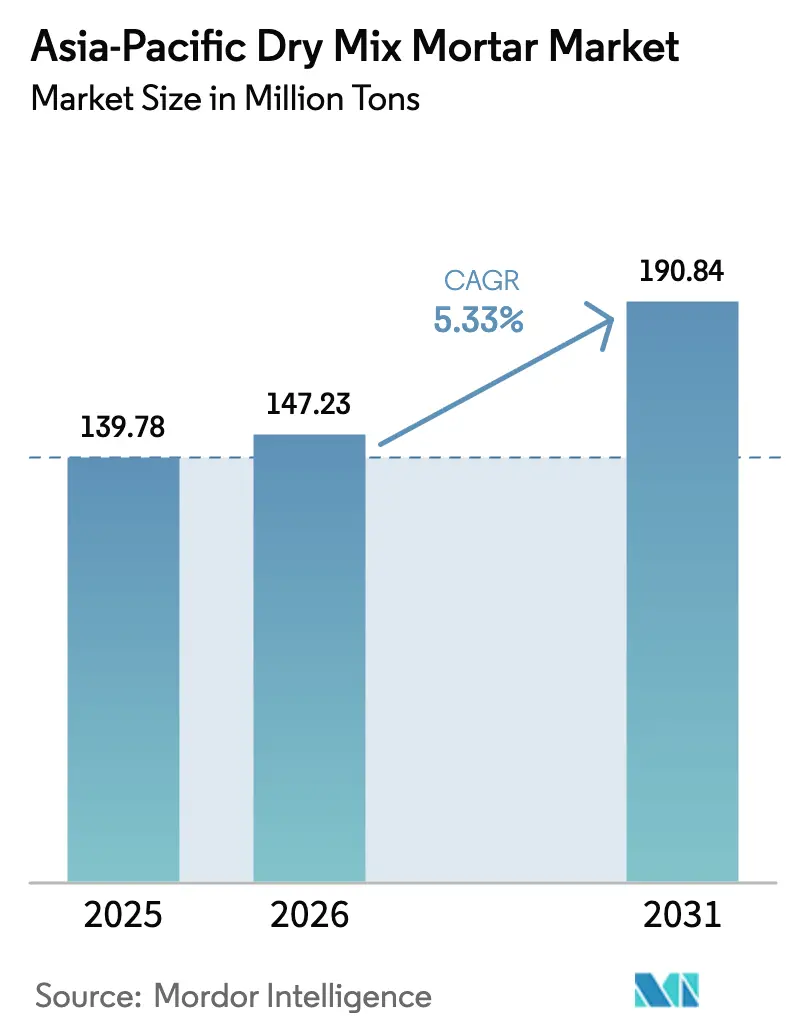
| Base Year Market Size (2025) | 139.78 Million tons |
| Market Volume (2026) | 147.23 Million tons |
| Market Volume (2031) | 190.84 Million tons |
| Growth Rate (2026 - 2031) | 5.33% CAGR |
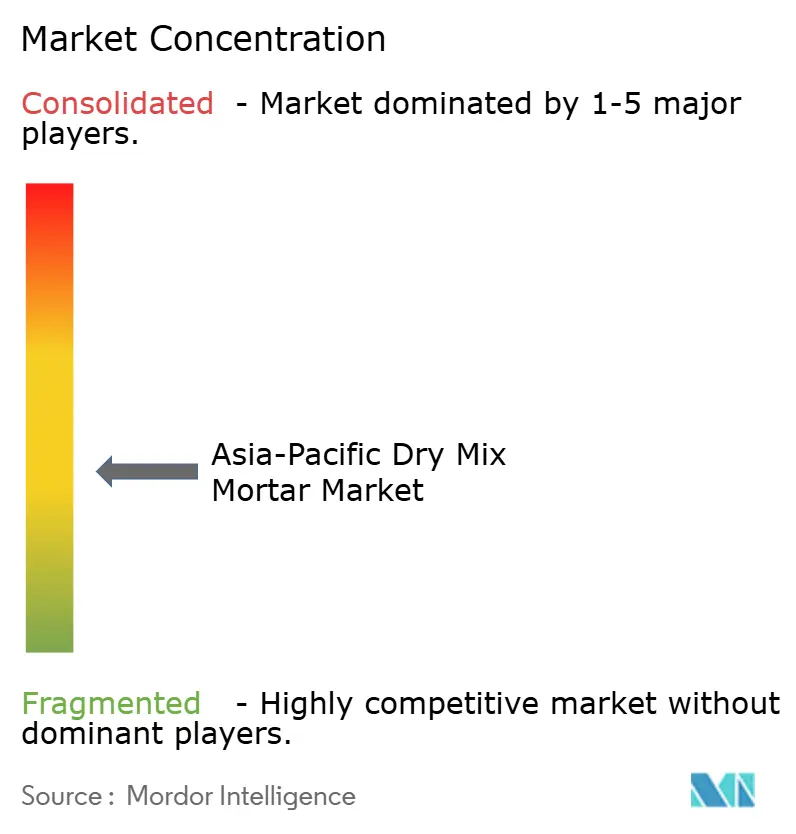
| Market Concentration | Medium |
Major Players *Disclaimer: Major Players sorted in no particular order Image © Mordor Intelligence. Reuse requires attribution under CC BY 4.0. | |
Asia-Pacific Dry Mix Mortar Market Analysis by Mordor Intelligence
The Asia-Pacific Dry Mix Mortar Market size is expected to grow from 139.78 Million tons in 2025 to 147.23 Million tons in 2026 and is forecast to reach 190.84 Million tons by 2031 at 5.33% CAGR over 2026-2031. This expansion stems from accelerating urbanization, government-funded mega-infrastructure programs, and the steady replacement of on-site wet mixes with factory-produced alternatives that improve quality control, cut waste, and compress construction schedules. The rising adoption of prefab and modular construction, stricter urban dust-abatement rules, and the cost benefits of energy-efficient vertical-silo plants further reinforce demand. Regional consumption gains are uneven: China supplies the bulk of volumes, while high-growth pockets such as Vietnam, Indonesia, and India underpin incremental tonnage. Competition centers on product differentiation, distribution reach, and sustainability credentials as carbon pricing and low-clinker formulations shift procurement preferences.
Key Report Takeaways
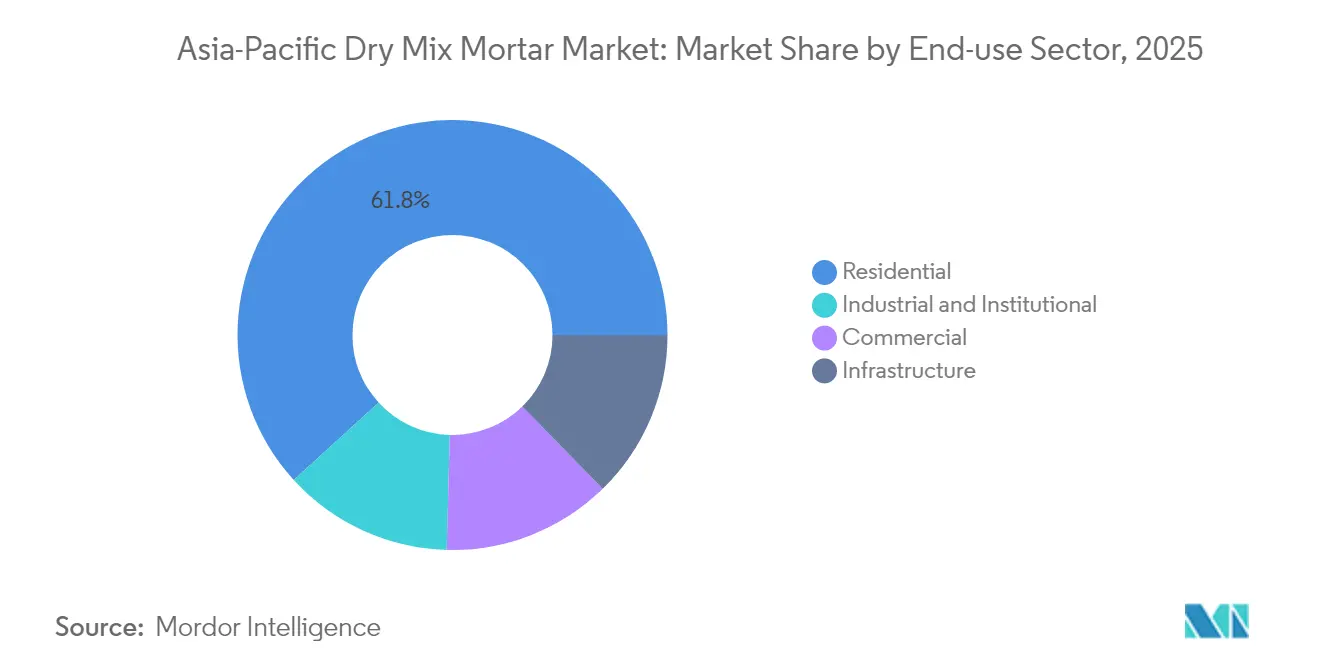
- By end-use sector, the residential sector held a 61.78% market share in 2025 and is expected to grow at the fastest CAGR of 5.67% by 2031.
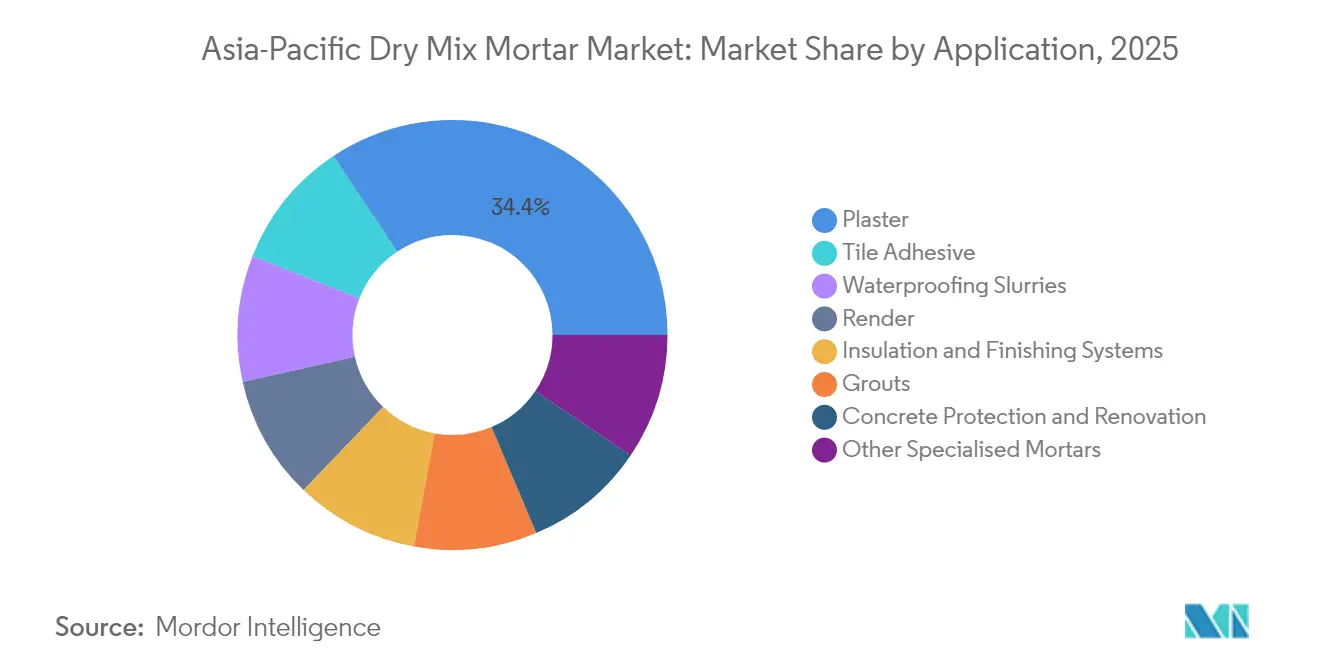
- By application, plaster held a 34.35% market share in 2025, while tile adhesive is projected to capture a 6.95% CAGR growth, outpacing all other segments through 2031.
- By geography, China held a 71.88% share of the Asia-Pacific dry mix mortar market size in 2025, while Vietnam is expected to record the fastest growth at a 6.99% CAGR through 2031.
Note: Market size and forecast figures in this report are generated using Mordor Intelligence’s proprietary estimation framework, updated with the latest available data and insights as of 2026.
Asia-Pacific Dry Mix Mortar Market Trends and Insights
Drivers Impact Analysis*
| Driver | (~) % Impact on CAGR Forecast | Geographic Relevance | Impact Timeline |
|---|---|---|---|
| Government-funded mega-infrastructure pipeline | +1.2% | China, India, Indonesia, Vietnam | Long term (≥ 4 years) |
| Rapid prefab and modular construction uptake | +0.9% | Japan, South Korea, Australia, China | Medium term (2-4 years) |
| Shift to large-format tiles requires high-performance adhesives | +0.7% | APAC core markets, spill-over to emerging economies | Medium term (2-4 years) |
| Urban dust-abatement bans on on-site sand mortars | +0.6% | Major Chinese cities, Indian metros, Jakarta | Short term (≤ 2 years) |
| Cost advantage of low-energy vertical-silo plants | +0.4% | Global, with early adoption in China and India | Long term (≥ 4 years) |
| Carbon-pricing accelerates low-clinker dry mixes | +0.3% | China, Japan, South Korea, Australia | Long term (≥ 4 years) |
| Source: Mordor Intelligence | |||


Government-Funded Mega-Infrastructure Pipeline
Governments across the region have earmarked more than USD 2.3 trillion for transport, urban renewal, and industrial corridors through 2030, creating sustained demand for standardized mortars that deliver batch-to-batch consistency[1]Asian Development Bank, “Meeting Asia’s Infrastructure Needs,” adb.org. China alone spent USD 540 billion on infrastructure in 2024, while India’s National Infrastructure Pipeline targets USD 1.4 trillion. Vietnam increased its infrastructure allocation by 23% year-over-year, with a focus on high-speed rail and ports. Large, multi-site projects require uniform specifications that only factory-produced dry mixes can supply reliably. The pipeline’s multi-year horizon locks in baseline demand and provides producers with visibility to invest in new capacity.
Rapid Prefab and Modular Construction Uptake
In 2024, 34% of Japan’s new residential units and 28% of South Korea’s housing starts utilized modular components, reflecting the mounting labor shortages and the need for shorter construction times. Prefab plants insist on pre-formulated mortars that arrive ready to use and meet precise performance tolerances. Automated assembly lines eliminate on-site mixing variability, making dry mixes integral to factory-controlled workflows. The International Labour Organization reported a 12% decline in construction labor availability across developed Asian economies in 2024, which has amplified interest in automated solutions. Prefab construction cuts project duration by up to 40%, which in turn accelerates mortar turnover and broadens supplier opportunities.
Shift to Large-Format Tiles Requires High-Performance Adhesives
Tiles larger than 600 mm x 600 mm represented 42% of commercial installations in 2024, particularly in premium retail and hospitality projects. Large slabs impose higher dead loads and thermal movement, demanding adhesives with extended open time, superior slip resistance, and flexibility—features delivered by polymer-rich dry mixes. MAPEI reported that high-performance adhesives for large-format tiles command a 15-25% price premium, driving the application segment’s 7.17% CAGR growth through 2030[2]MAPEI S.p.A, “Large-Format Tile Adhesive Solutions,” mapei.com. Developers favor the aesthetic continuity and lower grout maintenance of large slabs, ensuring sustained demand for specialty adhesives.
Urban Dust-Abatement Bans on On-Site Sand Mortars
Beijing, Shanghai, and Delhi now restrict or ban on-site sand mixing to curb particulate emissions, effectively mandating ready-mixed alternatives in dense urban cores. Mumbai’s 2024 ordinance prohibits on-site mixing within 500 meters of residential zones, covering roughly 60% of the city's construction area. Jakarta extended similar rules to projects above 10,000 m² from January 2025. These interventions elevate dry mix mortars from an optional premium to a regulatory requirement, rapidly shifting contractor purchasing patterns.
Restraints Impact Analysis*
| Restraint | (~) % Impact on CAGR Forecast | Geographic Relevance | Impact Timeline |
|---|---|---|---|
| Raw-material price volatility (cement and polymers) | -0.80% | Global, with acute impact in import-dependent markets like Indonesia, Malaysia, Vietnam | Short term (≤ 2 years) |
| Skill gap among applicators causing failures | -0.50% | Emerging markets, particularly India, Indonesia, Vietnam, Thailand | Medium term (2-4 years) |
| High last-mile logistics cost in archipelagos | -0.40% | Indonesia, Philippines, Malaysia, with spillover to remote areas across APAC | Long term (≥ 4 years) |
| Fragmented regional standards and certification | -0.30% | APAC-wide, with particular complexity in cross-border projects spanning multiple countries | Medium term (2-4 years) |
| Source: Mordor Intelligence | |||
Raw-Material Price Volatility (Cement and Polymers)
Cement prices fluctuated by 25-35% across leading Asian markets in 2024 as energy and freight costs fluctuated. Redispersible polymer powder, critical for adhesion and flexibility, rose 18% in Southeast Asia. Such swings squeeze manufacturers’ margins and complicate contractor budgeting, occasionally delaying specification upgrades. Import-dependent countries bear currency risks that exacerbate price uncertainty. Limited regional capacity for specialty additives heightens supply-security concerns, forcing distributors to carry higher inventories during volatile periods.
Skill Gap Among Applicators Causing Failures
Product failures traceable to poor workmanship account for up to 25% of warranty claims in India, Indonesia, and Vietnam. Only 23% of India’s construction labor force has formal training in modern material application, according to the Ministry of Skill Development and Entrepreneurship. Inadequate surface preparation, incorrect water ratios, and premature load application lead to delamination, cracking, or inconsistent aesthetics. High turnover among site crews further erodes institutional knowledge. Manufacturers and trade associations have expanded training academies, but bridging the skills gap remains a multi-year endeavor.
*Our forecasts treat driver/restraint impacts as directional, not additive. The impact forecasts reflect baseline growth, mix effects, and variable interactions.
Segment Analysis
By End-use Sector: Residential Dominance
Residential construction accounted for 61.78% of 2025 demand and is expected to expand by 5.67% annually through 2031, underpinning the growth of the Asia-Pacific dry mix mortar market size. Urban migration, favorable mortgage terms, and government-driven affordable housing initiatives sustain unit launches across China, India, and Southeast Asia. Dry mix mortars reduce build times and enhance site cleanliness, attributes highly valued by developers on tight delivery schedules. Standardization also reduces rework, an important cost consideration in price-sensitive housing segments.
Commercial construction—covering offices, malls, and hospitality—tracks macroeconomic activity and is poised for mid-single-digit expansion. Developers are increasingly specifying low-VOC mortars to meet green-building labels, offering suppliers opportunities for upselling. Infrastructure and industrial projects yield consistent baseline volumes; extended contract tenures ensure year-round consumption even when real estate cycles soften. Public-sector procurement typically favors lowest-bidder dynamics, which pressurize margins while delivering scale. Institutional projects, such as hospitals and schools, demand high-automation mortars for hygiene and durability, which in turn invite specialty suppliers. The end-use mix signals a lasting dominance of residential volumes, underscoring the need for tailored product lines that serve diverse performance envelopes.


By Application: Tile Adhesive Drives Premium Segment Growth
Plaster retained the largest 34.35% share in 2025 and is expected to continue growing steadily, driven by baseline construction activity, particularly in mass housing. Render, grout, and concrete repair mortars post mid-single-digit growth, benefiting from façade upgrades and infrastructure maintenance. Waterproofing slurries and insulation-and-finishing systems are experiencing above-average growth in flood-prone geographies, as these areas seek climate-resilient buildings. Specialty mortars, though niche in volume, generate attractive EBIT contributions due to proprietary chemistries and limited competition.
Tile adhesive applications are forecast to expand at a 6.95% CAGR, surpassing the overall Asia-Pacific dry mix mortar market. The surge is directly linked to the increased adoption of large-format tiles and the rising performance requirements in high-traffic commercial spaces. Contractors prefer polymer-modified products that guarantee adhesion strength and minimize hollow spots under oversized slabs. The application segment attracts global suppliers who bundle technical support with premium formulations, enabling specification lock-in on marquee projects.
Geography Analysis
China held a 71.88% share of the Asia-Pacific dry mix mortar market in 2025, reflecting its vast construction ecosystem and entrenched vertical integration between cement, additives, and mortar production. Domestic volumes level off as megacity growth peaks, steering manufacturers toward product premiumization and export sales into Belt and Road corridors. Environmental regulations in tier-one cities restrict on-site mixing, thereby reinforcing the adoption of dry mix, while provincial oversupply spurs cross-border shipments into Southeast Asia.
Vietnam is expected to record the region’s fastest growth rate of 6.99% from 2026 to 2031, as foreign direct investment drives the development of industrial parks, ports, and high-rise housing. The government’s USD 2.1 billion materials investment drive accelerates capacity additions and supports demand for standardized mortars that meet global quality benchmarks. Training programs financed by multilateral lenders aim to close application skill gaps and reduce failure rates, improving market confidence.
India ranks second in absolute volume; its National Infrastructure Pipeline and urban renewal missions keep demand brisk. Regional fragmentation of building codes forces producers to operate localized plants or partner with state distributors. Indonesia’s archipelago geography raises freight costs but opens island-focused micro-markets as connectivity megaprojects come onstream. Japan and South Korea exhibit stable replacement demand centered on seismic reinforcement and energy-efficient retrofits; stringent standards allow premium pricing. Thailand and Malaysia serve as export nodes feeding neighboring economies, while Australia’s regulatory rigor favors high-performance mortars for extreme-climate resilience. Geographic diversity thus presents a matrix of volume-driven emerging markets and value-driven mature economies requiring nuanced go-to-market playbooks.
Competitive Landscape
The Asia-Pacific Dry Mix Mortar Market is fragmented. Multinationals such as MAPEI, Sika, and Saint-Gobain lean on proprietary chemistries, technical advisory teams, and multi-country distribution to secure project specifications. White-space opportunities attract disruptors offering data-driven formulation optimization and prefabrication-specific mortars. Training academies run by Knauf and Ardex reinforce product loyalty by certifying applicators and reducing the number of failure claims. The landscape remains ripe for bolt-on acquisitions that expand geographic reach or fill portfolio gaps in waterproofing, insulation systems, and repair mortars.
Asia-Pacific Dry Mix Mortar Industry Leaders
Saint-Gobain
SCG
Sika AG
HANIL HOLDINGS CO., LTD.
MUHU (China) Construction Materials Co., Ltd.
- *Disclaimer: Major Players sorted in no particular order

Recent Industry Developments
- September 2025: Saint-Gobain divested its Weber dry-mix mortars division to Franken Maxit, propelling Franken Maxit to the forefront as one of Germany's largest dry mortar producers. Following the transaction, the newly formed joint venture boasts 17 sites across Germany and the Czech Republic. The venture employs over 1,200 individuals, with around 400 hailing from Saint-Gobain Weber.
- July 2025: CORINMAC successfully loaded and dispatched its simple dry mix mortar production line to Kyrgyzstan. This production line specializes in creating powder products, including tile adhesives, wall putty, and skim coats. The equipment, designed for ease and practicality, streamlines the process from raw material feeding to finished product packaging.


Asia-Pacific Dry Mix Mortar Market Report Scope
Commercial, Industrial and Institutional, Infrastructure, Residential are covered as segments by End Use Sector. Concrete Protection and Renovation, Grouts, Insulation and Finishing Systems, Plaster, Render, Tile Adhesive, Water Proofing Slurries are covered as segments by Application. Australia, China, India, Indonesia, Japan, Malaysia, South Korea, Thailand, Vietnam are covered as segments by Country.By End-Use Sector (Value)
| Residential |
| Commercial |
| Industrial and Institutional |
| Infrastructure |
By Application (Value)
| Plaster |
| Render |
| Tile Adhesive |
| Grouts |
| Concrete Protection and Renovation |
| Insulation and Finishing Systems |
| Waterproofing Slurries |
| Other Specialised Mortars |
By Country (Value)
| Australia |
| China |
| India |
| Indonesia |
| Japan |
| Malaysia |
| South Korea |
| Thailand |
| Vietnam |
| Rest of Asia-Pacific |
| By End-Use Sector (Value) | Residential |
| Commercial | |
| Industrial and Institutional | |
| Infrastructure | |
| By Application (Value) | Plaster |
| Render | |
| Tile Adhesive | |
| Grouts | |
| Concrete Protection and Renovation | |
| Insulation and Finishing Systems | |
| Waterproofing Slurries | |
| Other Specialised Mortars | |
| By Country (Value) | Australia |
| China | |
| India | |
| Indonesia | |
| Japan | |
| Malaysia | |
| South Korea | |
| Thailand | |
| Vietnam | |
| Rest of Asia-Pacific |


Market Definition
- END-USE SECTOR - Dry mix mortar consumed in the construction sectors such as commercial, residential, industrial, institutional, and infrastructure are considered under the scope of the study.
- PRODUCT/APPLICATION - Under the scope of the study, consumption of dry mix mortar products for plaster, render, tile adhesive, grouts, waterproofing slurries, concrete protection and renovation, insulated and finishing systems along with other applications are considered.
| Keyword | Definition |
|---|---|
| Accelerator | Accelerators are admixtures used to fasten the setting time of concrete by increasing the initial rate and speeding up the chemical reaction between cement and the mixing water. These are used to harden and increase the strength of concrete quickly. |
| Acrylic | This synthetic resin is a derivative of acrylic acid. It forms a smooth surface and is mainly used for various indoor applications. The material can also be used for outdoor applications with a special formulation. |
| Adhesives | Adhesives are bonding agents used to join materials by gluing. Adhesives can be used in construction for many applications, such as carpet laying, ceramic tiles, countertop lamination, etc. |
| Air Entraining Admixture | Air-entraining admixtures are used to improve the performance and durability of concrete. Once added, they create uniformly distributed small air bubbles to impart enhanced properties to the fresh and hardened concrete. |
| Alkyd | Alkyds are used in solvent-based paints such as construction and automotive paints, traffic paints, flooring resins, protective coatings for concrete, etc. Alkyd resins are formed by the reaction of an oil (fatty acid), a polyunsaturated alcohol (Polyol), and a polyunsaturated acid or anhydride. |
| Anchors and Grouts | Anchors and grouts are construction chemicals that stabilize and improve the strength and durability of foundations and structures like buildings, bridges, dams, etc. |
| Cementitious Fixing | Cementitious fixing is a process in which a cement-based grout is pumped under pressure to fill forms, voids, and cracks. It can be used in several settings, including bridges, marine applications, dams, and rock anchors. |
| Commercial Construction | Commercial construction comprises new construction of warehouses, malls, shops, offices, hotels, restaurants, cinemas, theatres, etc. |
| Concrete Admixtures | Concrete admixtures comprise water reducers, air entrainers, retarders, accelerators, superplasticizers, etc., added to concrete before or during mixing to modify its properties. |
| Concrete Protective Coatings | To provide specific protection, such as anti-carbonation or chemical resistance, a film-forming protective coat can be applied on the surface. Depending on the applications, different resins like epoxy, polyurethane, and acrylic can be used for concrete protective coatings. |
| Curing Compounds | Curing compounds are used to cure the surface of concrete structures, including columns, beams, slabs, and others. These curing compounds keep the moisture inside the concrete to give maximum strength and durability. |
| Epoxy | Epoxy is known for its strong adhesive qualities, making it a versatile product in many industries. It resists heat and chemical applications, making it an ideal product for anyone needing a stronghold under pressure. It is widely used in adhesives, electrical and electronics, paints, etc. |
| Fiber Wrapping Systems | Fiber Wrapping Systems are a part of construction repair and rehabilitation chemicals. It involves the strengthening of existing structures by wrapping structural members like beams and columns with glass or carbon fiber sheets. |
| Flooring Resins | Flooring resins are synthetic materials applied to floors to enhance their appearance, increase their resistance to wear and tear or provide protection from chemicals, moisture, and stains. Depending on the desired properties and the specific application, flooring resins are available in distinct types, such as epoxy, polyurethane, and acrylic. |
| High-Range Water Reducer (Super Plasticizer) | High-range water reducers are a type of concrete admixture that provides enhanced and improved properties when added to concrete. These are also called superplasticizers and are used to decrease the water-to-cement ratio in concrete. |
| Hot Melt Adhesives | Hot-melt adhesives are thermoplastic bonding materials applied as melts that achieve a solid state and resultant strength on cooling. They are commonly used for packaging, coatings, sanitary products, and tapes. |
| Industrial and Institutional Construction | Industrial and institutional construction includes new construction of hospitals, schools, manufacturing units, energy and power plants, etc. |
| Infrastructure Construction | Infrastructure construction includes new construction of railways, roads, seaways, airports, bridges, highways, etc. |
| Injection Grouting | The process of injecting grout into open joints, cracks, voids, or honeycombs in concrete or masonry structural members is known as injection grouting. It offers several benefits, such as strengthening a structure and preventing water infiltration. |
| Liquid-Applied Waterproofing Membranes | Liquid-Applied membrane is a monolithic, fully bonded, liquid-based coating suitable for many waterproofing applications. The coating cures to form a rubber-like elastomeric waterproof membrane and may be applied over many substrates, including asphalt, bitumen, and concrete. |
| Micro-concrete Mortars | Micro-concrete mortar is made up of cement, water-based resin, additives, mineral pigments, and polymers and can be applied on both horizontal and vertical surfaces. It can be used to refurbish residential complexes, commercial spaces, etc. |
| Modified Mortars | Modified Mortars include Portland cement and sand along with latex/polymer additives. The additives increase adhesion, strength, and shock resistance while also reducing water absorption. |
| Mold Release Agents | Mold release agents are sprayed or coated on the surface of molds to prevent a substrate from bonding to a molding surface. Several types of mold release agents, including silicone, lubricant, wax, fluorocarbons, and others, are used based on the type of substrates, including metals, steel, wood, rubber, plastic, and others. |
| Polyaspartic | Polyaspartic is a subset of polyurea. Polyaspartic floor coatings are typically two-part systems that consist of a resin and a catalyst to ease the curing process. It offers high durability and can withstand harsh environments. |
| Polyurethane | Polyurethane is a plastic material that exists in various forms. It can be tailored to be either rigid or flexible and is the material of choice for a broad range of end-user applications, such as adhesives, coatings, building insulation, etc. |
| Reactive Adhesives | A reactive adhesive is made of monomers that react in the adhesive curing process and do not evaporate from the film during use. Instead, these volatile components become chemically incorporated into the adhesive. |
| Rebar Protectors | In concrete structures, rebar is one of the important components, and its deterioration due to corrosion is a major issue that affects the safety, durability, and life span of buildings and structures. For this reason, rebar protectors are used to protect against degrading effects, especially in infrastructure and industrial construction. |
| Repair and Rehabilitation Chemicals | Repair and Rehabilitation Chemicals include repair mortars, injection grouting materials, fiber wrapping systems, micro-concrete mortars, etc., used to repair and restore existing buildings and structures. |
| Residential Construction | Residential construction involves constructing new houses or spaces like condominiums, villas, and landed homes. |
| Resin Fixing | The process of using resins like epoxy and polyurethane for grouting applications is called resin fixing. Resin fixing offers several advantages, such as high compressive and tensile strength, negligible shrinkage, and greater chemical resistance compared to cementitious fixing. |
| Retarder | Retarders are admixtures used to slow down the setting time of concrete. These are usually added with a dosage rate of around 0.2% -0.6% by weight of cement. These admixtures slow down hydration or lower the rate at which water penetrates the cement particles by making concrete workable for a long time. |
| Sealants | A sealant is a viscous material that has little or no flow qualities, which causes it to remain on surfaces where they are applied. Sealants can also be thinner, enabling penetration to a certain substance through capillary action. |
| Sheet Waterproofing Membranes | Sheet membrane systems are reliable and durable thermoplastic waterproofing solutions that are used for waterproofing applications even in the most demanding below-ground structures, including those exposed to highly aggressive ground conditions and stress. |
| Shrinkage Reducing Admixture | Shrinkage-reducing admixtures are used to reduce concrete shrinkage, whether from drying or self-desiccation. |
| Silicone | Silicone is a polymer that contains silicon combined with carbon, hydrogen, oxygen, and, in some cases, other elements. It is an inert synthetic compound that comes in various forms, such as oil, rubber, and resin. Due to its heat-resistant properties, it finds applications in sealants, adhesives, lubricants, etc. |
| Solvent-borne Adhesives | Solvent-borne adhesives are mixtures of solvents and thermoplastic or slightly cross-linked polymers such as polychloroprene, polyurethane, acrylic, silicone, and natural and synthetic rubbers. |
| Surface Treatment Chemicals | Surface treatment chemicals are chemicals used to treat concrete surfaces, including roofs, vertical surfaces, and others. They act as curing compounds, demolding agents, rust removers, and others. They are cost-effective and can be used on roadways, pavements, parking lots, and others. |
| Viscosity Modifier | Viscosity Modifiers are concrete admixtures used to change various properties of admixtures, including viscosity, workability, cohesiveness, and others. These are usually added with a dosage of around 0.01% to 0.1% by weight of cement. |
| Water Reducer | Water reducers, also called plasticizers, are a type of admixture used to decrease the water-to-cement ratio in the concrete, thereby increasing the durability and strength of concrete. Various water reducers include refined lignosulfonates, gluconates, hydroxycarboxylic acids, sugar acids, and others. |
| Water-borne Adhesives | Water-borne adhesives use water as a carrier or diluting medium to disperse resin. They are set by allowing the water to evaporate or be absorbed by the substrate. These adhesives are compounded with water as a dilutant rather than a volatile organic solvent. |
| Waterproofing Chemicals | Waterproofing chemicals are designed to protect a surface from the perils of leakage. A waterproofing chemical is a protective coating or primer applied to a structure's roof, retaining walls, or basement. |
| Waterproofing Membranes | Waterproofing membranes are liquid-applied or self-adhering layers of water-tight materials that prevent water from penetrating or damaging a structure when applied to roofs, walls, foundations, basements, bathrooms, and other areas exposed to moisture or water. |


Research Methodology
Mordor Intelligence follows a four-step methodology in all our reports.
- Step-1: Identify Key Variables: The quantifiable key variables (industry and extraneous) pertaining to the specific product segment and country are selected from a group of relevant variables & factors based on desk research & literature review; along with primary expert inputs. These variables are further confirmed through regression modeling (wherever required).
- Step-2: Build a Market Model: In order to build a robust forecasting methodology, the variables and factors identified in Step-1 are tested against available historical market numbers. Through an iterative process, the variables required for market forecast are set and the model is built on the basis of these variables.
- Step-3: Validate and Finalize: In this important step, all market numbers, variables and analyst calls are validated through an extensive network of primary research experts from the market studied. The respondents are selected across levels and functions to generate a holistic picture of the market studied.
- Step-4: Research Outputs: Syndicated Reports, Custom Consulting Assignments, Databases & Subscription Platforms


