
Asia-Pacific Data Center Optical Connectivity Market Size and Share
Market Overview
| Study Period | 2021 - 2032 |
|---|---|
| Base Year Market Size (2026) | USD 11.77 Billion |
| Historical Data Period | 2021 - 2025 |
| Market Size (2027) | USD 13.98 Billion |
| Market Size (2032) | USD 32.78 Billion |
| Market Concentration | Medium |
Major Players *Disclaimer: Major Players sorted in no particular order Image © Mordor Intelligence. Reuse requires attribution under CC BY 4.0. | |
Asia-Pacific Data Center Optical Connectivity Market Analysis by Mordor Intelligence
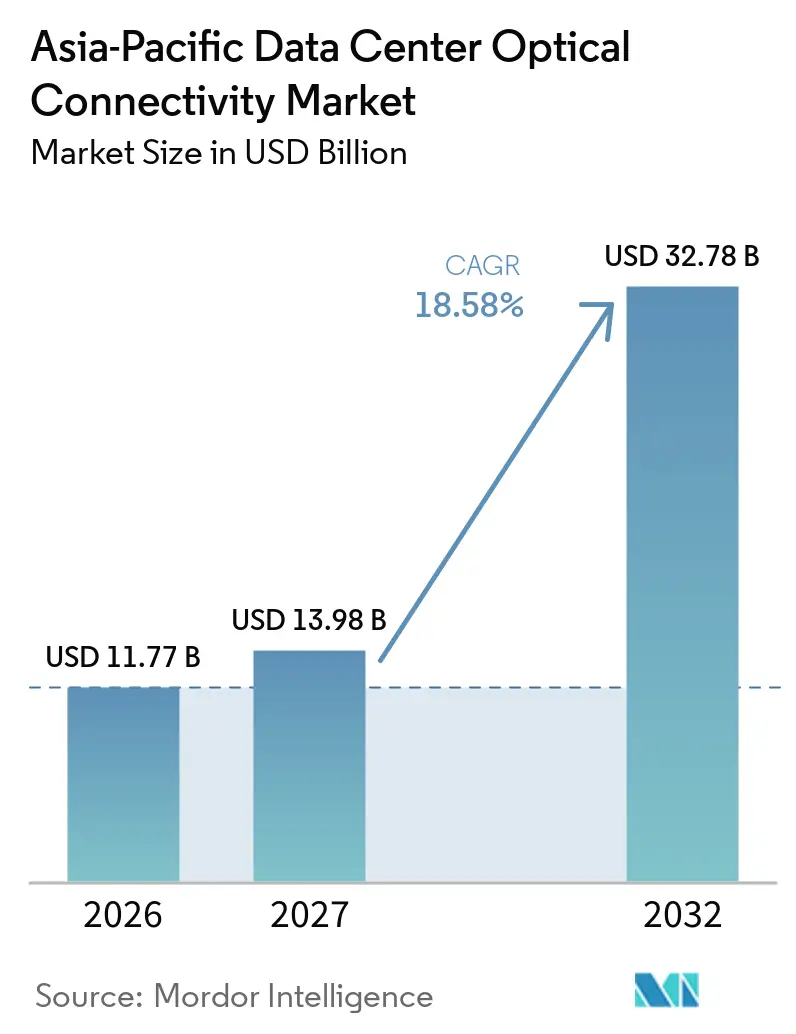
The Asia-Pacific Data Center Optical Connectivity Market size is expected to increase from USD 11.77 billion in 2026 to USD 13.98 billion in 2027 and reach USD 32.78 billion by 2032, growing at a CAGR of 18.58% over 2027-2032.
Demand is shifting because generative AI clusters need far more bandwidth than electrical interconnects can provide within practical power limits. This shift makes optical connectivity a design requirement rather than a network add-on for large computing environments. Vendors are competing through lower-power optical engines, optical switching, and deeper control over component supply. The Asia-Pacific data center optical connectivity market also benefits from data center construction, national digital infrastructure programs, and the rising use of distributed AI computing. Cost, heat, qualification requirements, and component availability will determine how quickly smaller operators can adopt the newest link speeds.
Key Report Takeaways
- By product type, optical transceivers held 43.67% of revenue in 2026, while optical circuit switches are projected to expand at a 31.12% CAGR through 2032.
- By connectivity architecture, conventional pluggable optics held 77.32% of revenue in 2026, while co-packaged optics are projected to expand at a 32.29% CAGR through 2032.
- By data rate, the up-to-400 Gbps segment held 36.28% of revenue in 2026, while links above 1.6 Tbps are projected to expand at a 35.17% CAGR through 2032.
- By reach, the 100-500 meter segment held 35.17% of revenue in 2026, while the up-to-3-meter segment is projected to expand at a 29.61% CAGR through 2032.
- By application, switch-to-switch held 29.83% of revenue in 2026, while GPU-to-GPU interconnect is projected to expand at a 31.14% CAGR through 2032.
- By network architecture, scale-out held 71.36% of revenue in 2026, while scale-up is projected to expand at a 31.79% CAGR through 2032.
- By data center type, hyperscale facilities held 59.81% of revenue in 2026 and are projected to expand at a 30.41% CAGR through 2032.
- By country, China held 35.94% of revenue in 2026, while India is projected to expand at a 31.07% CAGR through 2032.
Note: Market numbers in this report are based on Mordor Intelligence's proprietary estimation framework, which combines nine months of actuals with Q4 projections for base year 2026.
Market Trends and Insights
Drivers Impact Analysis of Asia-Pacific Data Center Optical Connectivity Market*
| Driver | (~) % Impact on CAGR Forecast | Geographic Relevance | Impact Timeline |
|---|---|---|---|
| Generative AI and GPU Cluster Bandwidth Intensification | +5.2% | Global, concentrated in China, India, Japan, and South Korea | Short term (≤ 2 years) |
| Hyperscale Data Center Capacity Expansion Across Asia-Pacific | +4.0% | China, India, Southeast Asia | Short term (≤ 2 years) |
| National Digital Infrastructure and Sovereign AI Programs | +3.0% | China, India, Japan, South Korea | Medium term (2-4 years) |
| Migration From Copper to Higher-Density Optical Links | +2.6% | Global | Medium term (2-4 years) |
| Expansion of East and Southeast Asian AI Interconnection Hubs | +1.8% | Southeast Asia, East Asia | Long term (≥ 4 years) |
| Regional Photonics Manufacturing and Foundry Ecosystem Depth | +1.3% | China, Yangtze River Delta and Wuhan Optics Valley, Southeast Asia | Long term (≥ 4 years) |
| Source: Mordor Intelligence | |||
Generative AI and GPU Cluster Bandwidth Intensification
Training and inference across large GPU clusters have made optical interconnects a direct factor in computing performance. AI systems now require bandwidth planning at the same stage as accelerator, memory, and switching decisions. NVIDIA stated that its SN6800 switch provides 409.6 Tbps across 512 ports of 800 Gbps and uses integrated co-packaged silicon photonics.[1] This approach joins optical engines and switch ASICs within a single system design. Procurement teams are therefore placing more weight on bandwidth delivered per watt across the complete fabric. Research published in IEEE Transactions on Networking found that scheduling LLM training across optically interconnected GPU clusters can reduce training iteration time by up to 34.32%.
Hyperscale Data Center Capacity Expansion Across Asia-Pacific
New hyperscale capacity creates recurring demand for optical links at server, rack, aggregation, spine, and inter-data-center layers. The Asia-Pacific data center optical connectivity market benefits because each new high-density facility requires a substantial number of high-speed ports. Construction pipelines also encourage operators to secure module supply earlier in the build cycle. This favors vendors that can meet volume, qualification, and delivery requirements at the same time. It also raises the value of long-term supply agreements for transceivers, cable assemblies, and optical switching equipment. Neocloud providers add another customer group because they deploy AI capacity with connectivity requirements closer to those of hyperscalers.
National Digital Infrastructure and Sovereign AI Programs
Public programs for digital infrastructure create a demand path that is less dependent on the normal cloud spending cycle. India has classified data centers as strategic national infrastructure and provides conditional tax incentives that can extend for up to 20 years. Japan demonstrated distributed AI computing over a 1,000-km Tokyo-Fukuoka optical link using NTT's IOWN All-Photonics Network in 2026. The demonstration shows how longer optical links can connect remote computing resources for AI workloads. China and South Korea are also advancing national AI and digital infrastructure programs that require higher-capacity data links. These programs support investment in wavelength-division multiplexing and inter-data-center connectivity where legacy metro networks are insufficient.
Migration From Copper to Higher-Density Optical Links
Copper active electrical cables face more stringent signal-integrity limits as data rates increase. An IEEE 802 presentation reported that copper active electrical cables at 800G are generally limited to 1-2 meters. The same material showed that 800G optical modules can support reaches up to 500 meters at 18W. This gap pushes optical connections beyond rack-internal uses and into top-of-rack and aggregation designs. New AI clusters are increasingly designed around optical links from the start. The Asia-Pacific data center optical connectivity market gains as more new facilities adopt 800G and higher optical standards.
Restraints Impact Analysis of Asia-Pacific Data Center Optical Connectivity Market*
| Restraint | (~) % Impact on CAGR Forecast | Geographic Relevance | Impact Timeline |
|---|---|---|---|
| High Capex and Qualification Costs for 800G and 1.6T Optics | -2.0% | Global | Short term (≤ 2 years) |
| Thermal Management and Power Density Constraints | -1.3% | Global | Medium term (2-4 years) |
| Interoperability and Standards Fragmentation | -0.9% | Global | Medium term (2-4 years) |
| Regional Supply-Chain Concentration and Export-Control Exposure | -1.1% | China, Southeast Asia | Medium term (2-4 years) |
| Source: Mordor Intelligence | |||
High Capex and Qualification Costs for 800G and 1.6T Optics
The cost gap between module generations remains a major barrier for operators without hyperscale purchasing power. The supplied pricing data placed 1.6T modules at USD 1,400-USD 1,500 per unit in 2026, compared with USD 400 for mature 800G products. Cost-per-bit parity depends on 1.6T prices moving toward USD 800 during 2027-2028. Qualification work adds further expense because operators need interoperability testing, thermal validation, and system-level burn-in. These processes can take 6-12 months before a new module is approved for deployment. The result is a two-speed adoption pattern, with larger cloud operators deploying 800G and 1.6T fabrics while many colocation tenants remain at 400G or lower.
Thermal Management and Power Density Constraints
Power density is testing the limits of conventional air-cooled optical architectures. The supplied technical data indicated that a 1.6T transceiver can require 24W, compared with 12W for a 400G unit. Research in Frontiers of Optoelectronics showed that co-packaged optics can reduce 1.6T link power from 30W to 9W, although cooling a 750W switch chip requires liquid-cooled cold plates.[2] The IPEC liquid-cooling optics paper specifies a cooling capacity of up to 400W per XPO module. Such designs require liquid-distribution infrastructure that is not yet common across every emerging Asia-Pacific facility. This requirement can slow deployment even when an operator sees a clear performance benefit from a higher-speed optical fabric.
*Our forecasts treat driver/restraint impacts as directional, not additive. The impact forecasts reflect baseline growth, mix effects, and variable interactions.
Asia-Pacific Data Center Optical Connectivity Market Segment Analysis
By Product Type:
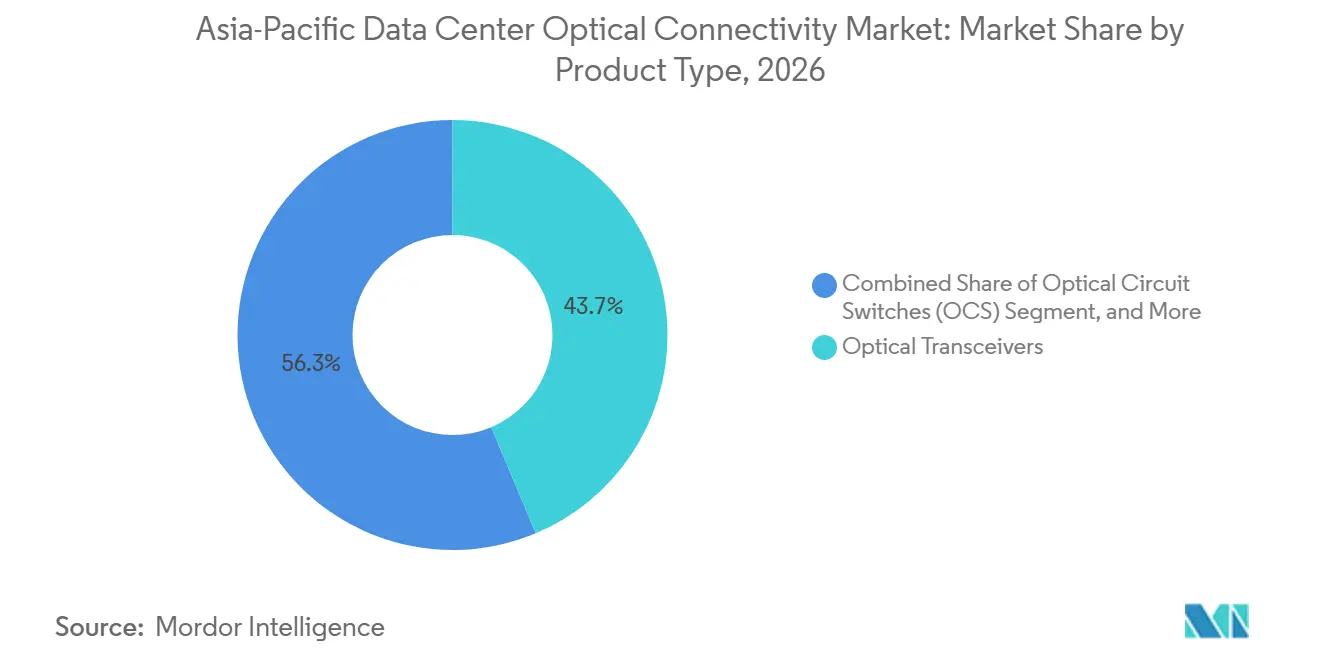
Transceivers Lead Revenue While Circuit Switches AccelerateOptical transceivers accounted for 43.67% of the Asia-Pacific data center optical connectivity market share in 2026. Their position reflects mature costs, broad interoperability, and use across many data rates and reach requirements. They remain the basic interface between switch ports, servers, storage systems, and optical fibers. Active optical cables serve fixed-length, rack-scale connections where a factory-integrated cable simplifies installation. Fiber-optic cable assemblies support structured connectivity between switching layers and equipment rows. Optical connectors and interconnect assemblies also gain importance because higher-speed systems require more fibers and parallel lanes. Optical circuit switches are projected to expand at a 31.12% CAGR through 2032. Their appeal comes from reconfigurable connections and lower power use in AI spine fabrics.
An optical circuit switch can create direct paths between large groups of endpoints without processing traffic through conventional packet-switch layers. This function is useful when AI jobs create changing communication patterns across GPU clusters. The Open Compute Project reported that a 4,096 by 4,096 nonblocking optical circuit switch demonstrated 819.2 Tbps at OFC 2026. Its white paper also cited a 17.5% reduction in LLM communication time and at least 20% lower optical-port requirements than conventional spine fabrics. Lumentum offers dedicated optical circuit switch products for hyperscale AI data centers. The Asia-Pacific data center optical connectivity industry therefore has demand for established transceivers as well as newer optical-switch designs. This mix allows existing component suppliers and specialized switching vendors to address different parts of the data center fabric.

By Connectivity Architecture:
Pluggable Optics Lead as Co-Packaged Optics Enters Hyperscale DeploymentsConventional pluggable optics held 77.32% of revenue in 2026, making them the leading connectivity architecture. Their installed base, established supply chain, and multi-vendor interoperability support continued use in enterprise, colocation, and cloud facilities. Operators can replace pluggable modules without changing an entire switch platform. This flexibility remains important while data rates, thermal designs, and interface standards continue to evolve. Linear pluggable optics remove the DSP retimer and can lower per-link power by 30-40%. Near-packaged optics move the optical engine close to the switch ASIC and reduce electrical path lengths. These approaches provide intermediate steps between familiar pluggable modules and full co-packaged designs.
Co-packaged optics are projected to expand at a 32.29% CAGR through 2032, the highest rate within this architecture group. Broadcom began shipping its Tomahawk 6 Davisson switch in October 2025, describing it as a 102.4 Tbps Ethernet switch with co-packaged optics.[3] NVIDIA reported that co-packaged silicon photonics supports a more power-efficient AI fabric design. Co-packaged designs reduce the electrical distance between compute silicon and optical engines. This can lower power consumption but makes serviceability, heat removal, and supplier qualification more demanding. The Asia-Pacific data center optical connectivity market will retain a large pluggable base while these more integrated options gain adoption in leading AI clusters. The Asia-Pacific data center optical connectivity industry has a clear incentive to support both architectures during the transition.
By Data Rate:
400G Remains Established While Terabit-Speed Links ScaleThe up-to-400 Gbps segment accounted for 36.28% of revenue in 2026. It remains important for enterprise refresh projects, colocation facilities, and deployments that have not shifted to AI-optimized fabrics. Existing 400G equipment also provides a known operating model for many operators. The 800G tier has entered volume deployment for large AI environments. It provides a step up in bandwidth without requiring every site to adopt a 1.6T or 3.2T platform immediately. This staged approach allows network operators to align module adoption with switch refreshes and cooling upgrades. The Asia-Pacific data center optical connectivity market continues to include demand from both established 400G systems and newer high-bandwidth fabrics.
Links above 1.6 Tbps are projected to expand at a 35.17% CAGR through 2032. AI back-end fabrics are being designed for 3.2T-ready infrastructure even while physical module standards are still developing. Broadcom released the BCM83640 in March 2026 and described it as the first 3nm 400G-per-lane optical DSP. This component provides a foundation for 1.6T module designs and future 3.2T products. Higher data rates reduce the number of connections needed for a given fabric capacity. They also increase demands on heat control, fiber management, testing, and end-to-end system interoperability. The data-rate transition is consequently led by operators that can manage the full cost and engineering requirements of high-density AI networks.
By Reach:
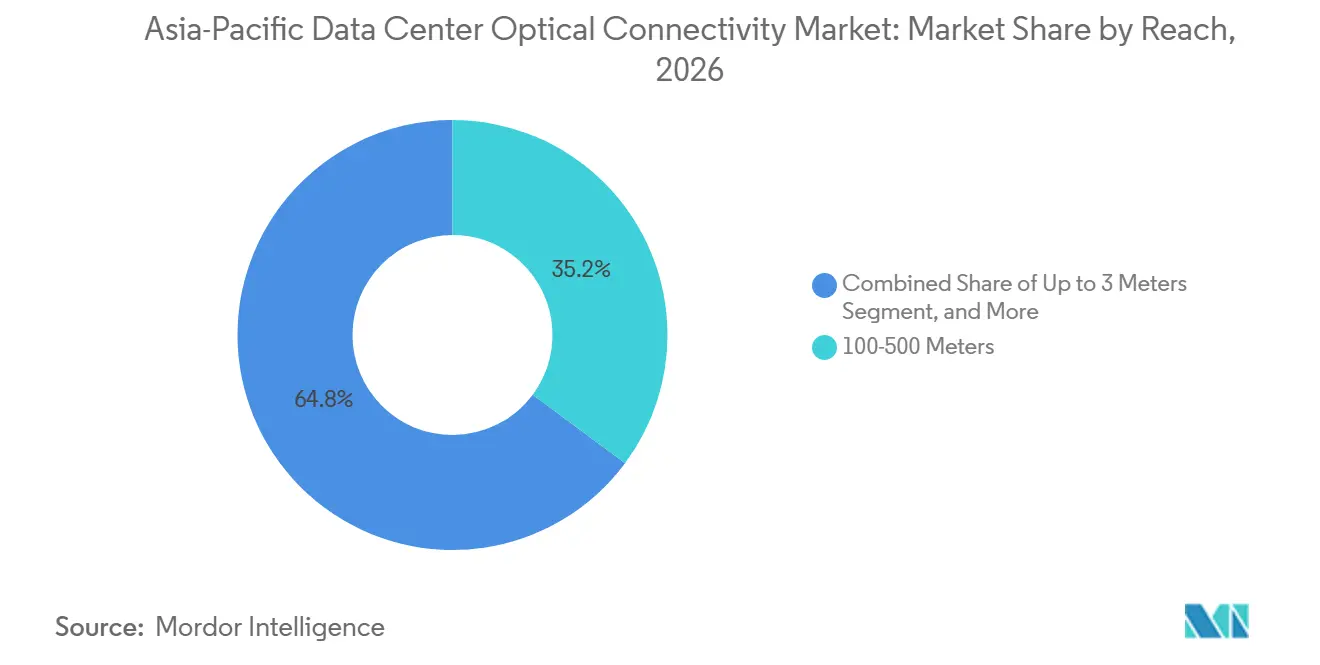
Midrange Links Lead While Ultra-Short Optical Connections Gain ScaleThe 100-500 meter band held 35.17% of revenue in 2026. This range connects top-of-rack switches with aggregation and spine layers in many data center layouts. It is a practical fit for connections that cross rows or zones without extending into long-haul transport. The segment supports established leaf-spine designs used by cloud, colocation, and enterprise operators. The 7-100 meter range addresses end-of-row connectivity and other short data hall links. The 3-7 meter range is used in dense clusters and direct-attach co-packaged configurations. Links above 500 meters serve inter-data-center uses where coherent optical technologies are more relevant.
The up-to-3-meter segment is projected to expand at a 29.61% CAGR through 2032. This growth is linked to co-packaged and near-packaged designs that move optical conversion into or close to the switch chassis. Such designs can replace conventional front-panel pluggables with integrated, short-fiber optical engines. An article in npj Advanced Photonics noted that chip-to-chip optical interposers for sub-1-meter links are advancing in manufacturability. These technologies can serve scale-up systems where GPUs need direct, high-bandwidth paths within compact equipment arrangements. Their adoption depends on packaging capability, cooling, and repair methods. The Asia-Pacific data center optical connectivity market will therefore require both midrange connectivity for broad data center fabrics and ultra-short links for tightly integrated AI systems.
By Application:
Switch Fabrics Lead While GPU-to-GPU Connectivity SurgesSwitch-to-switch applications held 29.83% of revenue in 2026. This position reflects the continued use of leaf-spine and fat-tree topologies across data center networks. In these designs, optical links carry traffic among leaf switches, spine switches, and aggregation layers. Every expansion of rack capacity can add more inter-switch ports. Server-to-switch connectivity is another major source of optical demand. GPU-to-switch links also rise as AI clusters add accelerator nodes. Storage connectivity and data center interconnect serve more specialized needs, including links between facilities and storage platforms.
GPU-to-GPU interconnect is projected to expand at a 31.14% CAGR through 2032. Scale-up systems use high-bandwidth connections to link accelerators more directly within and across rack boundaries. Research presented at ACM SIGCOMM 2026 described an integrated optical-electrical interconnect for scale-up networks. As AI model parameters increase, communications among GPUs become a larger part of training time. Direct optical paths can reduce bottlenecks when workloads require frequent all-to-all exchanges. This makes optical connectivity central to the practical performance of multi-GPU systems. The Asia-Pacific data center optical connectivity market is supported by the coexistence of broad switch fabrics and high-intensity GPU-to-GPU links.
By Network Architecture:
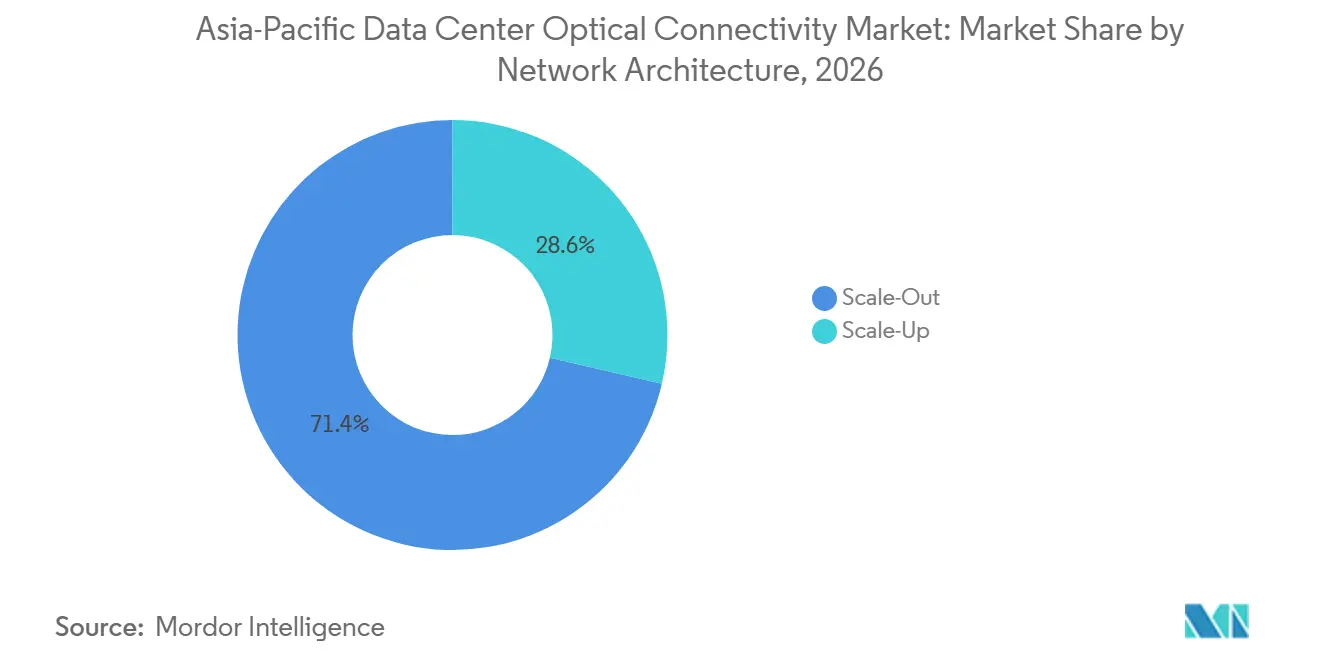
Scale-Out Leads While Scale-Up Gains Faster AdoptionScale-out architecture held 71.36% of revenue in 2026. It supports multi-rack AI training clusters that use Ethernet connections across large numbers of GPU servers. This architecture is widely used because it can connect thousands of servers using established networking practices. Many inference workloads also operate through Ethernet-based scale-out fabrics. These environments consume large volumes of pluggable transceivers at 400G, 800G, and emerging 1.6T speeds. Scale-out designs remain relevant even as more specialized GPU interconnect systems are introduced. The Asia-Pacific data center optical connectivity market continues to rely on this broad deployment base.
Scale-up architecture is projected to expand at a 31.79% CAGR through 2032. It uses high-bandwidth interconnects to build GPU superclusters with more direct communication among accelerators. NVIDIA's SN6800 example, with 409.6 Tbps across 512 ports of 800 Gbps, illustrates the optical intensity of this approach. Large AI facilities can use scale-up fabrics within superpods and scale-out Ethernet between those units. This arrangement increases the optical content required for each GPU because it combines two network layers. Scale-up deployments are newer than scale-out systems, which explains their faster projected expansion. Both architectures will remain necessary because they solve different connectivity needs within the same AI infrastructure.
By Data Center Type:
Hyperscale Facilities Lead Revenue and ExpansionHyperscale facilities accounted for 59.81% of revenue in 2026 and are projected to expand at a 30.41% CAGR through 2032. They concentrate AI cluster investment within operators that can place large orders for network equipment and optical components. Their infrastructure decisions influence volumes for transceivers, optical switches, cable assemblies, and integrated optical systems across Asia-Pacific supply chains. Hyperscale operators also tend to move earlier to 800G and 1.6T platforms. Their installations provide reference deployments for component makers and network equipment suppliers. This concentration explains why data center type is important to purchasing patterns in the Asia-Pacific data center optical connectivity market. Neocloud providers extend this demand beyond the traditional group of global cloud platforms.
Colocation data centers form the second-largest type because cloud tenants and neocloud operators need high-speed links for AI workloads. These sites can deploy 800G or higher standards where tenants require accelerated computing capacity. Enterprise data centers serve captive, on-premises inference and related workloads. Their optical adoption is slower, but it benefits from the transition toward GPU-accelerated servers. Edge and micro data centers remain smaller in the current demand mix. They may need more connectivity as 5G networks support low-latency AI inference closer to users. Different facility types therefore create different adoption schedules, but each contributes to the Asia-Pacific data center optical connectivity industry.
Geography Analysis
China Data Center Optical Connectivity Market
China held 35.94% of the Asia-Pacific data center optical connectivity market share in 2026. The country has a large optical manufacturing base, with clusters in the Yangtze River Delta, Pearl River Delta, and Wuhan Optics Valley. This ecosystem supports component development, module assembly, and related photonics work. Xinhua reported that Suzhou High-Tech Zone had more than 350 photonics enterprises and an output value of above CNY 85 billion (USD 12.70 billion) in 2026.[4] Domestic cloud platforms, including Alibaba, Baidu, ByteDance, and Tencent, are expanding AI infrastructure. Their activity gives local suppliers a substantial demand base. It also supports continued investment in optical manufacturing and system integration.
South and East Asia Data Center Optical Connectivity Market
India is projected to expand at a 31.07% CAGR during 2027-2032. Data center policy support and new AI infrastructure projects are attracting global and domestic operators. Reliance Industries and Meta announced a 168 MW AI data center in Jamnagar, Gujarat, in June 2026. Google, Adani Group, and Airtel broke ground on a data center campus in Visakhapatnam in 2026. Japan is advancing photonic networking through NTT's IOWN All-Photonics Network and SoftBank's All-Optical Network. SoftBank stated that the first Osaka phase was completed in October 2025. South Korea is also developing regional AI connectivity capability through optical network and component activity.
ASEAN, Taiwan and Oceania Data Center Optical Connectivity Market
Southeast Asia is becoming an important demand cluster as cloud and AI facilities are built across Singapore, Malaysia, Thailand, and neighboring locations. New facilities need short-reach GPU-to-switch links inside AI clusters and longer coherent connections between campuses. Microsoft announced an investment of more than USD 1 billion in Thailand through 2028. The region also benefits from cross-border subsea connectivity. The SJC2 submarine cable entered commercial operation across 10 Asia-Pacific locations in July 2025. Australia, Taiwan, and other countries add demand from enterprise cloud, research computing, and semiconductor-related photonics development. Taiwan's semiconductor base also supports interest in optical-engine development and advanced packaging.
Competitive Landscape
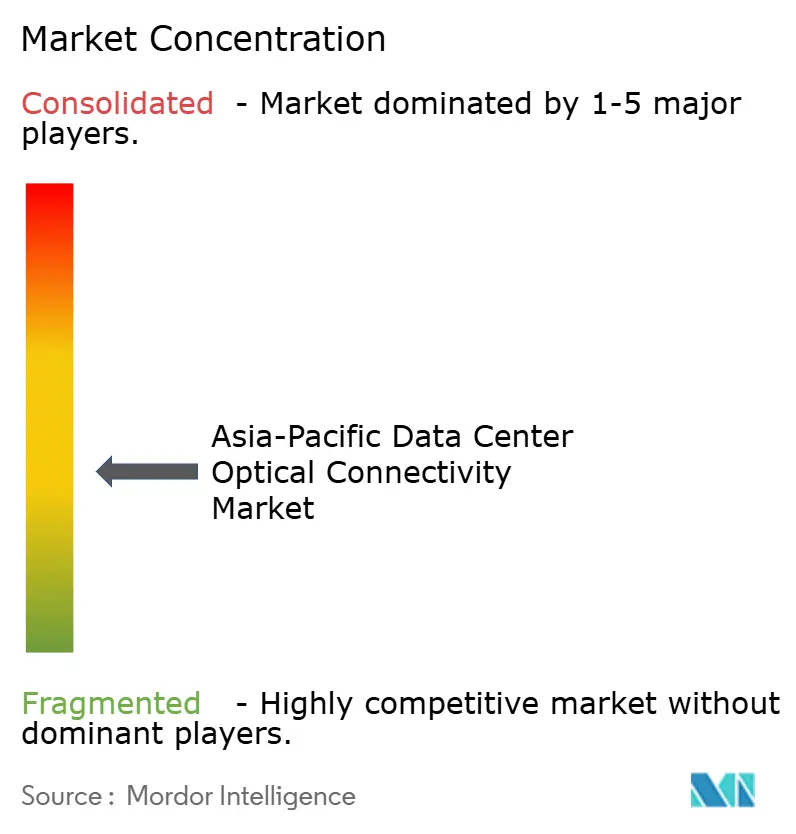
The Asia-Pacific data center optical connectivity market is moderately fragmented in modules and components, while switch ASICs and integrated photonics have fewer leading platforms. Merchant module suppliers compete on production scale, delivery capability, qualification, and price. Component providers compete through optical DSPs, lasers, packaging, and silicon photonics expertise. Broadcom delivered the BCM83640, its 400G-per-lane optical DSP, in March 2026. This product supports the transition to 1.6T modules and future 3.2T systems. NVIDIA also announced a strategic partnership with Lumentum in March 2026 to develop advanced optics technology. These moves show how leading computing and semiconductor platforms are working more closely with optical suppliers.
White-space opportunities remain in optical circuit switching, near-packaged optics, and liquid-cooled module formats. These technologies address energy use, communication delays, and power density in AI data centers. Accelink stated that it completed full system verification of a 3.2T silicon-photonics near-packaged optics module at OFC 2026. The development positions suppliers to prepare reference designs before wider commercial adoption. The Asia-Pacific data center optical connectivity market may see competition shift toward suppliers that can prove performance within complete, liquid-cooled, high-density systems.
The supplier base also includes companies focused on transceivers, lasers, cable assemblies, switching, and optical fiber. This range of capabilities keeps the market from being controlled by a single company or a small module-only group. However, leading semiconductor, cloud, and network platforms can influence standards and buying requirements. Broadcom's 102.4 Tbps co-packaged-optics switch and NVIDIA's AI photonics systems are examples of platforms that shape supplier roadmaps. The Asia-Pacific data center optical connectivity market therefore combines broad component competition with concentrated influence at the highest system level. Suppliers in the Asia-Pacific data center optical connectivity market must balance compatibility with leading platforms against the need to serve multi-vendor deployments.
Asia-Pacific Data Center Optical Connectivity Industry Leaders
-
NVIDIA Corporation
-
Broadcom Inc.
-
Coherent Corp.
-
Lumentum Holdings Inc.
-
Innolight Technology (Suzhou) Ltd.
- *Disclaimer: Major Players sorted in no particular order
Asia-Pacific Data Center Optical Connectivity Market Companies Covered in this Report
- Broadcom Inc.
- NVIDIA Corporation
- Coherent Corp.
- Lumentum Holdings Inc.
- Innolight Technology (Suzhou) Ltd.
- Eoptolink Technology Inc., Ltd.
- Accelink Technologies Co., Ltd.
- Cisco Systems, Inc.
- Marvell Technology, Inc.
- Intel Corporation
- Sumitomo Electric Industries, Ltd.
- Fujitsu Optical Components Limited
- Hisense Broadband Multimedia Technologies Co., Ltd.
- Huawei Technologies Co., Ltd.
- Amphenol Corporation
- TE Connectivity Ltd.
- Samtec, Inc.
- Corning Incorporated
- Molex, LLC
- Ayar Labs, Inc.
- Ranovus Inc.
- Furukawa Electric Co., Ltd.
- Ciena Corporation
- ZTE Corporation
Recent Industry Developments in Asia-Pacific Data Center Optical Connectivity Market
- June 2026: Reliance Industries and Meta Platforms announced a 168 MW AI data center in Jamnagar, Gujarat, with an option to scale, deepening India's role in Meta's global AI infrastructure strategy.
- March 2026: Accelink achieved full system verification of the first 3.2T Silicon Photonics NPO module with a leading domestic cloud service provider at OFC 2026, the first optical module vendor to reach this integration milestone.
- June 2025: ARTERIA Networks, Microsoft, AWS, and Dreamline formed the JAKO consortium for a 260-km Japan-Korea submarine optical cable connecting Fukuoka and Busan, with LS Cable as supplier and commercial operation targeted for Q3 2027.
- October 2025: SoftBank and Cisco completed the first phase of Japan's All Optical Network in Osaka, achieving 90% energy reduction versus conventional metro configurations, with nationwide metro rollout targeted for completion by 2027.
Asia-Pacific Data Center Optical Connectivity Market Report Scope
The Asia-Pacific data center optical connectivity refers to high-speed fiber-optic components, cables, and transceivers engineered to facilitate high-bandwidth, low-latency data transmission within and between data centers across the region.
The Asia-Pacific Data Center Optical Connectivity Market Report is Segmented by Product Type (Optical Transceivers, Active Optical Cables, Fiber-Optic Cable Assemblies, Optical Connectors, Optical Interconnect Assemblies, and Optical Circuit Switches), Connectivity Architecture (Conventional Pluggable Optics, Linear Pluggable Optics (LPO/LRO), Near-Packaged Optics (NPO), and Co-Packaged Optics (CPO)), Data Rate (Up to 400 Gbps, 800 Gbps, 1.6 Tbps, and Above 1.6 Tbps), Reach (Up to 3 Meters, 3-5 Meters, 5-7 Meters, 7-100 Meters, 100-500 Meters, and Above 500 Meters), Application (GPU-to-Switch, GPU-to-GPU, Switch-to-Switch, Server-to-Switch, Storage Connectivity, and Data Center Interconnect), Network Architecture (Scale-Up and Scale-Out), Data Center Type (Hyperscale, Colocation, Enterprise, and Edge and Micro Data Centers), and Country (China, India, Japan, Indonesia, Australia, Singapore, Malaysia, Vietnam, Thailand, Taiwan, Philippines, and Rest of Asia-Pacific). The Market Forecasts are Provided in Terms of Value (USD).
Segmentation Overview
| Optical Transceivers |
| Active Optical Cables |
| Fiber-Optic Cable Assemblies |
| Optical Connectors |
| Optical Interconnect Assemblies |
| Optical Circuit Switches |
| Conventional Pluggable Optics |
| Linear Pluggable Optics (LPO/LRO) |
| Near-Packaged Optics (NPO) |
| Co-Packaged Optics (CPO) |
| Up to 400 Gbps |
| 800 Gbps |
| 1.6 Tbps |
| Above 1.6 Tbps |
| Up to 3 Meters |
| 3-5 Meters |
| 5-7 Meters |
| 7-100 Meters |
| 100-500 Meters |
| Above 500 Meters |
| GPU-to-Switch |
| GPU-to-GPU |
| Switch-to-Switch |
| Server-to-Switch |
| Storage Connectivity |
| Data Center Interconnect |
| Scale-Up |
| Scale-Out |
| Hyperscale |
| Colocation |
| Enterprise |
| Edge and Micro Data Centers |
| China |
| India |
| Japan |
| Indonesia |
| Australia |
| Singapore |
| Malaysia |
| Vietnam |
| Thailand |
| Taiwan |
| Philippines |
| Rest of Asia-Pacific |
| By Product Type | Optical Transceivers |
| Active Optical Cables | |
| Fiber-Optic Cable Assemblies | |
| Optical Connectors | |
| Optical Interconnect Assemblies | |
| Optical Circuit Switches | |
| By Connectivity Architecture | Conventional Pluggable Optics |
| Linear Pluggable Optics (LPO/LRO) | |
| Near-Packaged Optics (NPO) | |
| Co-Packaged Optics (CPO) | |
| By Data Rate | Up to 400 Gbps |
| 800 Gbps | |
| 1.6 Tbps | |
| Above 1.6 Tbps | |
| By Reach | Up to 3 Meters |
| 3-5 Meters | |
| 5-7 Meters | |
| 7-100 Meters | |
| 100-500 Meters | |
| Above 500 Meters | |
| By Application | GPU-to-Switch |
| GPU-to-GPU | |
| Switch-to-Switch | |
| Server-to-Switch | |
| Storage Connectivity | |
| Data Center Interconnect | |
| By Network Architecture | Scale-Up |
| Scale-Out | |
| By Data Center Type | Hyperscale |
| Colocation | |
| Enterprise | |
| Edge and Micro Data Centers | |
| By Country | China |
| India | |
| Japan | |
| Indonesia | |
| Australia | |
| Singapore | |
| Malaysia | |
| Vietnam | |
| Thailand | |
| Taiwan | |
| Philippines | |
| Rest of Asia-Pacific |
Key Questions Answered in the Report
What is the Asia-Pacific data center optical connectivity market size?
The market was valued at USD 11.77 billion in 2026 and is forecast to reach USD 32.78 billion by 2032, at an 18.58% CAGR during 2027-2032. The forecast reflects higher optical content in AI-oriented data centers, including ports within GPU clusters, switch fabrics, and links between data center facilities.
What is driving optical connectivity demand in Asia-Pacific data centers?
Generative AI clusters require higher bandwidth and better power efficiency, which increases use of optical links in servers, switches, and GPU fabrics. The transition away from copper is also important for links that extend beyond short rack-level distances.
Which product category has the largest revenue position?
Optical transceivers led product revenue with a 43.67% share in 2026, supported by broad compatibility across data center applications. They connect equipment across server, switch, storage, and fiber layers.
Which connectivity architecture is expanding fastest?
Co-packaged optics are projected to expand at a 32.29% CAGR through 2032 because they reduce electrical path lengths and support dense AI fabrics. Their adoption depends on workable cooling, servicing, and multi-vendor qualification practices.
Which country leads regional demand?
China held the largest regional share at 35.94% in 2026, supported by its large photonics ecosystem and domestic AI infrastructure activity. India is the fastest-expanding country because of new data center and AI infrastructure activity, policy support, and new operator commitments.
What constrains adoption of 1.6T optical links?
High module prices, qualification requirements, and higher cooling needs can delay adoption, especially among operators without hyperscale purchasing scale. These factors can keep colocation and enterprise sites on earlier link generations for longer and make facility cooling upgrades necessary before large-scale rollouts can proceed across demanding worldwide AI workloads.