
Market Overview
| Study Period | 2021 - 2031 |
|---|---|
| Forecast Data Period | 2026 - 2031 |
| Historical Data Period | 2021 - 2024 |
| Market Size (2026) | USD 14.23 Billion |
| Market Size (2031) | USD 19.16 Billion |
| Growth Rate (2026 - 2031) | 6.13 % |
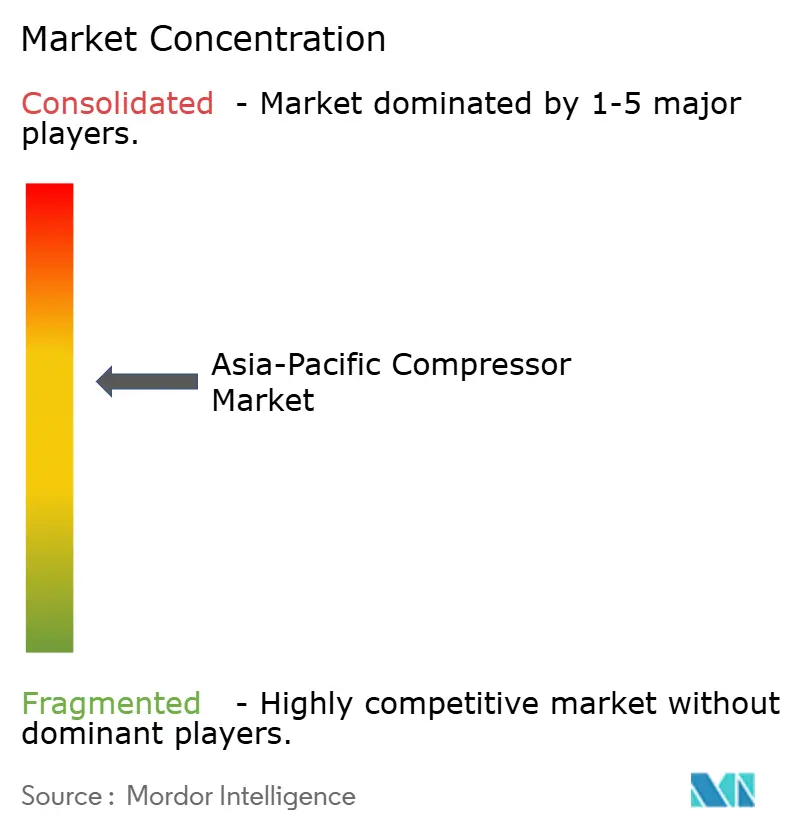
| Market Concentration | Medium |
Major Players *Disclaimer: Major Players sorted in no particular order Image © Mordor Intelligence. Reuse requires attribution under CC BY 4.0. | |
Asia-Pacific Compressor Market Analysis by Mordor Intelligence
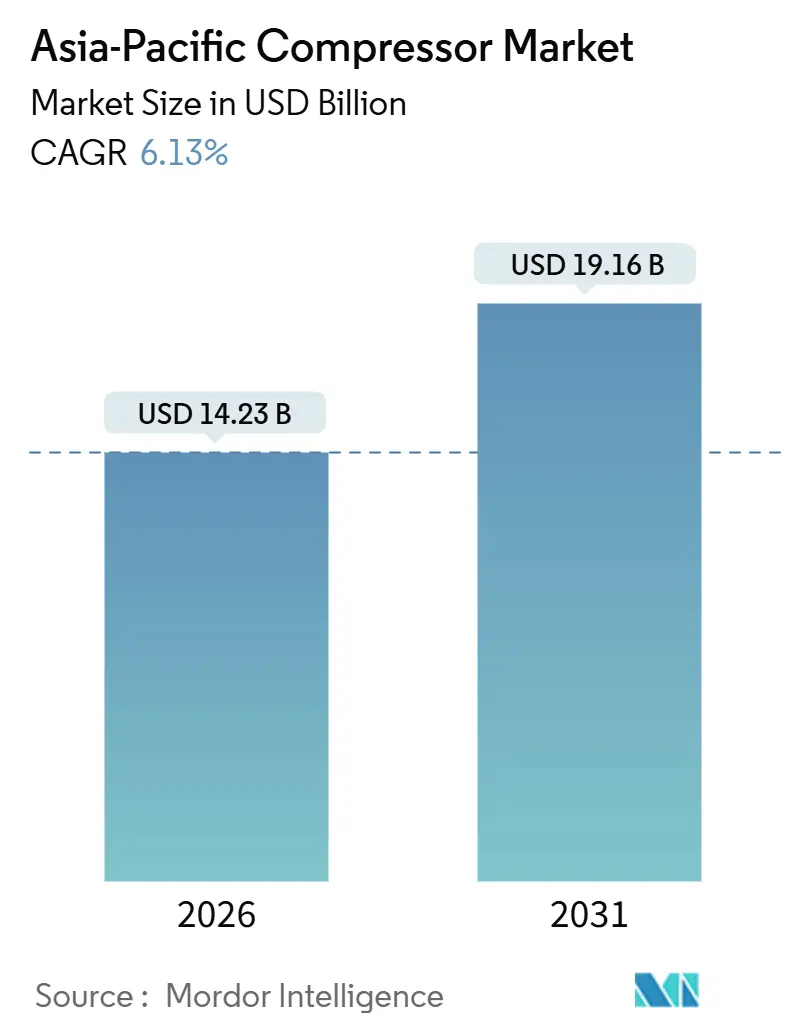
The Asia-Pacific Compressor Market size is estimated at USD 14.23 billion in 2026, and is expected to reach USD 19.16 billion by 2031, at a CAGR of 6.13% during the forecast period (2026-2031).
Demand is rising on the back of rapid industrialization, increasingly stringent energy-efficiency mandates, and a wave of LNG, hydrogen, and cold-chain infrastructure projects. The Asia-Pacific compressor market is also benefiting from policy-linked manufacturing corridors in India, Belt and Road construction in China, and a region-wide push toward variable-speed-drive (VSD) technologies that curb electricity consumption. Meanwhile, European and North American original-equipment manufacturers (OEMs) are localizing assembly and service footprints to counter tariff headwinds, while domestic champions exploit cost advantages in price-sensitive niches. Medium-pressure systems dominate day-to-day industrial loads, yet low-pressure compressors tied to HVAC-R and cold-chain growth are advancing fastest, mirroring the region’s rising middle-class spending power.
Key Report Takeaways
- By type, positive displacement captured 67.8% revenue share in 2025, while dynamic units are forecast to expand at a 6.5% CAGR through 2031.
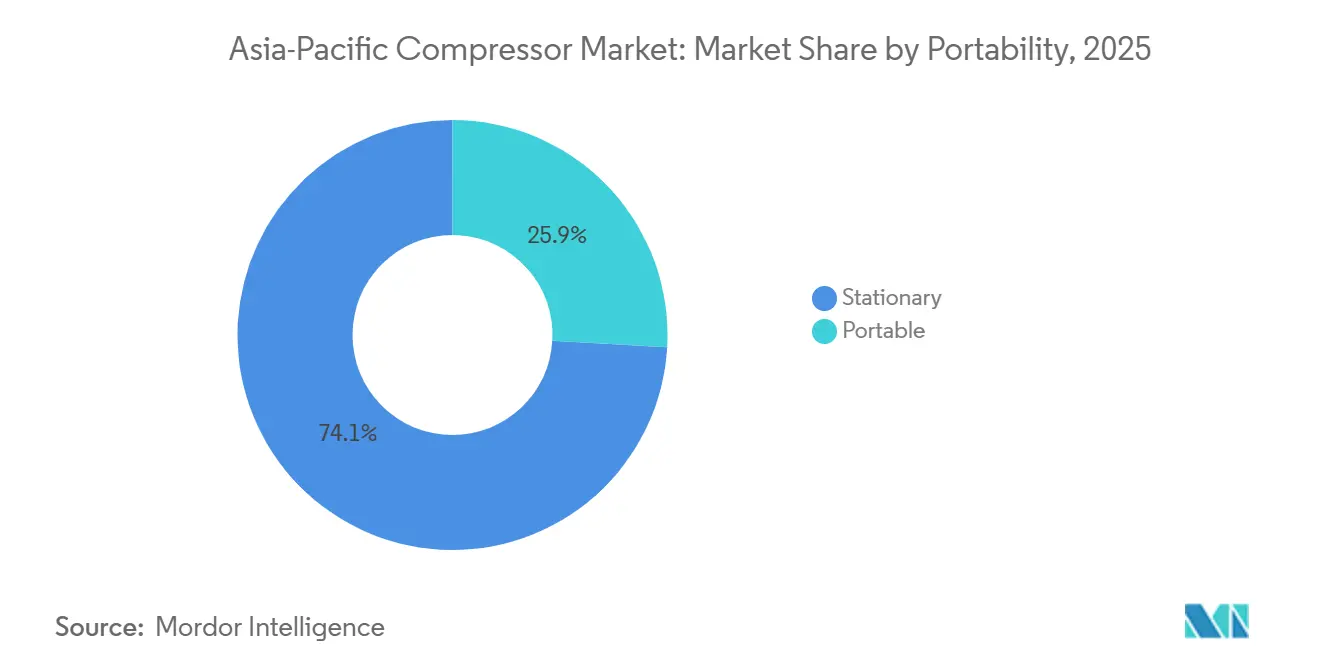
- By portability, stationary installations held 74.1% of demand in 2025; portable counterparts are growing at a 7.2% CAGR, led by infrastructure and mining projects.
- By pressure rating, medium-pressure systems accounted for 49.5% of the Asia-Pacific compressor market size in 2025; low-pressure units are advancing at an 8.0% CAGR to 2031.
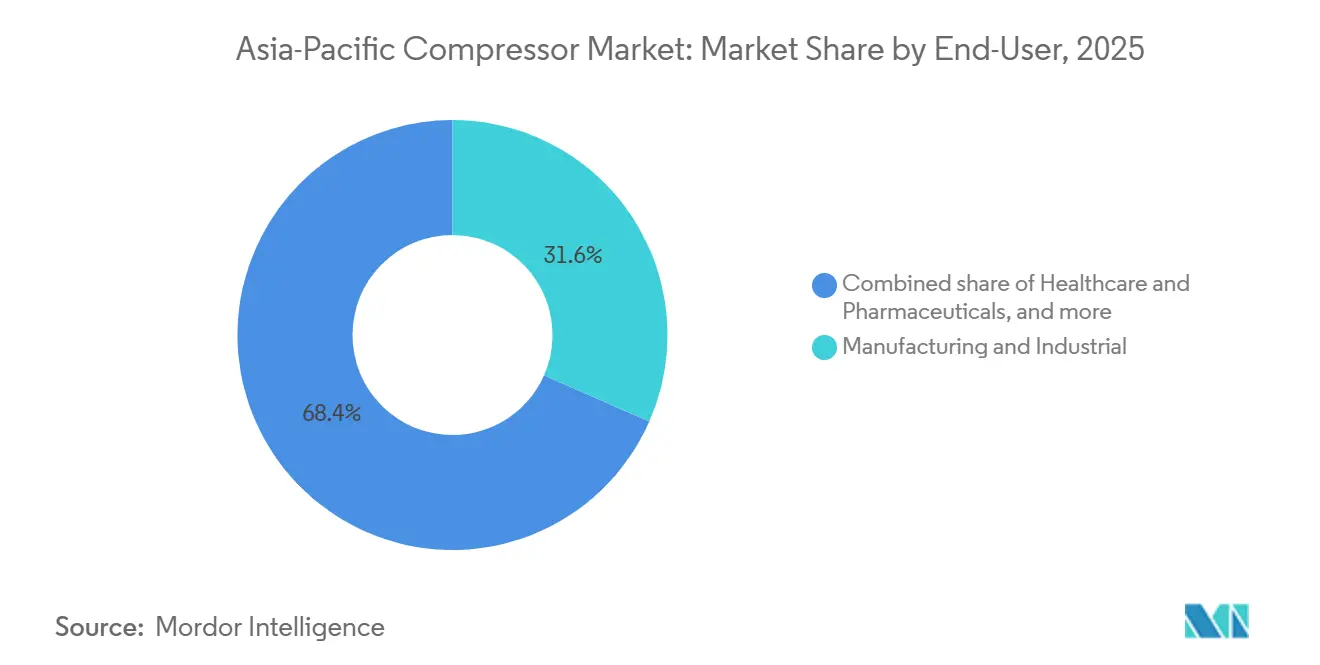
- By end-user, manufacturing led end-user adoption with 31.6% of the Asia-Pacific compressor market share in 2025, but healthcare and pharmaceuticals are rising at an 8.8% CAGR.
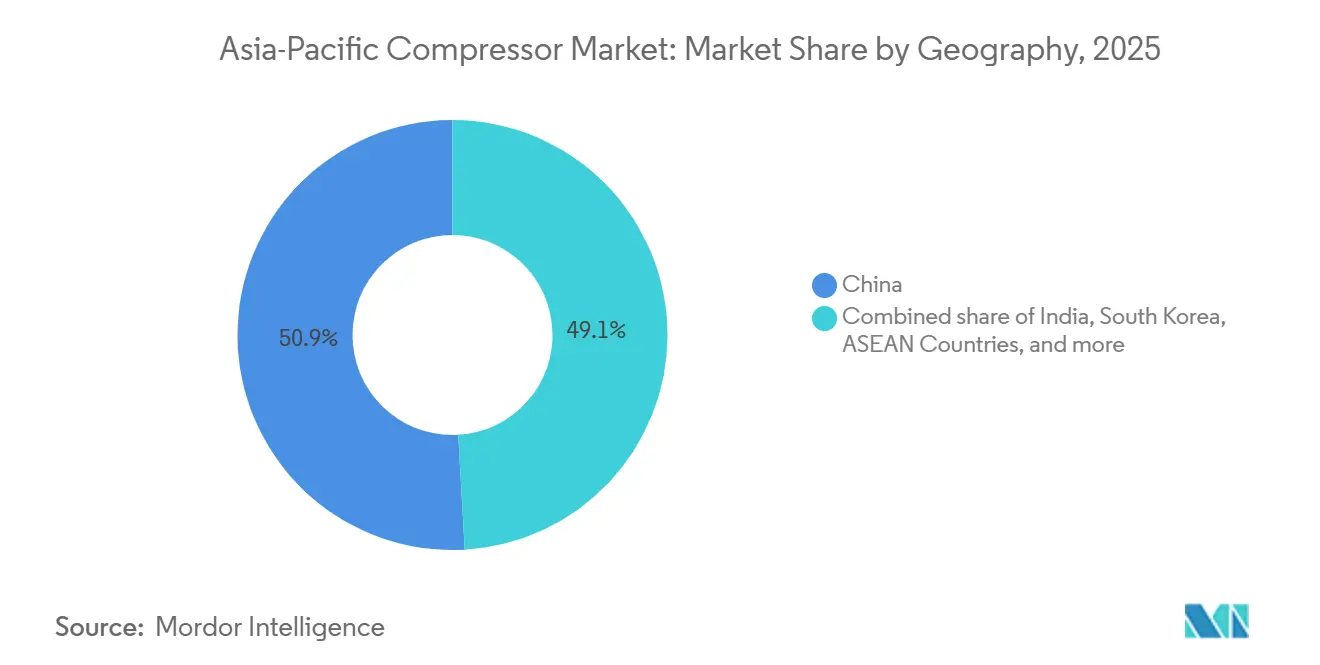
- By geography, China commanded a 50.9% share in 2025; India is the fastest-growing geography at a 6.9% CAGR through 2031.
Note: Market size and forecast figures in this report are generated using Mordor Intelligence’s proprietary estimation framework, updated with the latest available data and insights as of January 2026.
Asia-Pacific Compressor Market Trends and Insights
Drivers Impact Analysis*
| Driver | (~) % Impact on CAGR Forecast | Geographic Relevance | Impact Timeline |
|---|---|---|---|
| Rapid industrialization & manufacturing expansion | +1.8% | China, India, ASEAN (Vietnam, Thailand, Indonesia) | Medium term (2-4 years) |
| Stringent energy-efficiency regulations favouring rotary-screw & VSD units | +1.2% | Singapore, Australia, Japan, South Korea, with spillover to Malaysia and Vietnam | Long term (≥4 years) |
| LNG & gas-pipeline build-out boosting high-pressure gas compressors | +1.0% | China, India, Indonesia, Australia | Medium term (2-4 years) |
| Hydrogen infrastructure roll-out requiring specialty H₂ compressors | +0.6% | Japan, South Korea, Australia, Singapore | Long term (≥4 years) |
| Digital service contracts & predictive-maintenance platforms | +0.5% | Global, with early adoption in Japan, South Korea, Australia | Medium term (2-4 years) |
| Surging HVAC & cold-chain demand among APAC middle class | +0.9% | India, ASEAN, China tier-2 and tier-3 cities | Short term (≤2 years) |
| Source: Mordor Intelligence | |||
Rapid Industrialization & Manufacturing Expansion
China delivered about 30% of global manufacturing value-added in 2025, while India’s production-linked incentive program earmarked INR 6,940 crore (USD 830 million) for air-conditioner and LED lines, spurring orders for rotary-screw and reciprocating units.[1] Press Information Bureau, “PLI Scheme for White Goods,” pib.gov.in ASEAN economies attracted USD 224 billion in foreign direct investment in 2024, with Vietnam and Thailand commissioning new electronics and automotive parks that require compressed-air networks.[2]Asian Development Bank, “ASEAN FDI Statistics,” adb.org India’s Delhi–Mumbai and Chennai–Bengaluru corridors embed VSD standards that trigger a replacement cycle away from fixed-speed machines. Higher-value manufacturing, semiconductors, EV batteries, and biologics demand oil-free and centrifugal designs with tighter tolerances. Stabilizing steel output but rising aluminum and copper smelting in Indonesia and India further lift multi-megawatt centrifugal demand.
Stringent Energy-Efficiency Regulations Favouring Rotary-Screw & VSD Units
Singapore enforced Minimum Energy Performance Standards for industrial compressors in 2024, mandating efficiency labels and phasing out low-performance models. Vietnam’s 2025 building-code revision requires heat-recovery HVAC systems built around VSD compressors. Australia’s Safeguard Mechanism penalizes high-emission facilities, accelerating rotary-screw upgrades that cut electricity use 20–30%. Japan’s Top Runner program and South Korea’s Green New Deal keep tightening benchmarks, while Malaysia’s energy-efficiency plan targets a 10% cut in industrial intensity by 2030. Across the Asia-Pacific compressor market, payback periods of 18–24 months for VSD retrofits are catalyzing small- and mid-size enterprise adoption.
LNG & Gas-Pipeline Build-Out Boosting High-Pressure Gas Compressors
Indonesia’s PLN brought the Arun LNG terminal online in 2024, installing high-pressure reciprocating packages to boost regasified gas into pipelines. Vietnam’s PetroVietnam Gas ordered centrifugal boil-off units above 100 bar for two floating regasification vessels in 2025. South Korea’s Incheon expansion and India’s 15% pipeline extension both relied on fresh high-pressure trains. The IEA projects an 80 million-tonne jump in regional LNG import capacity by 2030, translating into roughly 200 new compressor installations.[3] International Energy Agency, “Gas 2025,” iea.org
Hydrogen Infrastructure Roll-Out Requiring Specialty H₂ Compressors
Kawasaki Heavy Industries commissioned a 700-bar pilot compressor in 2025, while Hyundai deployed multi-stage hydrogen stations across Seoul and Busan. Australia’s Woodside H2Perth and Fortescue Pilbara projects will require ultra-high-pressure systems above 300 bar. Singapore’s Jurong Island hydrogen import terminal plan includes cryogenic and high-pressure compression trains. Japan’s NEDO committed USD 500 million to hydrogen supply-chain pilots, identifying compressor reliability as a bottleneck. These ventures create a premium, high-margin niche within the Asia-Pacific compressor market.
Restraints Impact Analysis*
| Restraint | (~) % Impact on CAGR Forecast | Geographic Relevance | Impact Timeline |
|---|---|---|---|
| High upfront cost of oil-free & VSD compressors | -0.7% | India, ASEAN, China tier-2 and tier-3 cities | Short term (≤2 years) |
| Raw-material price volatility squeezing OEM margins | -0.5% | Global, with acute impact on China and India manufacturing hubs | Medium term (2-4 years) |
| Shortage of skilled technicians for advanced systems | -0.4% | India, ASEAN, Australia regional centers | Medium term (2-4 years) |
| Rising rental penetration dampening new-unit sales | -0.3% | Australia, New Zealand, ASEAN construction corridors | Short term (≤2 years) |
| Source: Mordor Intelligence | |||
High Upfront Cost of Oil-Free & VSD Compressors
Oil-free rotary-screw machines command a 40–60% premium over lubricated alternatives, while VSD packages add 15–25%, deterring small enterprises in India, Indonesia, and Vietnam. Total cost of ownership favors premium units in contamination-sensitive settings, yet many users defer upgrades until failures occur. Kirloskar Pneumatic reported that 60% of oil-free inquiries did not convert within 12 months, citing budget constraints. Entry-level oil-free 50-hp screws list at USD 25,000 against USD 15,000 for lubricated peers, a delta many small workshops struggle to justify. “Air-as-a-service” leasing softens capex but remains under 10% penetration across the Asia-Pacific compressor market.
Raw-Material Price Volatility Squeezing OEM Margins
Copper oscillated between USD 8,500 and USD 10,200 per tonne in 2024, and hot-rolled coil swung from USD 550 to USD 720, cutting gross margins 200–300 basis points. Aluminum premiums stayed elevated because of energy costs, and nickel prices remained volatile amid Indonesian export curbs, inflating stainless-steel input costs. Atlas Copco disclosed a 1.2-point margin hit in its 2024 Asia-Pacific business, driving a pivot toward material-light modular designs.[4]Atlas Copco, “Annual Report 2024,” atlascopco.com Smaller regional producers lack hedging capacity, leaving them doubly exposed to spikes.
*Our forecasts treat driver/restraint impacts as directional, not additive. The impact forecasts reflect baseline growth, mix effects, and variable interactions.
Segment Analysis
By Type: Positive Displacement Dominates, Dynamic Gains in Large-Scale Projects
Positive displacement machines controlled 67.8% of the Asia-Pacific compressor market in 2025, buoyed by rotary-screw and reciprocating uptake across factory floors and gas-gathering fields. Dynamic compressors, led by centrifugal designs, are forecast to grow at a 6.5% CAGR as petrochemical and LNG investments proliferate. The Asia-Pacific compressor market size for dynamic units is projected to widen alongside ethylene crackers and ammonia loops that favor multi-megawatt centrifugal trains. Magnetic-bearing systems from Mitsubishi Heavy Industries and Siemens trim operating costs up to 40% over two decades. Variable-speed screws are narrowing the efficiency gap with dynamics, while rotary-vane machines find cleanroom niches where ISO 8573-1 Class 0 purity is mandatory.
Digital twins lengthen service intervals for reciprocating models, and Hitachi’s hybrid screw with embedded sensors cuts automotive paint-shop energy by 15%. Collectively, these innovations underscore how the Asia-Pacific compressor market continues to blur traditional boundaries between displacement and dynamic classes.
By Portability: Stationary Units Anchor Industrial Base, Portable Grows with Infrastructure Boom
Stationary equipment represented 74.1% of 2025 demand, integrated into centralized factory and refinery grids. Portable units, however, are expanding at a 7.2% CAGR, leveraged by expressways, rail, and mining sites across India, Vietnam, and Australia. Contractors increasingly rent compressors to avoid capex, accelerating fleet turnover at rental houses and lifting service-parts revenue. The Asia-Pacific compressor market share for stationary units will remain dominant, yet incremental gains accrue to battery-electric portables, which address urban noise and emission curbs. Kaeser’s lithium-ion model, launched in 2024, targets CBD projects in Singapore and Hong Kong with 4–6 hours of runtime.



By Pressure Rating: Medium Pressure Leads, Low Pressure Surges with HVAC Demand
Medium-pressure compressors (20–100 bar) held a 49.5% share in 2025, serving mainstream industrial pneumatics, assembly lines, and moderate oil-and-gas tasks. Low-pressure systems, however, are slated to post an 8.0% CAGR through 2031, reflecting triple-digit growth in residential and commercial cooling loads as air-conditioner ownership multiplies. The Asia-Pacific compressor market size for low-pressure applications is swelling within cold-chain logistics, where refrigerated warehouse space rose by 2.5 million m² in 2024. High-pressure and ultra-high-pressure tiers remain smaller but are essential to CNG and hydrogen refueling networks.
By End-User: Manufacturing Dominates, Healthcare Accelerates with Cleanroom Expansions
Manufacturing contributed 31.6% of 2025 revenue, anchored by automotive, electronics, and metal-working plants. Healthcare and pharmaceuticals stand out as the fastest-growing adopters, expanding at an 8.8% CAGR as biologics and sterile-injectable facilities multiply across India, China, and Singapore. The Asia-Pacific compressor industry is witnessing a pivot toward ISO 8573-1 Class 0 oil-free solutions that eliminate contamination risk in GMP suites. Meanwhile, oil-and-gas, power generation, and chemicals maintain steady demand for bespoke, high-horsepower packages.
Geography Analysis
China anchored 50.9% of 2025 sales, underwritten by Belt and Road construction and state automation drives. The Asia-Pacific compressor market size in India is expanding at a 6.9% CAGR, catalyzed by production-linked incentives and a 15% city-gas pipeline extension. Japan and South Korea exhibit lower growth yet spearhead hydrogen compression research, exporting magnetic-bearing centrifugal know-how into ASEAN.
Vietnam, Thailand, and Indonesia pulled USD 224 billion of FDI in 2024, funneling rotary-screw and oil-free demand into new electronics, automotive, and food-processing plants. Australia and New Zealand revolve around replacement cycles, but the lithium-mining surge and green-hydrogen pilots in Western Australia are creating premium orders for ultra-high-pressure systems.
Elsewhere, Pakistan, Bangladesh, and Sri Lanka inch forward as textile exporters modernize compressed-air installations to satisfy sustainability audits. Collectively, the Asia-Pacific compressor market remains a tapestry of mature, high-value hubs and frontier growth pockets that command differentiated product and service strategies.
Regulatory Landscape
Energy-efficiency and product-conformance rules are tightening across Asia-Pacific, increasing compliance demands for compressor OEMs and importers. China implemented GB/T 16665-2025 effective May 1, 2026, updating monitoring and energy-saving test methods for air compressor units and air distribution systems, which raises the need for standardized testing and documentation when selling into industrial sites and public projects.
The regulatory push is also closing gaps around imports and minimum performance. Singapore expanded its Energy Conservation (Amendment) Act framework so MEPS and the Mandatory Energy Labelling Scheme cover regulated goods imported for end-users' own use from July 1, 2026, limiting the ability to bypass efficiency thresholds through direct procurement. India added a compliance gate for screw compressors by making BIS certification mandatory for models rated at or above 1 kW under IS 15718:2025, with the requirement applying from September 1, 2026 for domestic sale and imports. This shifts supplier planning toward longer certification lead times and model-by-model licensing.
Competitive Landscape
The top five suppliers, Atlas Copco, Ingersoll Rand, Mitsubishi Heavy Industries, Siemens, and Hitachi, control roughly 40-45% of sales, indicating moderate concentration. Local assembly lines, such as Atlas Copco’s 2024 Pune plant, mitigate tariffs and compress lead times. ELGi’s Melbourne service hub trims downtime for Australian mining fleets by delivering parts within 48 hours. Domestic entrants like Kirloskar Pneumatic and Kaishan leverage cost advantages but wrestle with limited access to high-end VSD and IoT modules.
White-space opportunities orbit hydrogen, oil-free retrofits, and digital twins. Burckhardt Compression and Ariel have carved 50-70% price-premium hydrogen niches, while Siemens and Hitachi monetize edge-analytics platforms that slash unplanned downtime 15-20%. SAP’s partnership with Hoerbiger embeds valve diagnostics into its asset network, signaling how data services could eclipse hardware revenue over a 15-year lifecycle. Competitive intensity in the Asia-Pacific compressor market is poised to sharpen as software ecosystems and specialty gases redefine differentiation.
Asia-Pacific Compressor Industry Leaders
Atlas Copco AB
Ingersoll Rand Inc.
Mitsubishi Heavy Industries Ltd
Siemens AG
Hitachi Industrial Equipment Systems Co Ltd
- *Disclaimer: Major Players sorted in no particular order

Market Opportunities and Future Outlook
Energy-transition and gas-infrastructure projects are creating near-term whitespace for high-pressure, specialty-gas, and engineered-package compressors, along with aftermarket service contracts. In 2026, Burckhardt Compression secured orders for LNG terminals in Thailand and Taiwan, including Laby compressor units for boil-off gas services, while Everllence supplied RB barrel-type compressor skids for a Thailand carbon capture and storage project at PTTEP-operated Arthit. These project-linked procurements tend to favor suppliers that can provide compliance documentation, support site commissioning, and stand behind continuous-duty reliability.
Opportunities are also showing up in network expansions and brownfield modernization where compressor procurement is explicitly embedded in approved capex. In Australia, APA Group moved its South West Pipeline expansion in Victoria forward after Australian Energy Regulator approval, with procurement of compression units referenced for end-July 2026, supporting demand for pipeline and station compression packages as well as long-cycle maintenance. In Brunei, Hibiscus Petroleum formally launched its Low-Pressure Compressor project at the Onshore Processing Plant in Lumut, including an operational Integrated Compressor Line, pointing to debottlenecking and efficiency upgrades at existing processing assets. Across these use cases, suppliers with VSD/oil-free portfolios plus field service, spares availability, and condition monitoring are positioned to win replacement and retrofit spend tied to energy-efficiency mandates and uptime requirements.
Recent Industry Developments
- July 2026: Ingersoll Rand announced a multiyear strategic partnership with Garrett Motion to develop next-generation oil-free air compressor technology for industrial applications. The collaboration targets faster development cycles for higher-efficiency, oil-free architectures, supporting competitiveness in contamination-sensitive and energy-efficiency-driven segments.
- October 2025: Hitachi Industrial Equipment Systems launched its G Series oil-free scroll air compressor line, designed to operate in ambient temperatures up to 45 degrees Celsius. The release expands oil-free options for factories and utilities in hotter Asia-Pacific operating environments as uptime and air-quality standards continue to tighten.
- December 2024: Assam Gas Company Ltd awarded Asian Energy Services Ltd a three-year contract to supply compressor stations on a build, own, operate, and transfer basis. The award points to ongoing investment in gas transmission infrastructure and reinforces a service-led deployment model for packaged compressor stations.


Research Methodology Framework and Report Scope
Market Definition and Coverage
We size the Asia-Pacific compressor market as the revenues earned from selling new compressors used in industrial and commercial applications across the region, counted at the point of sale and reported in USD.
Scope exclusions: We exclude installation, after-sales service, spare parts, rentals, and used or refurbished compressor units.
Segmentation Overview
- By Type
- Positive Displacement
- Reciprocating
- Rotary Screw
- Rotary Vane
- Dynamic
- Centrifugal
- Axial
- Positive Displacement
- By Portability
- Stationary
- Portable
- By Pressure Rating
- Low (Up to 20 bar)
- Medium (20 to 100 bar)
- High (100 to 300 bar)
- Ultra-High (Above 300 bar)
- By End-User
- Oil and Gas
- Power Generation
- Manufacturing and Industrial
- Chemicals and Petrochemicals
- HVAC-R and Building Services
- Automotive and Transportation
- Food and Beverage
- Healthcare and Pharmaceuticals
- By Geography
- China
- India
- Japan
- South Korea
- ASEAN Countries
- Australia and New Zealand
- Rest of Asia-Pacific
Data Sources, Market Sizing, and Validation
Desk Research
Desk work started with mapping demand pools and supply signals that could be checked in public data. We reviewed sources such as UN Comtrade trade statistics, national statistical offices in major Asia-Pacific economies, International Energy Agency energy and industry indicators, and World Bank industrial output series to understand where compressor-consuming activity is growing. We also used publicly available standards and technical references, such as ISO documents and peer reviewed engineering journals, to keep assumptions on pressure classes and typical applications realistic.
To connect activity indicators with revenue, we triangulated with company annual reports, investor presentations, and credible press coverage on plant additions, LNG and petrochemical projects, and factory automation trends. Where available, paid subscriptions that consolidate company financials, contracts and tenders, and shipment level trade records were used to speed up cross checks and reduce manual data gaps. The desk sources listed above are illustrative only, and other public and proprietary sources were also used for data collection, validation, and clarification.
Primary Interviews and Surveys
Primary work focused on validating how compressors are specified, priced, and procured across end users, including manufacturing, oil and gas, power, chemicals, building services, and transportation. We spoke with a mix of manufacturers, distributors, EPC and maintenance stakeholders, and large end users across key Asia-Pacific countries, so desk based demand signals could be adjusted to reflect real buying patterns and replacement cycles. The discussions also helped clarify which adjacent items are commonly bundled (such as air treatment packages) versus priced separately, tightening the final revenue boundary.
Distribution of primary research fieldwork respondents
| Company type | Respondent position |
|---|---|
| Top tier: 30% | CXOs: 20% |
| Mid tier: 49% | Functional/Unit leaders: 30% |
| Smaller Players: 21% | Managers: 50% |
Market-Sizing & Forecasting
The market model is built using a top-down approach, where industrial activity and energy investment indicators are converted into compressor demand pools by application, then translated into revenue using typical price bands by technology and pressure class. Because the region is diverse, the build is done by major countries and then rolled up to Asia-Pacific totals, after which splits are applied to portability, pressure rating, type, and end-user.
To keep totals grounded, we corroborated the results with selective bottom-up approximations. This included supplier and channel roll ups in key countries and sampled ASP time and volume checks for common use cases. Inputs used in the model include manufacturing output trends, new capacity additions in chemicals and petrochemicals, LNG terminal and pipeline project activity, HVAC-R and building construction intensity, and replacement cycles tied to operating hours and maintenance practices. Forecasts were produced using scenario analysis supported by expert views on industrial capex timing and energy price sensitivity, followed by year by year checks so abrupt swings were investigated before finalizing.
Data Validation & Update Cycle
After sizing, the outputs are checked against independent signals, including trade flows, industrial production trends, and announced project pipelines, and differences are traced back to assumptions on pricing, mix, and adoption. Outliers are reviewed in more than one analyst pass, and when a country or end user shows an unusual swing, follow up calls are triggered to confirm whether it is real demand or a modeling artifact.
Reports are refreshed annually, and interim updates are made when material events occur, such as major policy shifts, large capacity announcements, or sharp currency moves. Before delivery, we run a fresh review to confirm the latest macro inputs, redo key calculations, and ensure the narrative matches the updated numbers.
Mordor Intelligence's Asia Pacific Compressor Market Sizing Compared With Other Published Estimates
Published market sizes for Asia-Pacific compressors often do not align because scope lines are drawn differently. The same year can also be expressed with different currency timing or price assumptions. Differences also come from how analysts treat adjacent equipment, how they split portable versus stationary demand, and how frequently the model is refreshed when industrial capex conditions change.
The biggest gap drivers in this market are whether air compressors only are counted or whether process gas compressors are also included, and whether revenue includes packaged systems beyond the core compressor. Some estimates also anchor on a longer forecast window and apply a uniform CAGR across countries, which can overstate near term growth when large projects slip. In our build, compressors are counted by defined type, pressure class, and end-user demand signals across major Asia-Pacific countries, with packaged add-ons included only when they are typically sold as part of the compressor unit bundle, a scope choice applied by Mordor Intelligence.
Benchmark comparison
| Source | Market Size | Gaps in Research Methodology |
|---|---|---|
| Mordor Intelligence | USD 14.23 B (2026) | |
| Regional Consultancy A | USD 13.27 B (2026) | Uses a narrower revenue boundary that appears to undercount high pressure and process applications, and applies more uniform pricing across countries without adjusting enough for mix shifts toward oil-free and VSD units. |
| Trade Journal B | USD 9.30 B (2023) | Covers air compressors as the primary focus and is anchored to a prior year, which reduces comparability when later year demand is lifted by industrial capex cycles and large energy projects. |
The spread in the table is mainly explained by product coverage and timing. A broader compressor definition and a later year capture more of the region's process and project led demand. By tying the calculation to clear application indicators, realistic price bands, and country level roll ups, we keep the total traceable, and it can be reproduced and stress tested as conditions change.


Key Questions Answered in the Report
How large is the Asia-Pacific compressor market in 2026?
The market stood at USD 14.23 billion in 2026 and is projected to reach USD 19.16 billion by 2031, registering a 6.13% CAGR for the period 2026-2031.
Which segment is expanding fastest within the region?
Low-pressure compressors tied to HVAC-R and cold-chain demand are growing at an 8.0% CAGR through 2031.
Why are portable compressors gaining popularity?
Infrastructure, mining, and rental-fleet operators prefer mobile units that eliminate capex and accelerate project timelines.
What drives investment in hydrogen compression?
National hydrogen roadmaps in Japan, South Korea, and Australia require 300-bar-plus systems for refueling and export pipelines.
How are OEMs countering margin pressure from volatile metals prices?
Leading suppliers are adopting modular, material-light designs and localizing assembly to reduce input costs and shipping expenses.
Which countries enforce the strictest efficiency rules?
Singapore, Australia, Japan, and South Korea lead with minimum-performance standards and emissions penalties that favor VSD upgrades.
Page last updated on:


 Your data is secure and never sold or shared.


