
Market Overview
| Study Period | 2021 - 2031 |
|---|---|
| Forecast Data Period | 2026 - 2031 |
| Base Year Market Size (2025) | USD 3.41 Billion |
| Market Size (2026) | USD 3.75 Billion |
| Market Size (2031) | USD 6.02 Billion |
| Growth Rate (2026 - 2031) | 9.93 % |
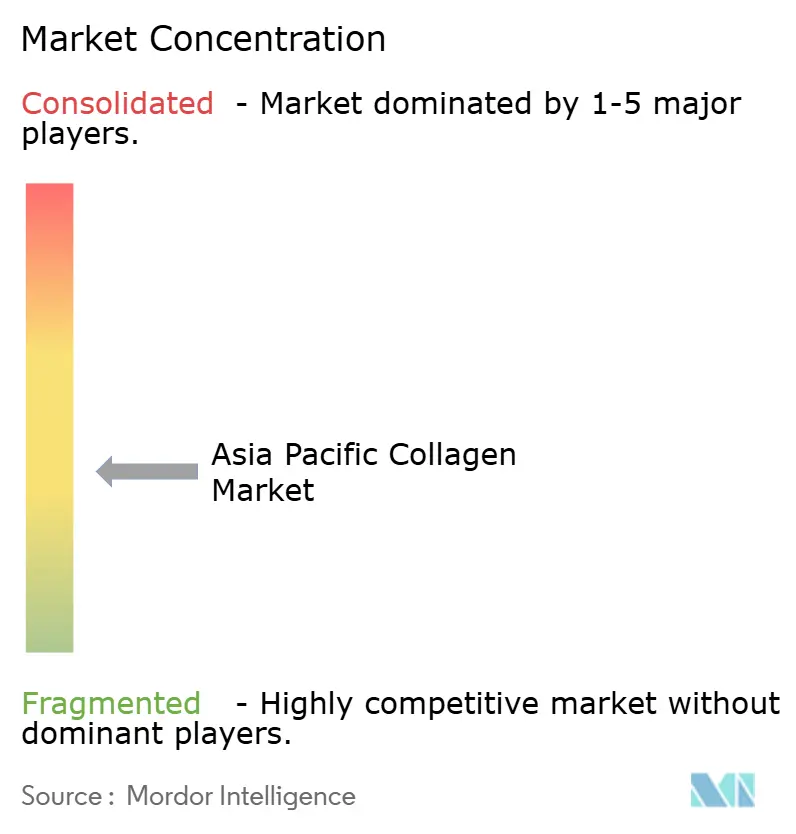
| Market Concentration | Medium |
Major Players *Disclaimer: Major Players sorted in no particular order Image © Mordor Intelligence. Reuse requires attribution under CC BY 4.0. | |
Asia Pacific Collagen Market Analysis by Mordor Intelligence
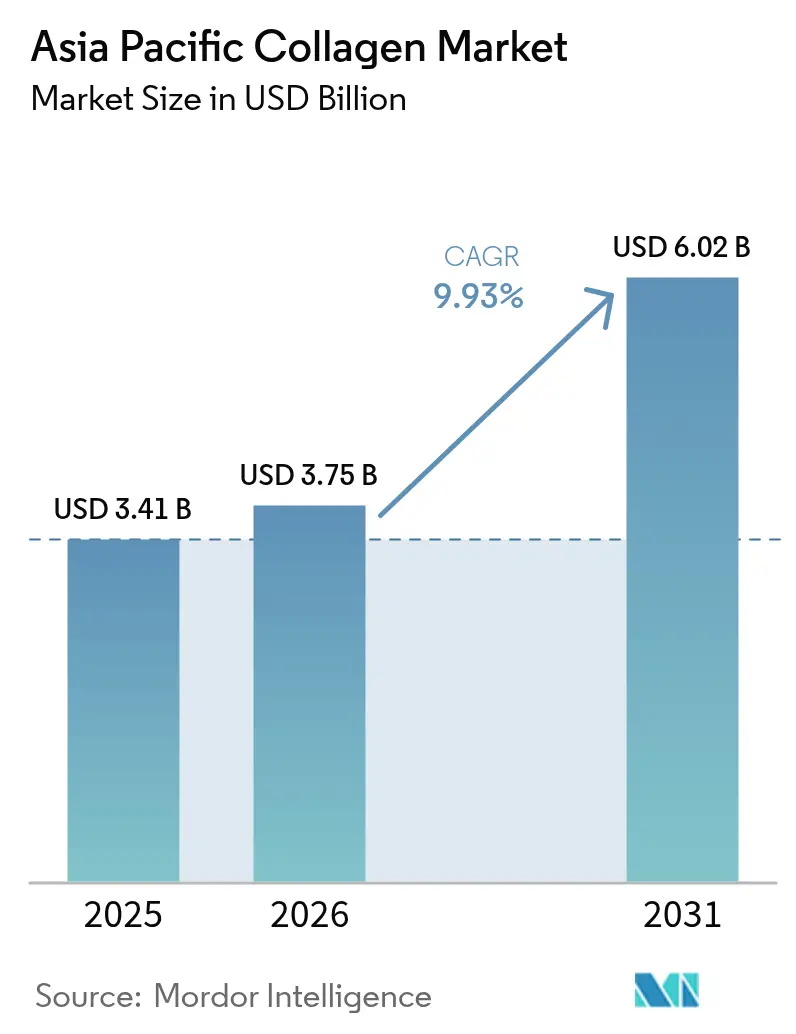
The Asia Pacific collagen market size was valued at USD 3.41 billion in 2025 and estimated to grow from USD 3.75 billion in 2026 to reach USD 6.02 billion by 2031, at a CAGR of 9.93% during the forecast period (2026-2031). This robust growth, driven by a 10.02% CAGR, is attributed to several key factors, including demographic shifts, rising disposable incomes, and an increasing focus on preventive health and beauty-from-within consumption patterns. The region is emerging as the global hub for collagen supply and demand, leveraging China's manufacturing economies of scale alongside India's rapidly growing demand. The market is witnessing advancements in extraction technologies, such as enzymatic hydrolysis and acid-soluble collagen methods, which are improving production efficiency and output. Marine-based sourcing initiatives, including the use of fish skin and scales, are gaining popularity due to their sustainability and superior bioavailability. Furthermore, the expansion of regulatory frameworks, including harmonized standards across countries, is fostering innovation and facilitating cross-border trade within the region. Despite these positive developments, the market faces certain challenges. Competition from alternative proteins, such as plant-based and lab-grown options, is intensifying. Additionally, rising raw material costs are exerting pressure on profit margins, posing short-term hurdles for manufacturers. Nevertheless, the long-term outlook for the Asia Pacific collagen market remains optimistic, supported by technological advancements and evolving consumer preferences.
Key Report Takeaways
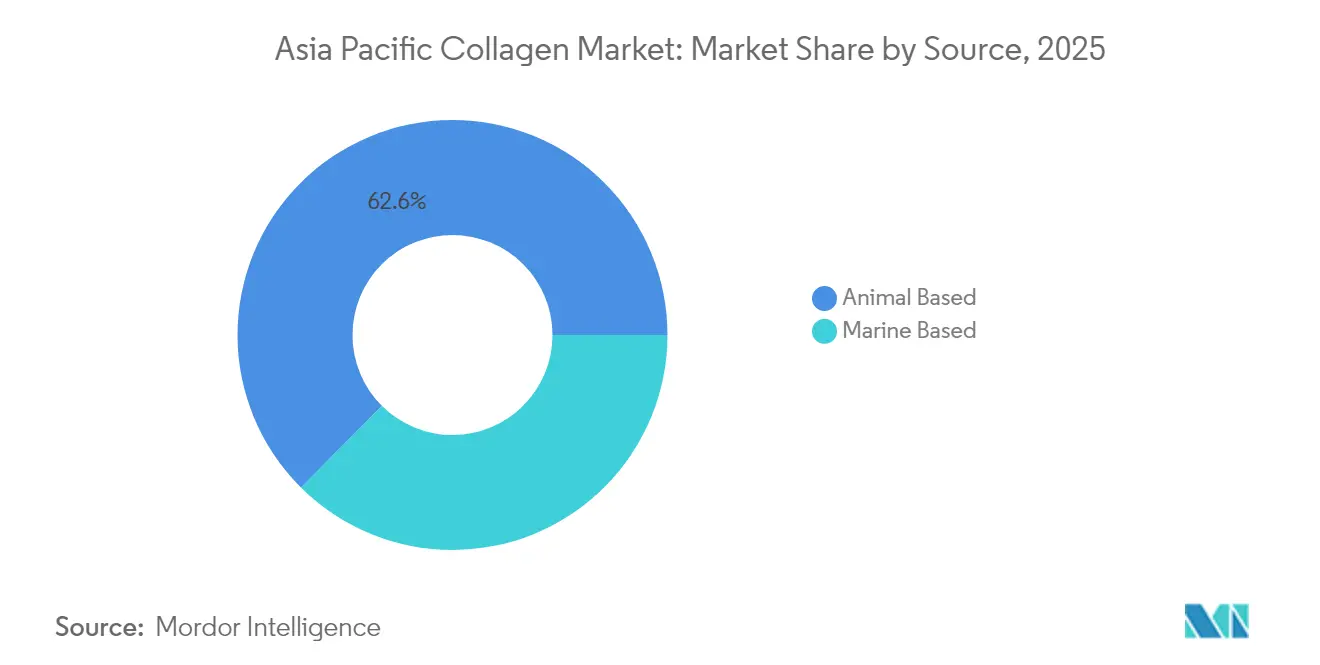
- By source, animal-based collagen captured 62.55% of the Asia Pacific collagen market share in 2025, whereas marine-based variants are forecast to grow at a 10.28% CAGR between 2026 and 2031.
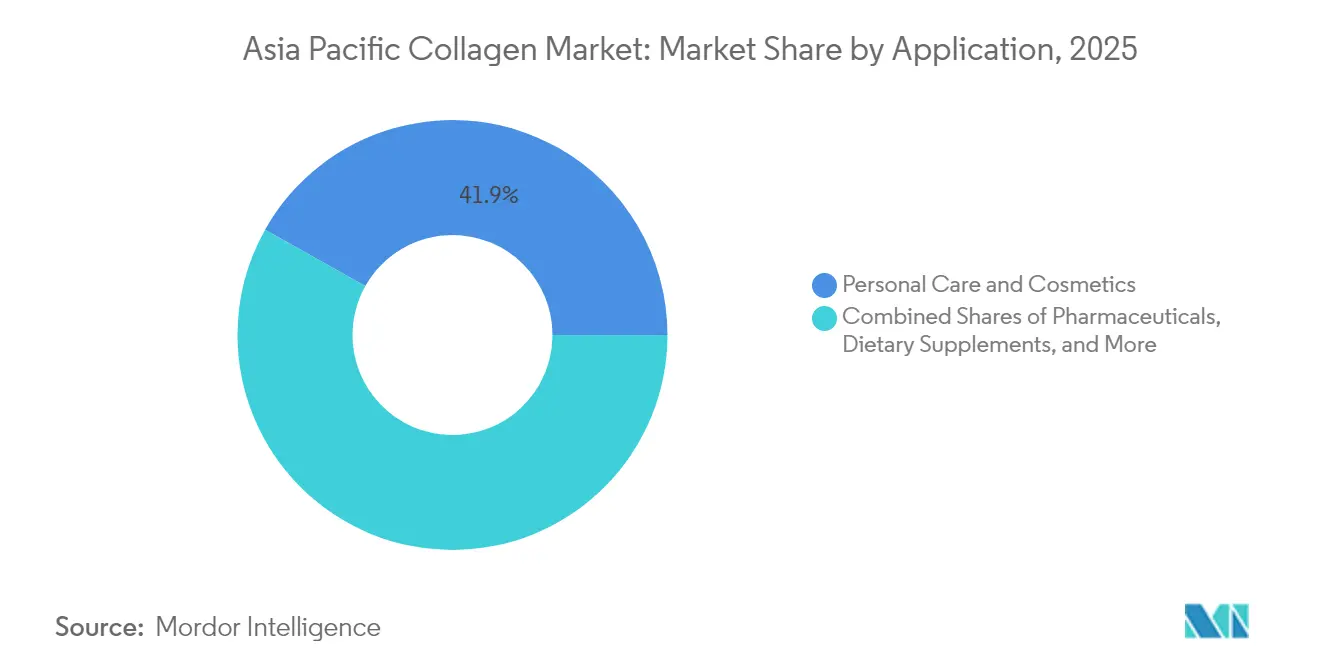
- By application, personal care and cosmetics led revenue with a 41.85% share in 2025, while dietary supplements are expected to record the highest 11.07% CAGR through 2031.
- By geography, China contributed 34.11% of 2025 regional sales, and India is poised to advance at an 11.38% CAGR in the same forecast window.
Note: Market size and forecast figures in this report are generated using Mordor Intelligence’s proprietary estimation framework, updated with the latest available data and insights as of 2026.
Market Trends and Insights
Drivers Impact Analysis of Asia Pacific Collagen Market*
| Drivers | (~) % Impact on CAGR Forecast | Geographic Relevance | Impact Timeline |
|---|---|---|---|
| Increasing consumer demand for health and wellness products | +1.8% | APAC core, strongest in China and India | Medium term (2-4 years) |
| Ageing population seeking joint-care solutions | +1.6% | Japan, Australia, South Korea with spillover to China | Long term (≥ 4 years) |
| Rising Applications in Anti-Aging Creams and Other Beauty Products | +1.4% | Global, with premium segments in Japan and South Korea | Short term (≤ 2 years) |
| Technological advancements in extraction, processing, and formulation | +1.2% | Manufacturing hubs in China, innovation centers in Japan | Medium term (2-4 years) |
| Shift toward sustainable marine collagen sources | +0.9% | Coastal economies: Thailand, Indonesia, Vietnam | Long term (≥ 4 years) |
| Rising Innovation in research and production | +0.8% | R&D centers in Japan, China, Australia | Medium term (2-4 years) |
| Source: Mordor Intelligence | |||
Increasing Consumer Demand for Health and Wellness Products
As the wellness economy continues to expand across the Asia Pacific region, collagen is increasingly being utilized in functional nutrition, extending its applications beyond traditional beauty-related uses. Furthermore, per capita income in the region is expected to grow significantly, rising from USD 17,440 in 2024 to a projected USD 23,260 by 2029. This economic growth is driving a shift toward preventive health investments, creating a strong foundation for the adoption of premium collagen products. These products are specifically designed to address key health concerns such as joint health, skin elasticity, and bone density maintenance. Consumers are demonstrating a growing willingness to pay higher prices for collagen formulations that are supported by robust scientific evidence. This trend offers substantial margin expansion opportunities for suppliers who can effectively demonstrate the clinical efficacy of their products through peer-reviewed research and ensure compliance with regulatory health claims.
Ageing Population Seeking Joint-Care Solutions
As developed APAC markets experience significant demographic shifts, the demand for joint-care collagen applications continues to grow steadily. According to the World Bank[1] data from 2024, 30% of people in Japan were above the age of 65. Japan, characterized by its advanced aging society, serves as a pivotal market for testing and developing innovative solutions. For instance, Rohto Pharmaceutical's MOCOLA brand has introduced a unique combination of 20ml collagen drinks and vitamin tablets, effectively addressing the consumption preferences of elderly consumers. This approach highlights the importance of format innovation in catering to the aging population. Beyond Japan, similar trends are emerging in China and South Korea, where aging baby boomers are becoming key drivers of market growth. These consumers, equipped with substantial accumulated wealth and a strong focus on health and wellness, are fostering the development of premium market segments. The demand for clinically-validated joint health formulations in these regions underscores the growing importance of addressing the specific needs of this demographic group.
Rising Applications in Anti-Aging Creams and Other Beauty Products
As consumer preferences increasingly lean towards holistic anti-aging solutions, the beauty industry is accelerating the incorporation of collagen into its formulations. This trend emphasizes the combination of topical and ingestible products to address aging concerns comprehensively. In April 2025, DSM-Firmenich introduced SYN-COLL CB tripeptide, a groundbreaking innovation in eco-conscious, high-performance peptides. This product is derived from 99% natural origins and has undergone clinical validation across diverse ethnic groups, highlighting its efficacy and inclusivity. The Asia Pacific cosmetics market, which accounts for over one-third of the global market share, offers a significant growth opportunity for collagen-infused beauty products. Additionally, sustainability is becoming a critical factor for brands, serving as a key differentiator in the competitive landscape while ensuring compliance with evolving regulatory requirements.
Technological Advancements in Extraction, Processing, and Formulation
Companies like Glanbia Nutritionals are driving significant advancements in collagen technology by introducing high-potency tripeptides. These tripeptides offer 4x faster absorption and 10x greater efficacy compared to traditional peptides, all while requiring just one-tenth of the dosage. Additionally, breakthroughs in enzymatic hydrolysis have enabled precise control over molecular weight, enhancing peptide functionality for specific health applications. This not only improves the effectiveness of collagen-based products but also reduces production costs, making them more accessible. These technological innovations have broadened collagen's use across various product formats, including ready-to-drink beverages, gummies, and functional foods. By addressing consumer preferences for convenience, these developments are facilitating collagen's penetration into mass-market channels, thereby expanding its market reach and potential.
Restraints Impact Analysis of Asia Pacific Collagen Market*
| Restraints | (~)% Impact on CAGR Forecast | Geographic Relevance | Impact Timeline |
|---|---|---|---|
| Competition from alternative proteins | -0.7% | Global, with innovation centers in China and Japan | Short term (≤ 2 years) |
| Stringent regulatory compliance and certification requirements | -0.5% | Regulatory-intensive markets: Japan, Australia, South Korea | Medium term (2-4 years) |
| Concerns over allergenicity and religious dietary restrictions | -0.3% | Muslim-majority markets: Indonesia, Malaysia | Long term (≥ 4 years) |
| High costs of sourcing and processing high-quality collagen raw materials | -0.2% | Raw material importing countries: Japan, South Korea | Short term (≤ 2 years) |
| Source: Mordor Intelligence | |||
Competition from Alternative Proteins
Companies like Rawga are driving significant innovation in collagen sourcing by developing VC-H1, a vegetable collagen derived from plant cell wall extensin. This product is specifically designed to replicate the tripeptide structure and molecular weight of animal collagen, offering a plant-based alternative that closely mimics its natural counterpart. At the same time, Evonik is making strides in precision fermentation through substantial investments and advancements in biotechnology. These efforts are creating scalable and sustainable alternatives to traditional collagen, addressing growing concerns about environmental impact and dietary restrictions. Additionally, these technologies hold the potential to reduce production costs when implemented at scale, making them economically viable. Consequently, traditional collagen suppliers are facing mounting pressure to adapt. They are focusing on differentiating their offerings by emphasizing superior bioavailability, securing clinical validation, and targeting specialized applications. These areas highlight the unique advantages of natural collagen, particularly its complex matrix properties, which synthetic alternatives have yet to fully replicate.
Stringent Regulatory Compliance and Certification Requirements
Regulatory complexities across APAC markets significantly hinder market entry and escalate compliance costs for businesses. In Japan, the Consumer Affairs Agency has introduced mandatory Good Manufacturing Practices (GMP) requirements and adverse event reporting protocols for Foods with Function Claims, particularly in tablet and capsule formats. These measures aim to enhance consumer safety but impose additional regulatory obligations on companies. Similarly, in China, the government is tightening its regulatory framework with evolving cross-border e-commerce regulations and proposed stricter labeling requirements for pre-packaged foods. These changes create a more intricate compliance landscape, favoring established players who possess the regulatory expertise and financial resources necessary to manage the diverse requirements across multiple jurisdictions. Smaller suppliers and new entrants, however, face significant challenges in meeting these stringent standards, which could lead to a consolidation of market share among larger, compliant incumbents who are better equipped to navigate these regulatory hurdles.
*Our forecasts treat driver/restraint impacts as directional, not additive. The impact forecasts reflect baseline growth, mix effects, and variable interactions.
Asia Pacific Collagen Market Segment Analysis
By Source:
Marine Sustainability Drives Premium PositioningMarine-based collagen accelerates at a 10.28% CAGR through 2031, outpacing the animal-based segment's market-leading 62.55% share in 2025, reflecting consumer preference shifts toward sustainable and hypoallergenic alternatives. Thai Union's marine collagen investments and circular economy initiatives demonstrate how fishing industry byproducts create value-added revenue streams while addressing sustainability concerns, according to the University of Florida IFAS EDIS. Animal-based collagen maintains dominance through established supply chains and cost advantages, particularly in price-sensitive market segments where functional benefits outweigh sustainability premiums.
The marine collagen segment benefits from technological advances in fish skin processing and decellularization techniques that enhance bioavailability while reducing allergenicity risks compared to bovine and porcine alternatives. Regulatory frameworks increasingly favor marine sources due to lower disease transmission risks and reduced religious dietary restrictions, particularly in Muslim-majority markets like Indonesia and Malaysia. However, marine collagen faces supply chain constraints from fishing industry regulations and seasonal availability, creating price volatility that limits mass-market penetration compared to consistently available animal-based alternatives.

By Application:
Personal Care and Cosmetics Lead the MarketPersonal care and cosmetics applications command 41.85% market share in 2025, yet dietary supplements emerge as the fastest-growing segment at 11.07% CAGR, indicating consumer behavior evolution toward preventive health approaches. The consumption of personal care and cosmetics is increasing in the region, owing to which, the use of collagen in various products is increasing. According to the METI (Japan) data from 2023, the production volume of makeup in Japan was 2.22 million kilograms. Darling Ingredients' development of Nextida GC collagen peptides targeting post-meal glucose spikes demonstrates application diversification beyond traditional beauty and joint health into metabolic wellness. Food and beverages represent emerging opportunities as manufacturers integrate collagen into functional foods, protein bars, and ready-to-drink formats targeting convenience-oriented consumers.
Pharmaceutical applications maintain steady growth through wound healing, orthopedic, and regenerative medicine applications, while animal nutrition segments benefit from pet humanization trends driving premium pet food formulations. The application diversification reduces market concentration risk and creates cross-selling opportunities for suppliers with comprehensive product portfolios. Regulatory approvals for new health claims, such as China's proposed joint health support function, could accelerate dietary supplement adoption and expand addressable market segments across multiple application categories.
Geography Analysis
China Collagen Market
In 2025, China holds a leading 34.11% share of the Asia Pacific collagen market, leveraging its position as a cost-efficient manufacturing hub and a rapidly growing consumption center. China's extensive raw material processing capabilities and well-developed supply chains drive cost advantages, enabling competitive pricing in global markets. Darling Ingredients' operations in China, generating USD 238.06 million in Food Ingredients revenue for 2024, underscore the market's scale and importance for global collagen suppliers. The country's shift toward stricter regulations, including enhanced labeling requirements and substantiation of health claims, creates challenges for smaller players while benefiting established suppliers with expertise in compliance and robust financial resources.
India Collagen Market
India is the fastest-growing market in the region, with a projected CAGR of 11.38% through 2031. This growth is driven by increasing disposable incomes, greater health awareness, and a growing middle class. India's youthful population and rising focus on preventive healthcare contribute to strong long-term demand for collagen-based dietary supplements and functional foods. However, the country's complex regulatory environment for nutraceutical classifications and import requirements poses challenges, encouraging businesses to adopt local manufacturing and partnership strategies. India's traditional medicine practices and consumer preference for natural health solutions foster acceptance of collagen products marketed as wellness enhancers rather than pharmaceutical solutions.
Japan, Australia and APAC Collagen Market
Japan and Australia are established, premium-focused markets where regulatory frameworks support science-based health claims, and consumers are willing to pay for clinically-validated products. Japan's "Foods with Function Claims" system facilitates evidence-based marketing, while Australia's Therapeutic Goods Administration enhances regulatory credibility, supporting regional market growth. These developed markets act as innovation hubs for new product formats and delivery systems, with successful launches often expanding to other APAC countries. In the broader Asia Pacific region, including Southeast Asian countries like Thailand, Indonesia, and Vietnam, opportunities exist for marine collagen sourcing and cost-effective manufacturing. These emerging markets, characterized by a growing middle class and increasing health awareness, present significant potential for collagen product consumption.
Regulatory Landscape
Regulation for collagen across Asia Pacific typically spans food safety standards, nutraceutical frameworks, and cosmetics rules, which creates multi-jurisdiction compliance work for suppliers selling across China, Japan, India, and Southeast Asia. In China, GB 31645-2018 sets key food safety requirements for collagen peptides, and GB/T 45992-2025 (Collagen and its hydrolysate, excluding gelatin) comes into effect from August 1, 2026, providing a clearer technical and testing baseline for collagen and its hydrolysates across production, inspection, and sales.
Japan manages food-grade collagen safety under the Ministry of Health, Labour and Welfare (MHLW) framework, including the Specifications and Standards for Food, Food Additives, Etc., and the Japan Specifications and Standards for Food Additives (JSFA). In India, the Food Safety and Standards Authority of India (FSSAI) health supplements and nutraceuticals framework shapes compliance expectations for supplement-format collagen, influencing documentation, labeling, and permissible-ingredient discipline for both importers and domestic formulators.
Value Chain Analysis
The regional value chain starts with raw material collection from bovine or porcine by-products (hides, bones) and marine by-products (fish skin and scales), followed by pre-processing such as sorting and cold-chain handling where required. Extraction and hydrolysis, including enzymatic hydrolysis to control peptide profiles, then feed into midstream processing by vertically integrated gelatin and collagen manufacturers and specialized peptide processors. Downstream players include dietary supplement brands, functional food and beverage manufacturers, and personal care and cosmetics formulators, with distributors and contract manufacturers supporting blending, tableting, and ready-to-drink formats.
Control points in the chain center on raw material quality consistency, traceability, and certification, particularly for halal-sensitive markets such as Indonesia and Malaysia where audit readiness becomes part of supplier qualification. Distribution and market-access partnerships also affect reach in fragmented markets; for instance, Brenntag Nutrition signed a distribution agreement with Genu-in for collagen peptides and gelatin solutions in Asia Pacific, highlighting the role of large ingredient distributors in regulatory documentation, warehousing, and customer onboarding. Capacity expansion and localization are visible as well, including Amicogen setting up the Aminavico plant in Vietnam through a joint venture with Navico (reported with 780 tons initial annual capacity, scalable to 2,400 tons), which points to a shift toward coastal processing hubs closer to marine by-product supply.
Competitive Landscape
The Asia Pacific collagen market, with a concentration score of 4 out of 10, indicates moderate fragmentation and highlights significant opportunities for consolidation among players with scale advantages and advanced technological capabilities. Leading suppliers like Darling Ingredients maintain strong market positions through vertical integration strategies that encompass raw material sourcing, processing, and distribution across various geographies.
Companies with diverse product portfolios, covering multiple applications and source materials, hold a competitive edge by enabling cross-selling opportunities and reducing reliance on single market segments. As precision fermentation and alternative protein companies disrupt traditional sourcing models, technology-driven differentiation becomes increasingly critical. Strategic partnerships and joint ventures are driving market expansion. For instance, Darling Ingredients' May 2025 partnership with Tessenderlo Group aims to establish a new company focused on collagen-based health, wellness, and nutrition applications.
Innovation-centric companies utilize proprietary peptide profiles and targeted health applications to secure premium pricing and strengthen their competitive position through intellectual property protections. Untapped opportunities lie in personalized nutrition, sustainable sourcing initiatives, and penetration into emerging markets. Additionally, strong regulatory compliance capabilities provide a competitive advantage in highly-regulated markets such as Japan and Australia.
Asia Pacific Collagen Industry Leaders
-
Hangzhou Nutrition Biotechnology Co. Ltd .
-
Jiangxi Cosen Biochemical Co., Ltd.
-
Nitta Gelatin, NA Inc.
-
Gelita AG
-
Tessenderlo Group
- *Disclaimer: Major Players sorted in no particular order
Asia Pacific Collagen Market Companies Covered in this Report
- Gelita AG
- Rousselot / Peptan
- Nitta Gelatin Inc.
- Darling Ingredients
- Thai Union Ingredients
- Nestlé Health Science (Vital Proteins)
- TCI Co. Ltd.
- Titan Biotech Ltd.
- Hangzhou Nutrition Biotechnology
- Shiseido Co. Ltd.
- AmorePacific Corp.
- Weishardt Group
- Cargill — Beauty & Health Solutions
- Ori Bionature (Malaysia)
- Nature’s Bounty (Co. of The Bountiful Co.)
- Optimum Nutrition (Glambia)
- GNC Holdings
- The Clorox Company (NeoCell)
- Verisol / Gelita brand
- Collagen Solutions plc
Market Opportunities and Future Outlook
A major opportunity is tightening standardization and quality differentiation as China implements GB/T 45992-2025 from August 1, 2026. The standard formalizes technical and test requirements for collagen and its hydrolysates, which increases the value of suppliers that can maintain consistent peptide specifications across batches. This dovetails with premiumization already visible in Japan and other regulatory-intensive markets, where science-backed formats and compliant claims drive commercial execution.
On the supply side, announced capacity additions and new facilities create room for regional sourcing, shorter lead times, and more application-specific peptide offerings. Nitta Gelatin disclosed plans to expand collagen peptide production capacity from 1,150 tons/year to 1,800 tons/year (May 2026), while Gelita described Gelita Liaoyuan Gelatine in Jilin, China as its largest global gelatin base with 11,000 tons annual capacity (April 2026), reinforcing China’s role as a manufacturing anchor for regional consumption and export channels. Product positioning is also widening, including Songji Biotech’s launch of 1,000-Dalton marine collagen peptides from milkfish scales (January 2026) aimed at food and cosmetic applications, and investment activity tied to differentiated processing and localization, such as Australia-based Holista Colltech and Swang Chai Chuan forming Ovicoll Pty Ltd to fund a nano-collagen facility in Collie, Western Australia (May 2026).
Recent Industry Developments in Asia Pacific Collagen Market
- May 2026: Nitta Gelatin Inc. announced an expansion of collagen peptide production capacity, increasing targeted output from 1,150 tons per year to 1,800 tons per year. The expansion strengthens supply availability for regional formulators and supports larger-volume programs in supplements and functional foods, where consistent peptide specifications and delivery reliability influence supplier selection. It also reflects Nitta Gelatin's commitment to expanding APAC manufacturing capacity to better serve the region.
- July 2025: Chiyoda Corporation launched Japan's first Plant Biofoundry in Yokohama as a NEDO-backed demonstration platform for plant bio-manufacturing, including human type II collagen produced in tobacco plants. The facility adds an in-region pathway for animal-free collagen R&D and scale-up, increasing competitive pressure on traditional sourcing for selected high-value use cases. The project points to Japan's growing emphasis on domestic innovation ecosystems to bolster high-value bioprocessing capabilities.
- June 2024: Glanbia Nutritionals launched Collameta, a high-potency collagen tripeptide ingredient, in partnership with Jellice Co. The ingredient's focus on absorption and efficacy supports premium formulation strategies across APAC supplement and beauty-from-within brands, while also encouraging more precise peptide engineering and differentiated claims substantiation. The collaboration illustrates accelerating product differentiation in the APAC collagen market.
Asia Pacific Collagen Market Report Scope and Research Methodology
Market Definition and Coverage
This market covers the value of collagen sold across Asia Pacific for use in food and beverage, dietary supplements, personal care, pharmaceuticals, and related uses, counted at the point where collagen is commercially supplied into these channels.
Scope exclusions: We exclude downstream finished products where collagen is only one ingredient and the full product price would overstate collagen value.
Segments Covered in This Report
- By Source
- Animal-based
- Marine-based
- By End User / Application
- Food & Beverages
- Dietary Supplements
- Personal Care & Cosmetics
- Pharmaceuticals
- Animal Nutrition
- By Geography
- Japan
- China
- India
- Australia
- Rest of Asia Pacific
Data Sources, Market Sizing, and Validation
Desk Research
Desk work was used to map the regional demand pool and to anchor assumptions that are easy to trace. We reviewed public sources such as national trade and customs statistics, food safety and pharmaceutical regulator publications, industry association releases, and peer reviewed papers that discuss collagen extraction, yields, and end use performance.
To make the numbers practical for sizing, company annual reports, investor presentations, and reputable press were checked for capacity additions, plant utilization signals, and product positioning by source type (animal based and marine based). In a few places, a paid subscription for company financials and a patent database were used to cross check scale indicators and innovation intensity, and then the assumptions were adjusted if they did not line up. These desk research sources are illustrative and not exhaustive, and many other public materials were used for data collection, validation, and clarification.
Primary Interviews and Surveys
Primary interviews and surveys were run to test what desk sources cannot fully show, like current pricing behavior, mix shifts by application, and how demand differs across China, Japan, India, Australia, South Korea, and the rest of Asia Pacific. We spoke with a spread of raw material suppliers, ingredient distributors, brand and contract manufacturing teams, and informed buyers across food, supplements, and personal care so the model reflects how collagen is actually purchased and specified.
Distribution of primary research fieldwork respondents
| Company type | Respondent position |
|---|---|
| Top tier: 27% | CXOs: 12% |
| Mid tier: 59% | Functional/Unit leaders: 43% |
| Smaller Players: 14% | Managers: 45% |
Market-Sizing & Forecasting
Sizing starts with a top-down build where production, trade flows, and end use penetration are used to reconstruct the collagen demand pool by major countries and applications, and then converted into value using observed price bands. When the structure is in place, selective bottom-up checks are run using sampled supplier revenues, channel feedback on volumes, and ASP times volume sanity checks, which are then used to correct any over or under counting.
A few inputs that materially move the model include imports and exports of collagen and related ingredients, output trends in supplements and functional foods, personal care category momentum, shifts between animal based and marine based supply, and the typical price premium for higher purity or specialty grades. Where local data is thin, gaps are handled by using neighboring country proxies and primary feedback on mix and pricing, before the totals are rebalanced to match known trade and consumption signals.
For forecasting, we rely mainly on scenario analysis supported by simple trend fitting, since demand is pulled by both consumer categories and regulatory acceptance. Assumptions on application growth, price progression, and mix shifts are reviewed with primary respondents so the 5 year outlook stays realistic and can be repeated when new year data becomes available.
Data Validation & Update Cycle
Checks are done in layers so the numbers do not depend on one data point. Outputs are compared against independent signals like trade direction, capacity additions, and observable demand strength in supplements and personal care, and then any large variances are investigated before sign-off.
If a value looks inconsistent, we recheck the underlying assumption, revisit the conversion logic, and recontact a subset of respondents to confirm whether a temporary factor such as a price spike or supply disruption is involved. Reports are refreshed annually, with interim updates when a material event impacts supply, regulations, or pricing, and a final pre-delivery review is completed so clients receive the latest view.
Mordor Intelligence's Asia Pacific Collagen Market Estimate Compared With Other Published Estimates
Published market sizes for collagen in Asia Pacific often do not match because the scope and counting point are not the same, and the base year timing can shift the result by a lot in a market with changing prices. Differences also come from how firms treat country coverage, which end uses are included, and whether the estimate is built from demand signals or from a broader ingredient and derivative basket.
In this study, the key gap drivers are whether gelatin and adjacent collagen derivatives are blended into one total, how mixed use categories like healthcare and biomaterials are allocated, and what is assumed for average selling price progression across animal based and marine based supply. A spread also shows up when some estimates use older base years, apply aggressive growth assumptions, or convert currencies using a single point rate rather than an average across the year.
Benchmark comparison
| Source | Market Size | Gaps in Research Methodology |
|---|---|---|
| Mordor Intelligence | USD 3.41 B (2025) | |
| Global Research Publisher A | USD 2.20 B (2023) | Uses an earlier base year and a different country list, and the value capture can shift if parts of medical and specialty collagen are counted under broader biomaterial and formulation buckets. |
| Industry Research Group B | USD 1.30 B (2024) | Lower total is consistent with narrower value capture and more conservative price and mix assumptions, especially if specialty grades and some non-core uses are not fully counted. |
The table shows that year selection and what gets counted as collagen revenue are the main reasons the totals diverge. By tying value to application level demand signals and then stress testing prices and mix with interviews across the region, the estimate stays traceable to practical inputs, which is the approach applied by Mordor Intelligence.
Key Questions Answered in the Report
What is the projected value of the Asia Pacific collagen market in 2031?
The region is expected to reach USD 6.02 billion by 2031, up from USD 3.75 billion in 2026.
Which source category is growing fastest in regional collagen demand?
Marine-based collagen is forecast to post a 10.28% CAGR between 2026-2031 due to sustainability and hypoallergenic positioning advantages.
Which country shows the highest growth momentum for collagen products?
India is projected to grow at an 11.38% CAGR, powered by expanding middle-class incomes and preventive-health adoption.
Which application currently generates the largest revenue?
Personal care and cosmetics command the largest share at 41.85% of 2025 regional revenue.