Market Overview
| Study Period | 2020 - 2031 |
|---|---|
| Forecast Data Period | 2026 - 2031 |
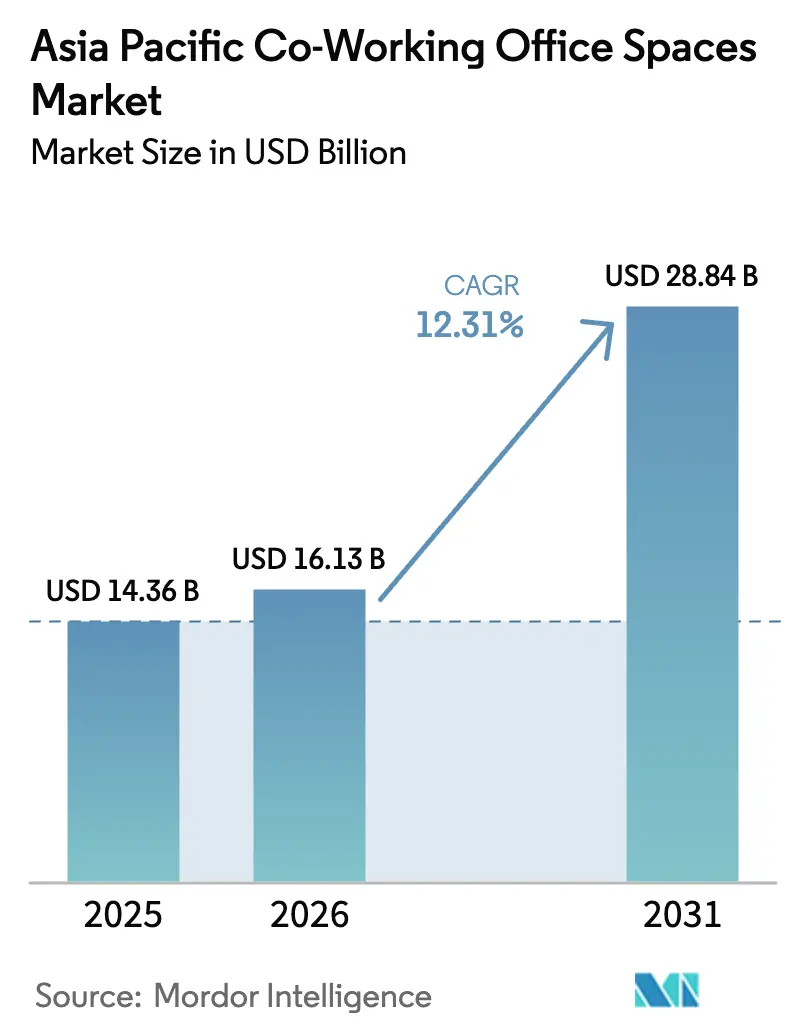
| Base Year Market Size (2025) | USD 14.36 Billion |
| Market Size (2026) | USD 16.13 Billion |
| Market Size (2031) | USD 28.84 Billion |
| Growth Rate (2026 - 2031) | 12.31% CAGR |
| Market Concentration | Low |
Major Players *Disclaimer: Major Players sorted in no particular order Image © Mordor Intelligence. Reuse requires attribution under CC BY 4.0. | |
Asia Pacific Coworking Office Spaces Market Analysis by Mordor Intelligence
Asia Pacific co-working office space market size in 2026 is estimated at USD 16.13 billion, growing from 2025 value of USD 14.36 billion with 2031 projections showing USD 28.84 billion, growing at 12.31% CAGR over 2026-2031. This expansion signals a decisive shift from conventional leases toward flexible workspace solutions as hybrid work practices become standard across corporations. Continual urbanization, growing venture-capital funding, and government innovation programs are reinforcing demand, while international operators scale quickly through capital-light franchise models. Technology integration—from access-control platforms to workspace analytics—allows providers to optimize utilization and deliver enterprise-grade service levels. Together, these forces anchor the Asia Pacific co-working office space market on a long-term growth path[1]Asian Development Bank, “Asian Development Outlook 2024,” adb.org.
Key Report Takeaways
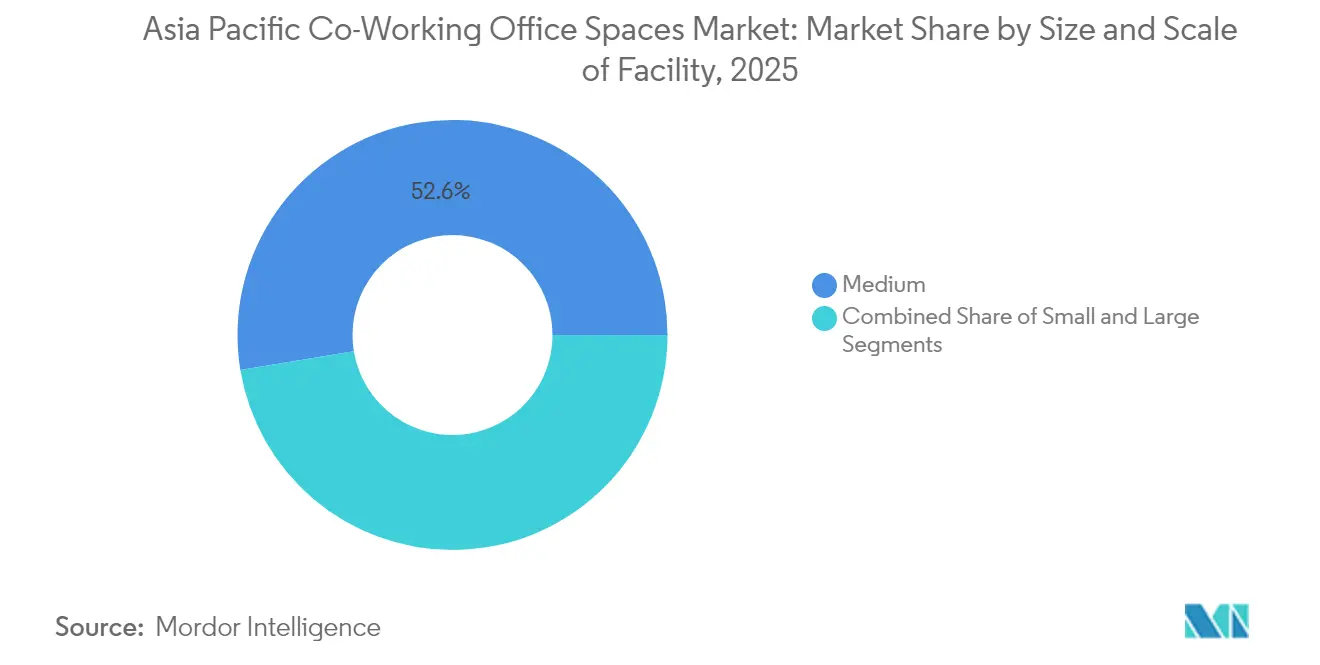
- By size & scale of facility, medium-sized centers captured 52.60% of the Asia Pacific co-working office space market share in 2025, whereas large centers are advancing at a 13.02% CAGR through 2031.
- By sector, information technology led with 42.10% revenue share in 2025 and is accelerating at a 13.08% CAGR to 2031.
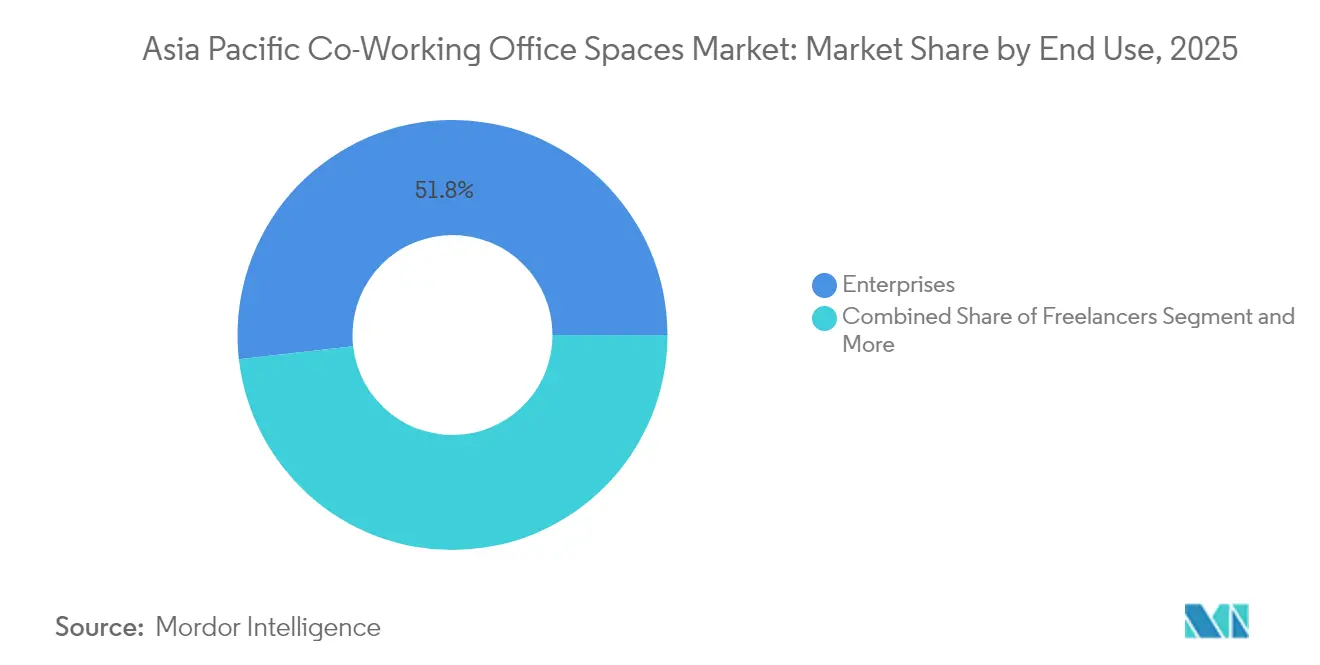
- By end use, enterprises held 51.80% of the Asia Pacific co-working office space market share in 2025, while start-ups are forecast to grow at a 13.52% CAGR.
- By country, China commanded 28.70% of 2025 revenue, whereas India is expanding at a 13.72% CAGR through 2031.
Note: Market size and forecast figures in this report are generated using Mordor Intelligence’s proprietary estimation framework, updated with the latest available data and insights as of 2026.
Asia Pacific Coworking Office Spaces Market Trends and Insights
Drivers Impact Analysis*
| Driver | (~) % Impact on CAGR Forecast | Geographic Relevance | Impact Timeline |
|---|---|---|---|
| Rapid urbanization and start-up growth in China, India, and Southeast Asia fueling demand | 3.2% | China, India, Southeast Asia core markets | Medium term (2-4 years) |
| Widespread adoption of hybrid work models across corporates and MNCs | 2.8% | Global, with concentration in developed APAC markets | Short term (≤ 2 years) |
| International and regional co-working operators aggressively expanding across APAC cities | 2.1% | APAC core, spill-over to secondary cities | Medium term (2-4 years) |
| Government innovation programs and tech parks supporting co-working ecosystems | 1.9% | National programs with early gains in Singapore, Malaysia, Philippines | Long term (≥ 4 years) |
| Growing tenant preference for flexible, scalable, and community-driven workspaces | 1.7% | Global, particularly strong in tier-1 APAC cities | Medium term (2-4 years) |
| Source: Mordor Intelligence | |||
Rapid urbanization and start-up growth
Rapid urbanization and the growth of start-ups are reshaping the demand for flexible office spaces in the Asia Pacific region. Entrepreneurs are increasingly drawn to fast-growing metropolitan areas in China, India, and Southeast Asia, seeking agile real estate solutions. National initiatives, such as Indonesia's "1000 Digital Startups" and Malaysia's Digital Hub scheme, offer tax breaks, broadband subsidies, and mentoring, steering early-stage firms into professionally managed spaces. Operators benefit from a steady stream of seed-funded tenants, attracted by flexible terms amidst unpredictable headcount scaling. The concentration of these hubs in tier-1 and emerging tier-2 cities not only boosts occupancy but also solidifies long-term demand visibility. As venture ecosystems mature, the Asia Pacific co-working office space market is supported by a robust demand engine[2]Infocomm Media Development Authority, “Digital Connectivity Blueprint 2024,” imda.gov.sg.
Hybrid work model adoption
The hybrid work model is transforming workplace dynamics, blending flexibility with operational efficiency. Corporate policies are increasingly integrating both office and remote workdays, leading to a reduction in dedicated desk ratios and a rise in collaborative spaces. According to a 2024 survey by CBRE, 60% of firms in the region report stable attendance, with peak utilization surpassing 80%. This highlights the operational maturity of these hybrid models. Flexible spaces allow for swift capacity adjustments without straining balance sheets. As a result, occupiers are designating larger portions of their portfolios to third-party workspaces. In response to evolving usage patterns, providers are fine-tuning their layouts, introducing hot desks, meeting pods, and event lounges. Consequently, while the total occupied area per employee may be shrinking, the baseline demand for hybrid workspaces remains robust.
Operator network expansion
The co-working office space market in the Asia Pacific region is witnessing significant growth driven by operator network expansion. Global brands are strategically expanding their presence in primary and secondary cities through management contracts and franchises. This approach not only reduces capital exposure but also enhances accessibility for members. In 2023 alone, IWG made a significant move by adding 867 locations across the Asia Pacific. Meanwhile, The Executive Centre has expanded its network by an impressive 60% since 2019, all while maintaining a robust 90% occupancy rate. Such extensive coverage facilitates cross-city passes, drawing in mobile professionals and teams from multinational corporations. Furthermore, this scale amplifies purchasing power, allowing for better fit-out materials and digital platforms. As a result, margins improve, solidifying their competitive edge in the Asia Pacific co-working office space market.
Government innovation programs
Governments in Southeast Asia are leveraging innovative programs to foster growth in the digital economy. Recognizing their potential, Southeast Asian states are incorporating flexible work hubs into tech-park blueprints, viewing them as essential for driving digital-economy job growth. Singapore’s Infocomm Media Development Authority, Malaysia's Digital Economy Corporation, and the Philippines’ National Development Company are embedding co-working nodes within their funded accelerators, ensuring a steady anchor demand. These public programs, through long-term leases, not only stabilize revenue streams but also pave the way for more favorable financing terms for operators. Moreover, by bundling regulatory assurances with these initiatives, they significantly mitigate market-entry risks, further spurring supply expansion.
Restraints Impact Analysis*
| Restraints | (~) % Impact on CAGR Forecast | Geographic Relevance | Impact Timeline |
|---|---|---|---|
| Oversupply risks in mature markets like China and India creating pricing pressures | -2.3% | China, India, mature tier-1 cities | Short term (≤ 2 years) |
| Regulatory and compliance challenges across diverse APAC jurisdictions | -1.8% | APAC core, particularly complex in China, India, Southeast Asia | Medium term (2-4 years) |
| High fit-out and operational costs impacting profitability for operators in premium locations | -1.4% | Premium locations in Singapore, Tokyo, Hong Kong, Sydney | Medium term (2-4 years) |
| Source: Mordor Intelligence | |||
Oversupply in mature cities
The oversupply of office spaces in mature cities is creating significant challenges for the flexible-space market. In cities like Beijing, Shanghai, Bengaluru, and Mumbai, a surge in conventional office completions is outpacing absorption rates. This imbalance is exerting pressure on yields in the flexible-space market. Providers locked into long leases are feeling the pinch as landlords offer discounts on face rents and corporate tenants push for renegotiations. As a result, there's a noticeable shift towards cautious expansion and a heightened emphasis on asset-light management agreements. Yet, operators who can consolidate with distressed rivals stand to benefit, securing favorable terms and bolstering their market presence, even if it drags on their short-term growth.
Regulatory compliance complexity
Regulatory compliance remains a critical consideration for businesses operating in the APAC region. Across the Asia-Pacific (APAC) region, labor codes, tax regulations, and data-privacy mandates vary significantly, making multi-country rollouts a challenge. New financial-technology regulations in Indonesia for 2024, along with updated workplace-safety directives in Singapore, are pushing workspace providers to revise their internal controls, leading to increased overhead costs. Companies without dedicated legal teams risk facing penalties and damage to their reputation, which can deter them from expanding across borders. On the other hand, larger networks equipped with strong governance structures can leverage their compliance expertise as a competitive advantage, effectively turning a challenge into an opportunity.
*Our forecasts treat driver/restraint impacts as directional, not additive. The impact forecasts reflect baseline growth, mix effects, and variable interactions.
Segment Analysis
By Size & Scale of Facility: Enterprise-Grade Growth Upshift
Large facilities of 30,000-plus square feet captured 13.02% CAGR momentum from 2026 onward, even though medium centers held 52.60% of 2025 revenue in the Asia Pacific co-working office space market. Enterprises favor these expansive sites because they deliver private zones, advanced cybersecurity, and seamless integration with corporate networks. Providers leverage size to introduce premium meeting suites and on-site data rooms that command higher yields. Medium centers still dominate because growth-stage firms and project teams value balanced cost and flexibility. Rising demand splits the footprint mix, pushing operators to maintain multi-format portfolios responsive to client scale and location.
Technology is redefining space planning across sizes. Takenaka Corporation’s GISTA system pairs biometric feedback with occupancy sensors, enabling managers to fine-tune HVAC settings and desk allocation in real time. Such analytics boost staff well-being and energy efficiency, sharpening competitive differentiation. Over the forecast horizon, the Asia Pacific co-working office space market size within large-format assets is projected to rise steadily as more multinational corporations shift from single-tenant leases to managed-space solutions.


By Sector: IT Commands Dual Leadership
Information technology tenants occupied 42.10% of floors in 2025 and will continue to drive the fastest 13.08% CAGR. Software developers, cloud-service integrators, and AI labs value high-spec connectivity and 24/7 access that co-working hubs readily provide. Operators tailor packages—private VLANs, redundant fiber pairs, and maker spaces—to match these demands. Financial-services players follow, embedding agile teams in flexible space to accelerate product sprints under stringent cybersecurity protocols. Professional-services consultancies round out the top tiers, using on-demand rooms for client workshops.
Generative AI uptake—reported by Deloitte at more than 60% of APAC employees—intensifies need for secure, collaboration-friendly environments. Providers installing GPU clusters and immersive screens attract tech tenants seeking turnkey innovation labs. Consequently, the Asia Pacific co-working office space market size allocated to IT firms is set to widen its lead, reinforcing the sector’s structural importance to operator revenue.
By End Use: Start-up Velocity Meets Enterprise Depth
Enterprises provided 51.80% of 2025 billings, underpinning predictable cash flow via multi-year agreements. Yet start-ups and early-stage ventures are charting a 13.52% CAGR, propelled by government accelerators and record venture capital inflows. Operators curate tiered membership plans—ranging from day passes to growth suites—and incubation events that align with founders’ scaling journeys. Freelancers and digital nomads furnish steady daytime occupancy, especially in lifestyle-oriented hubs that feature fitness, café, and community programming.
Balancing portfolio mix shields providers from cyclical shocks: enterprise downsizing can be offset by start-up expansions. Smartworks’ USD 12 million fundraise exemplifies investor appetite for operators straddling both segments with modular campuses and tech-enabled services. The Asia Pacific co-working office space market share of start-ups is therefore expected to edge higher, though corporates will remain the principal revenue anchor throughout the outlook period.
Geography Analysis
In 2025, China accounted for 28.70% of the market turnover, reflecting its strong economic base and extensive operator networks. Although the completion of new office spaces has extended absorption cycles, policy-driven innovation clusters, such as Shenzhen’s Qianhai free-trade zone, continue to support demand. Operators are increasingly focusing on suburban science parks due to moderate rents and government subsidies. Meanwhile, India, with a projected 13.72% CAGR through 2031, is positioned as the region's key growth driver. Factors such as growing IT offshoring, a large talent pool, and the Smart Cities mission are accelerating the adoption of managed workspaces in cities like Bengaluru, Hyderabad, and Gurgaon. Knight Frank predicts that built-up commercial stock will triple by 2034, aligning with operators’ expansion plans.
Japan, South Korea, and Australia represent a stable group where high market penetration ensures consistent but slower growth. In Japan, the DID-GLOBAL initiative, which integrates co-living and working, attracts the country’s 3.6 million foreign residents seeking a combined lifestyle. South Korea's Seoul Digital Foundation is advancing 5G-enabled smart offices to enhance infrastructure.
In Australia, the Landing Pads program directs scale-ups to key hubs like Melbourne and Sydney, maintaining demand in the premium segment. In the emerging ASEAN region, countries such as Indonesia, Vietnam, and the Philippines offer significant opportunities driven by youthful populations and improving broadband access. While providers face challenges from fragmented regulations in these markets, they benefit from first-mover advantages and favorable lease terms, highlighting the importance of a regionally diversified strategy in the Asia Pacific co-working office space market.
Competitive Landscape
The Asia-Pacific co-working office space market features a moderately competitive nature. IWG's revenue of USD 3.3 billion in 2023 highlights the benefits of an extensive network and franchise model that reduces capital expenditure. The Executive Centre operates at the premium end of the market, maintaining a strong 90% occupancy rate by combining high-quality fit-outs with concierge-style services. Local leaders, such as India's Smartworks, use city-cluster models to build a concentrated presence in key metropolitan areas, improving brand visibility and operational efficiency.
Strategic initiatives increasingly focus on technology and partnerships. IWG's collaboration with YOO introduces design-focused "club" workplaces that combine hospitality-inspired aesthetics with professional infrastructure, meeting the growing demand for experiential workspaces. Mitsubishi Estate's integration of Regus Japan into its real estate platform demonstrates how landlords secure consistent occupancy pipelines. Additionally, operators are partnering with government agencies to anchor innovation hub projects, aligning with public objectives and securing long-term leases. Over the forecast period, mergers and joint ventures are expected as companies aim for economies of scale and regulatory compliance in the Asia Pacific co-working office space market.
Technology plays a critical role in gaining a competitive advantage. Tools such as sensor networks, AI-driven scheduling, and mobile access enhance user experiences and optimize staffing levels. Early adopters leverage data insights for dynamic pricing and predictive maintenance, improving profitability. Providers that emphasize community-building—through mentorship programs, sector-specific accelerators, and social events—strengthen client retention, reducing churn even during periods of rental market volatility. These trends indicate that market leadership will depend on scale, technological capabilities, and ecosystem partnerships.
Asia Pacific Coworking Office Spaces Industry Leaders
IWG (Regus, Spaces)
WeWork
The Executive Centre (TEC)
JustCo
Awfis
- *Disclaimer: Major Players sorted in no particular order

Recent Industry Developments
- May 2025: The Philippines’ National Development Company revealed plans to scale its Philippine Innovation Hub, opening offices in 10 domestic regions and in global cities such as Singapore, Kuala Lumpur, Hong Kong, Dubai, and London. The new sites will give start-up MSMEs on-the-ground access to incubation and acceleration programs.
- April 2025: Japan-based DID-GLOBAL joined forces with The DECK to weave fully furnished rentals together with 24/7 coworking access, a concept aimed at the country’s 3.6 million foreign residents and other digital nomads.
- March 2025: Design house YOO teamed up with flexible-space giant IWG to roll out club-style workplaces, pairing boutique interiors with on-demand office services across key Asian markets.
- June 2024: Indian operator Smartworks raised USD 12 million in a round led by Ananta Capital and 45 other investors, funding the build-out of its 8 million-square-foot footprint that already serves more than 600 corporate clients.


Asia Pacific Coworking Office Spaces Market Report Scope
Co-working is an arrangement in which people from different companies share an office space. By streamlining equipment usage, we not only cut costs but also enhance accessibility for all. The report provides a comprehensive analysis of the Asia-Pacific co-working office space market, detailing an overview, segment-wise market size estimates, emerging trends, and the dynamics at play.
Asia-Pacific co-working office space market is segmented by end user (Information Technology (IT and ITES), BFSI (Banking, Financial Services and Insurance), business consulting and professional services, other services (retail, lifesciences, energy, legal services)), by user (freelancers, enterprises, start ups and others) and by geography (China, India, Japan, South Korea, Australia, and Rest of Asia-Pacific). The Report Offers the Asia-Pacific co-working office spaces market size and forecasts in dollars (USD) for all the above segments.
By Size & Scale of Facility
| Small |
| Medium |
| Large |
By Sector
| Information Technology (IT and ITES) |
| BFSI (Banking, Financial Services and Insurance) |
| Business Consulting & Professional Service |
| Other Services (Retail, Lifesciences, Energy, Legal Services) |
By End Use
| Freelancers |
| Enterprises |
| Start Ups and Others |
By Country
| China |
| India |
| Japan |
| South Korea |
| Australia |
| Indonesia |
| Rest of Asia-Pacific |
| By Size & Scale of Facility | Small |
| Medium | |
| Large | |
| By Sector | Information Technology (IT and ITES) |
| BFSI (Banking, Financial Services and Insurance) | |
| Business Consulting & Professional Service | |
| Other Services (Retail, Lifesciences, Energy, Legal Services) | |
| By End Use | Freelancers |
| Enterprises | |
| Start Ups and Others | |
| By Country | China |
| India | |
| Japan | |
| South Korea | |
| Australia | |
| Indonesia | |
| Rest of Asia-Pacific |


Key Questions Answered in the Report
How large is the Asia Pacific co-working office space market in 2026?
It totals USD 16.13 billion and is on track to reach USD 28.84 billion by 2031.
What is the forecast CAGR for flexible workspaces in Asia Pacific?
The market is projected to expand at a 12.31% CAGR between 2026 and 2031.
Which country is growing fastest for co-working in Asia Pacific?
India is forecast to grow at 13.72% annually through 2031, outpacing its regional peers.
Which sector occupies the most co-working space in the region?
Information technology companies account for 42.10% of current demand and remain the fastest-growing user group.
What facility size format is expanding quickest?
Large enterprise-grade centers above 30,000 square feet are registering a 13.02% CAGR as corporations shift into managed flexible solutions.
Who are the leading operators in the region?
IWG, The Executive Centre, and a mix of regional specialists such as Smartworks dominate, together controlling just over 60% of occupied inventory.
Page last updated on:


