Argentina Fertilizers Market Size and Share
Market Overview
| Study Period | 2021 - 2031 |
|---|---|
| Forecast Data Period | 2026 - 2031 |
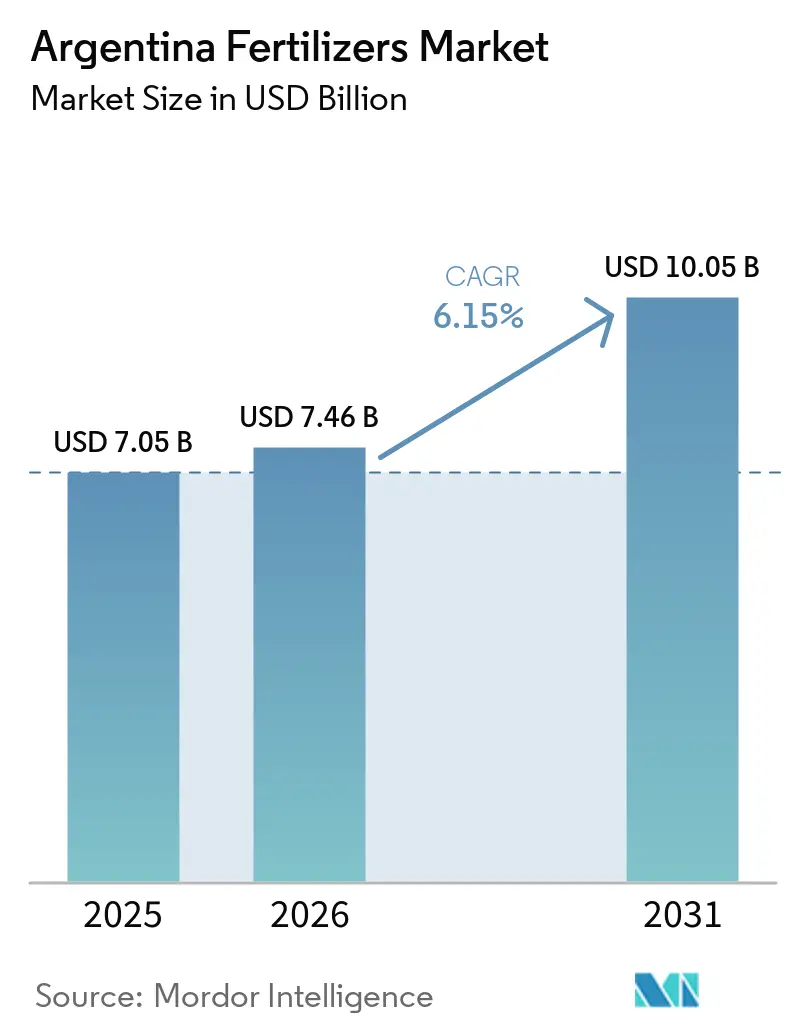
| Base Year Market Size (2025) | USD 7.05 Billion |
| Market Size (2026) | USD 7.46 Billion |
| Market Size (2031) | USD 10.05 Billion |
| Growth Rate (2026 - 2031) | 6.15% CAGR |
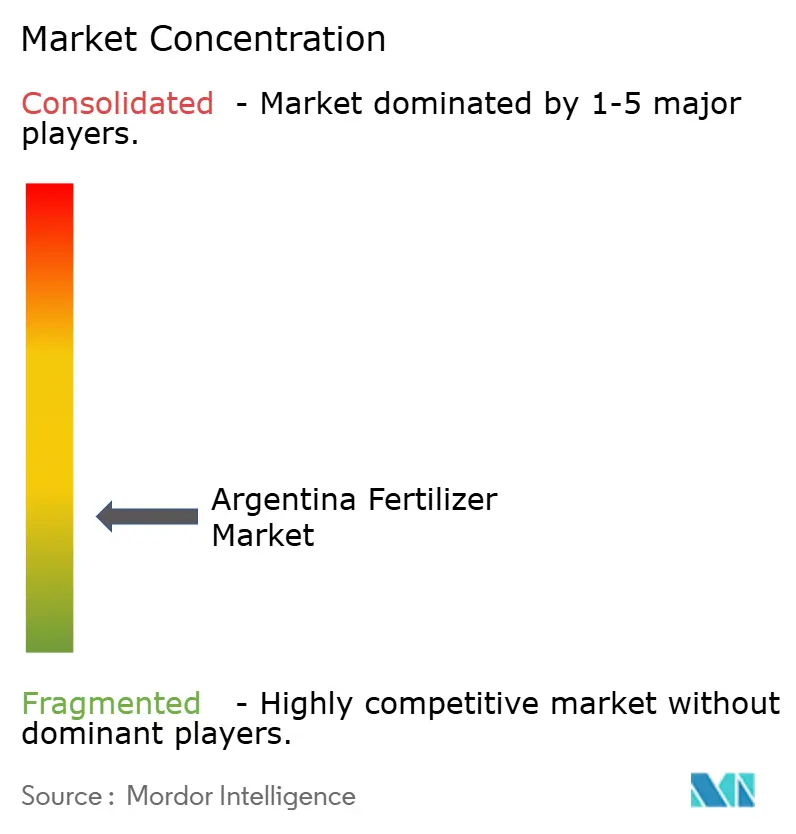
| Market Concentration | Low |
Major Players *Disclaimer: Major Players sorted in no particular order Image © Mordor Intelligence. Reuse requires attribution under CC BY 4.0. | |
Argentina Fertilizers Market Analysis by Mordor Intelligence
The Argentina fertilizers market size is projected to grow from USD 7.05 billion in 2025 to USD 7.46 billion in 2026 and is forecast to reach USD 10.05 billion by 2031 at 6.15% CAGR over 2026-2031. Robust grain and oilseed output, export-tax incentives, and a widening array of specialty nutrients keep demand on an upward trajectory even as currency volatility raises cost pressures. Greater soybean and wheat acreage, the launch of domestic nitrogen plants, and a streamlined registration pathway for specialty products are drawing new entrants and capital to the market. Import dependence for phosphorus and logistical bottlenecks on the Paraná-Paraguay waterway temper full-scale expansion, but technology-driven efficiencies in application and rising soil-testing adoption continue to improve nutrient-use effectiveness. Competitive dynamics are shifting toward service-embedded solutions that bundle agronomy advice, analytics, and biological additives, creating differentiated value propositions in the Argentina fertilizers market.
Key Report Takeaways
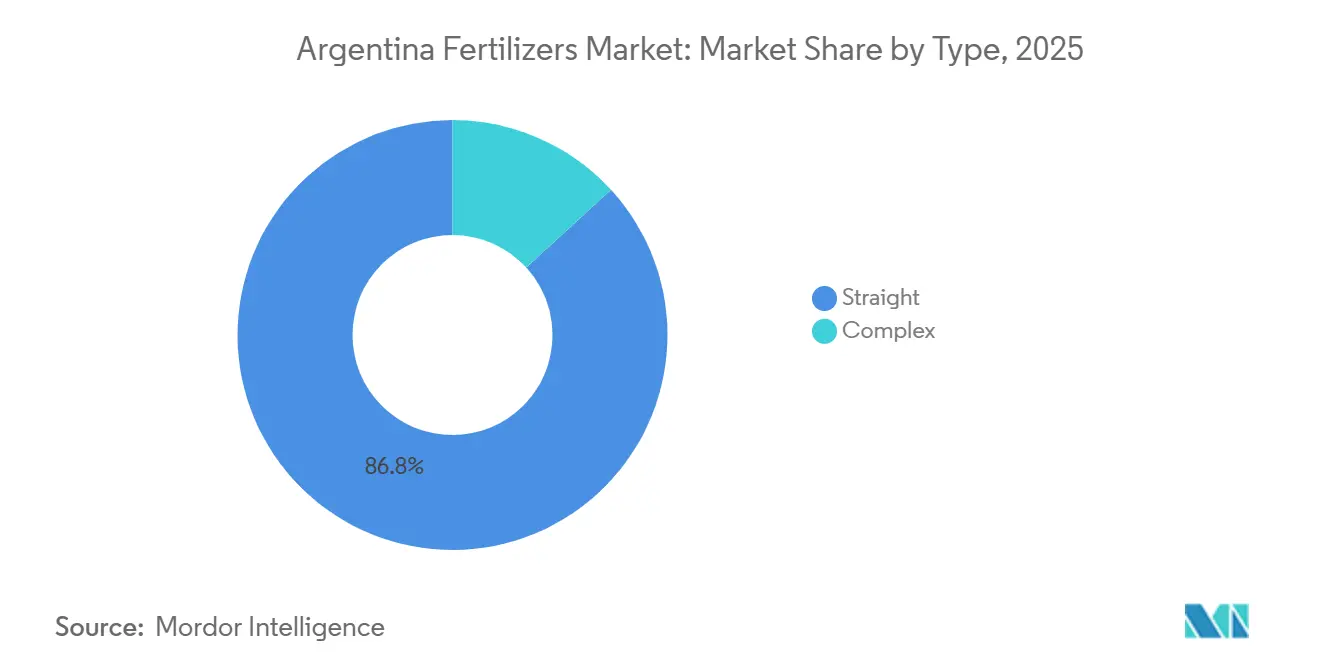
- By type, straight fertilizers accounted for the largest Argentina fertilizers market share, at 86.8%, in 2025, while complex fertilizers are projected to be the fastest-growing segment, advancing at a CAGR of 9.5% during 2026–2031.
- By form, conventional products held the largest Argentina fertilizers market size in 2025, accounting for 91.5% of the market, while specialty fertilizers are projected to be the fastest-growing segment, registering a CAGR of 6.6% through 2031.
- By application mode, soil application represented the largest share of the market in 2025, accounting for 93.6% of revenue, while fertigation is projected to be the fastest-growing application method, expanding at a CAGR of 6.5% during 2026–2031.
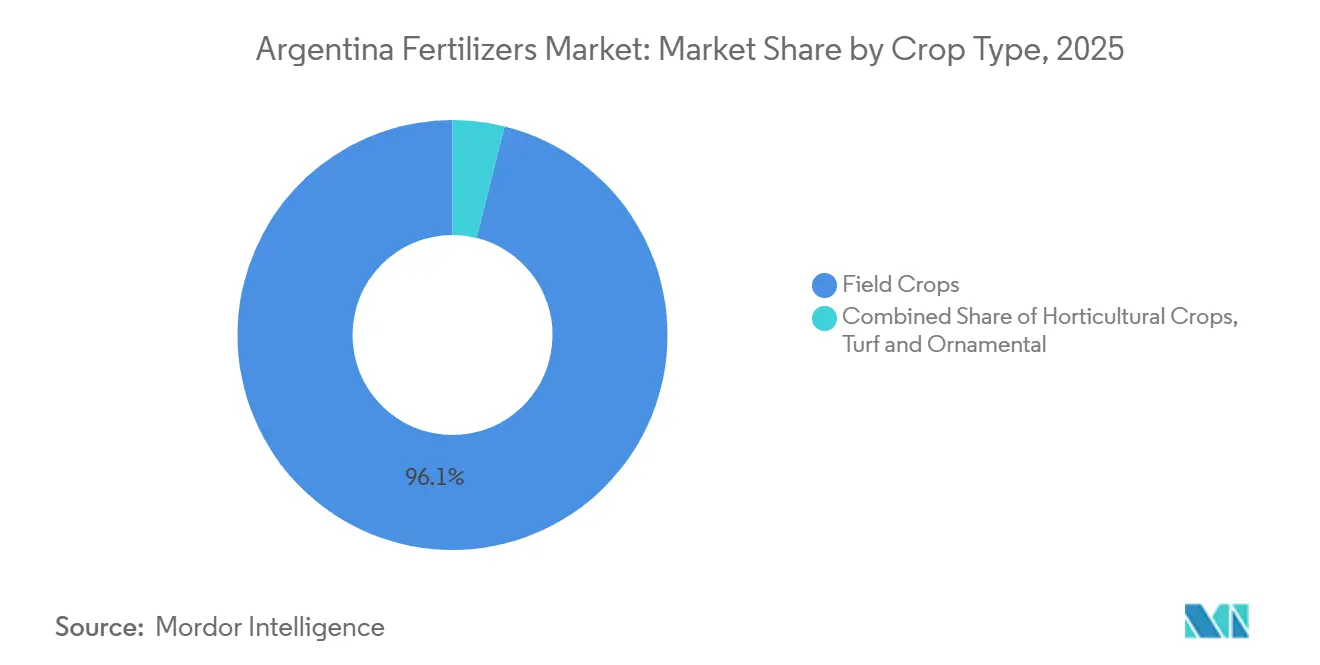
- By crop type, field crops accounted for 96.1% of market demand in 2025, while horticultural crops are projected to be the fastest-growing segment, advancing at a CAGR of 6.2% during 2026–2031.
Note: Market size and forecast figures in this report are generated using Mordor Intelligence’s proprietary estimation framework, updated with the latest available data and insights as of January 2026.
Argentina Fertilizers Market Trends and Insights
Drivers Impact Analysis*
| Driver | (~) % Impact on CAGR Forecast | Geographic Relevance | Impact Timeline |
|---|---|---|---|
| Export-tax cuts boosting nutrient affordability | +1.2% | Nationwide, early momentum in Buenos Aires, Córdoba, and Santa Fe | Short term (≤ 2 years) |
| Government fertilizer reimbursement for smallholders | +0.8% | Nationwide, small-farm clusters | Medium term (2-4 years) |
| Rising soybean and corn acreage | +1.5% | Pampas core, northern expansion areas | Medium term (2-4 years) |
| Surge in specialty-fertilizer registrations | +0.6% | Nationwide, National Service of Agri-Food Health and Quality (SENASA)-regulated | Long term (≥ 4 years) |
| Adoption of biological nitrification inhibitors (BNIs) | +0.4% | Field-crop zones, early uptake in Buenos Aires | Long term (≥ 4 years) |
| Blockchain-based produce traceability demanding nutrient disclosure | +0.3% | Export-oriented regions | Long term (≥ 4 years) |
| Source: Mordor Intelligence | |||


Export-Tax Cuts Boosting Nutrient Affordability
Argentina’s January 2025 reduction in export duties on soybeans, corn, wheat, and sunflower released an estimated USD 1.2 billion of farm cash flow that is now channeled into nutrient programs[1]Source: Ministry of Economy, “Reducción de Retenciones,” argentina.gob.ar. Growers capitalize on stronger liquidity to preload urea and DAP inventories ahead of planting windows, fortifying baseline demand in the Argentina fertilizers market. Higher export competitiveness stimulates production volumes that further enlarge the nutrient requirement per hectare. The policy also improves farm creditworthiness, lowering financing costs tied to fertilizers purchases. Although the stimulus is immediate, its structural influence endures so long as tax relief remains intact. Incremental demand is most pronounced in Buenos Aires, Córdoba, and Santa Fe where export-linked logistics are well established. The multiplier effect extends beyond immediate purchasing decisions, as sustained higher farm incomes encourage multi-year soil fertility investments that drive consistent fertilizer consumption growth.
Government Fertilizer Reimbursement for Smallholders
The Programa de Fortalecimiento de la Agricultura Familiar (PROMAF) subsidy program and complementary provincial initiatives demonstrate Argentina's strategic commitment to supporting smallholder nutrient access, with the USD 30 million "Programa de Aporte de Nutrientes 2023" directly subsidizing up to 5,000 kg of urea per producer for 77,000 beneficiaries. This targeted approach addresses the structural disadvantage small farms face in fertilizers procurement, where economies of scale typically favor large operations. Provincial programs like Río Negro's PAR Agroinsumos provide differentiated financing rates, creating a multi-tiered support system that extends beyond federal initiatives. The pay-in-grain credit instrument Pagaré Valor Producto links repayment to future harvest values, aligning input expenses with revenue cycles. Collectively, these levers extend addressable acreage and diversify the customer base inside the Argentina fertilizers market.
Rising Soybean and Corn Acreage
Argentina's agricultural expansion continues despite regional challenges, with soybean planted area increasing 7% to 44 million acres in 2024, while farmers strategically shift from corn production due to corn stunt disease pressures. This crop rotation dynamic creates distinct fertilizers demand patterns, as soybeans require different nutrient profiles compared to corn, particularly lower nitrogen needs due to biological fixation capabilities. The geographic concentration of 74% of production within 300 km of major ports (Gran Rosario, Quequén, Bahía Blanca) creates logistical efficiencies that reduce fertilizers distribution costs and improve application timing. The shift toward soybeans, while maintaining total planted area, may moderate nitrogen fertilizers demand growth while increasing requirements for phosphorus and potassium inputs. The expansion occurs against a backdrop of Argentina losing global export market share of 19% in recent seasons, suggesting that sustained acreage growth becomes critical for maintaining fertilizer market expansion.
Surge in Specialty-Fertilizer Registrations
National Agri-Food Health and Quality Service (SENASA's) accelerated product registration framework, including Resolution 431/2024 updating analytical testing procedures, has streamlined market entry for specialty fertilizers formulations and created pathways for innovative nutrient technologies. The regulatory modernization allows producers to utilize qualified national or international laboratories for required testing, reducing registration bottlenecks that previously delayed specialty product launches. Argentina's biological fertilizers sector demonstrates this regulatory evolution, with 824 registered inoculants and bio-fertilizers applied across 18-20 million hectares, representing approximately 50% of total cropland and growing at 11-15% annually. This regulatory facilitation positions Argentina as a testing ground for next-generation fertilizer technologies, potentially accelerating adoption rates for controlled-release, water-soluble, and biologicals segments.
Restraints Impact Analysis*
| Restraint | (~) % Impact on CAGR Forecast | Geographic Relevance | Impact Timeline |
|---|---|---|---|
| Peso devaluation raising import costs | -1.8% | All regions, acute in the interior | Short term (≤ 2 years) |
| Dependence on imported phosphorus | -1.1% | Nationwide | Medium term (2-4 years) |
| Freight-rail bottlenecks in the Pampas | -0.7% | Pampas core, interior corridors | Medium term (2-4 years) |
| Under-utilization of soil-testing services | -0.5% | Nationwide | Long term (≥ 4 years) |
| Source: Mordor Intelligence | |||
Peso Devaluation Raising Import Costs
Currency volatility remains the most immediate threat to Argentina's fertilizers market stability, with the peso's persistent weakness against the dollar inflating landed costs for the 75% of fertilizers that require importation. First-half 2025 fertilizers imports totaled 770,000 metric tons, representing a 17.5% increase in volume compared to the same period in 2024, yet the peso's devaluation meant total import costs rose disproportionately higher [2]Source: Argentina Customs Statistics, “Fertilizer Import Data 2025,” argentina.gob.ar. This currency pressure particularly affects phosphatic fertilizers sourced from Morocco, China, Russia, and the United States, where Argentina lacks domestic production capacity and must absorb foreign exchange fluctuations. The volatility creates procurement timing challenges for distributors and farmers, who must balance inventory carrying costs against the risk of further currency depreciation. Import-dependent regions face acute exposure, as transportation costs compound currency effects, making interior markets particularly vulnerable to price shocks that can delay or reduce fertilizers applications.
Dependence on Imported Phosphorus
Argentina's structural reliance on imported phosphorus compounds represents a strategic vulnerability that constrains long-term market development, with approximately 70% of phosphatic fertilizers sourced from Morocco and China where geopolitical tensions and supply chain disruptions can create sudden availability constraints. The absence of domestic phosphate mining operations leaves Argentina exposed to international price volatility and supply interruptions, as evidenced by recent global fertilizers market disruptions following geopolitical events. This dependency becomes more critical given that 54.4% of Argentina's cultivated area exhibits very low to low phosphorus levels (0-15 mg/kg), requiring an estimated 424,220 Mg of phosphorus annually compared to only 207,000 Mg consumed historically.
*Our forecasts treat driver/restraint impacts as directional, not additive. The impact forecasts reflect baseline growth, mix effects, and variable interactions.
Segment Analysis
By Type: Complex Fertilizers Drive Premium Growth
Straight fertilizers are the largest segment, accounting for 86.8% of the Argentine fertilizers market share in 2025. This growth differential reflects farmers' increasing sophistication in nutrient management, as complex formulations offer balanced NPK ratios that reduce application complexity and improve nutrient use efficiency. Straight fertilizers continue to dominate in Argentina, where large-scale farming operations prefer bulk purchasing of individual nutrients such as urea, DAP, and MAP for customized blending programs. Within straight fertilizers, nitrogenous products led by urea represent the largest subsegment, supported by Argentina's domestic production capacity at Profertil's 1.3 million metric ton Bahía Blanca facility.
Complex fertilizers represent the fastest-growing segment, with a 9.5% CAGR through 2026-2031. Several factors, including the increasing adoption of balanced crop nutrition practices and the rising demand for multi-nutrient fertilizer solutions, drive this growth trajectory. Complex fertilizers offer advantages such as uniform nutrient distribution, improved nutrient uptake efficiency, and reduced application costs. The segment's growth is further supported by technological advancements in fertilizer manufacturing, which enable the production of customized nutrient combinations tailored to specific crop requirements and soil conditions.


By Form: Specialty Segments Gain Precision Agriculture Traction
Conventional fertilizers maintain the largest 91.5% market share in 2025. This substantial market presence can be attributed to several factors, including the segment's cost-effectiveness, widespread availability, and established distribution networks. Conventional fertilizers are particularly prevalent in field crop applications, where they play a crucial role in supporting Argentina's extensive agricultural operations. The segment's dominance is further reinforced by farmers' familiarity with traditional fertilizer applications and their proven effectiveness in enhancing crop yields. Primary nutrients, particularly nitrogen-based fertilizers, account for a significant share of total fertilizer consumption, especially in major crops such as soybeans, corn, and wheat.
Specialty forms are the fastest-growing segment, with a 6.6% CAGR through 2031. The specialty fertilizer segment is a growing niche in Argentina fertilizer market, characterized by innovative products such as controlled-release, water-soluble, and liquid fertilizers. This segment is gaining traction among farmers who are increasingly recognizing the benefits of precision agriculture and sustainable farming practices. Specialty fertilizers offer enhanced nutrient efficiency, reduced environmental impact, and improved crop quality, making them particularly valuable for high-value crops and controlled environment agriculture. The segment's growth is supported by technological advancements in fertilizer formulations and application methods, as well as increasing awareness about environmental sustainability.
By Application Mode: Fertigation Emerge Despite Soil Dominance
Soil application was the largest segment, accounting for 93.6% of the Argentina fertilizer market size in 2025, reflecting Argentina's extensive grain and oilseed production systems, where broadcast and banded applications efficiently cover large acreages. The dominance of soil application can be attributed to its adaptability to diverse crops, soil types, and environmental conditions. Broadcasting, placement, and localized placement are the primary methods used in soil application, with broadcasting the most common way to apply nutrients. The method's popularity is further reinforced by its cost-effectiveness, ease of application, and the ability to provide uniform nutrient distribution throughout the root zone. Additionally, soil application methods are particularly advantageous due to their compatibility with conventional farming practices and with Argentina's existing agricultural infrastructure.
Fertigation application is the fastest-growing mode, with a 6.5% CAGR through 2031, driven by the growing adoption of precision agriculture practices and modern irrigation systems. Fertigation delivers nutrients directly to the root zone of crops, ensuring efficient uptake and utilization of fertilizers. Fertigation applications serve specialized horticultural operations and irrigated crop systems, where water-soluble fertilizers enable precise nutrient timing and concentration control. The evolution of application modes reflects Argentina's agricultural sophistication, as farmers adopt multiple delivery methods to optimize nutrient use efficiency and address specific crop requirements.
By Crop Type: Field Crops Dominance Reflects Export Agriculture
Field crops, the largest segment, accounted for 96.1% of the fertilizer consumption in 2025, reflecting Argentina's position as a major global grain and oilseed exporter. Soybeans, corn, wheat, and sunflower represent the primary demand drivers, with soybean area expansion of 7% to 17.8 million hectares in 2024 from about 16.5 million hectares in the previous season, creating substantial nutrient requirements despite the crop's biological nitrogen fixation capabilities[3]Source: USDA Foreign Agricultural Service, “Grain and Feed Annual – Argentina,” usda.gov. The crop type distribution reflects Argentina's comparative advantage in extensive agriculture, where field crops benefit from favorable climate, soil conditions, and established export infrastructure. Wheat production particularly benefits from government support programs, with the USD 30 million "Programa de Aporte de Nutrientes 2023" specifically targeting wheat and corn producers through direct fertilizer subsidies. Corn production faces challenges from corn stunt disease, leading to strategic shifts toward soybean production that alter nutrient demand patterns.
Horticultural crops are projected to grow at the fastest rate, with a projected CAGR of 6.2% during 2026-2031. This growth is primarily driven by significant advancements in Argentina's irrigation infrastructure. Over the 24 months leading up to 2025, the country added more than 63,000 hectares under irrigation, supported by private investments exceeding USD 185 million in pivot and drip systems. The adoption of drip irrigation is particularly impactful because it integrates seamlessly with fertigation, shifting nutrient demand toward water-soluble and liquid formulations rather than bulk granular inputs. The National Food Safety and Quality Service (SENASA), through Resolución 431/2024, subsequently refined by Resolución 214/2025, simplified the fertilizer registration process by automating certification for products already approved in high-regulation markets. This has reduced market-entry costs for international specialty nutrition brands targeting the Argentine horticulture market. While turf and ornamental applications account for a small share of total volume, the Buenos Aires metropolitan corridor maintains steady demand for controlled-release granular formulations in amenity and residential uses.
Geography Analysis
Argentina's fertilizers market exhibits strong geographic concentration, with Buenos Aires, Córdoba, and Santa Fe provinces accounting for over 90% of soybean production and 80-90% of corn and wheat cultivation, creating dense fertilizers demand clusters that optimize distribution economics and supply chain efficiency. The Pampas region's agricultural dominance stems from superior soil quality, favorable climate conditions, and proximity to export infrastructure, with 74% of major crop production occurring within 300 km of key ports including Gran Rosario, Quequén, and Bahía Blanca.
Northern provinces, including Santiago del Estero, Chaco, and Salta, represent emerging agricultural frontiers where crop area expansion drives incremental fertilizers demand growth, though these regions face higher distribution costs due to distance from import terminals and limited rail infrastructure. The Belgrano, San Martín, and Urquiza rail lines, totaling 9,100 km of operational track, serve 17 provinces with a limited rolling stock of 170 locomotives and 7,060 wagons, creating capacity constraints that particularly affect interior regions.
Road transport dominates fertilizers distribution with over 90% modal share, yet the 2,900,000 trucks projected for 2024 operations create congestion and cost pressures that affect interior market pricing. Southern regions including Patagonia maintain specialized agricultural systems focused on livestock and limited cropping, generating modest fertilizer demand primarily for pasture improvement and horticultural applications. The geographic analysis reveals Argentina's fertilizers market as fundamentally driven by the Pampas agricultural core, with growth opportunities in northern expansion areas constrained by infrastructure limitations and distribution economics.
Competitive Landscape
The Argentina fertilizers market is moderately fragmented, with top players holding a significant share in 2025. Bunge Global SA, Yara International ASA, Nutrien Ltd., EuroChem Group AG, and Grupa Azoty S.A. (Compo Expert) maintain significant market positions through their extensive distribution networks and diverse product portfolios. These multinational corporations leverage their research capabilities and technological expertise to offer innovative solutions while maintaining strong relationships with local agricultural communities. The market's fragmentation is further evidenced by numerous medium-sized players that focus on specific product segments or regional markets, creating a dynamic competitive environment.
The fertilizers market in Argentina is characterized by companies actively pursuing innovation and strategic expansion initiatives. Product innovation remains a key focus, with companies developing specialized coated micronutrient fertilizers and environmentally sustainable solutions to meet evolving agricultural needs. Operational agility is demonstrated through investments in logistics networks and manufacturing facilities, enabling companies to maintain consistent supply chains despite market volatility.
Strategic partnerships and collaborations with agricultural technology providers have become increasingly common, allowing companies to enhance their service offerings and market reach. Companies are also expanding their presence through strategic acquisitions and the development of distribution networks, particularly in key agricultural regions. These consolidated efforts reflect the industry's commitment to addressing the growing demand for efficient fertilizer solutions while maintaining competitive advantages in the market.
Argentina Fertilizers Industry Leaders
Yara International ASA
Nutrien Ltd.
Grupa Azoty S.A. (Compo Expert)
Bunge Global SA
EuroChem Group AG
- *Disclaimer: Major Players sorted in no particular order

Recent Industry Developments
- June 2026: Argentina Potash, an Argentinian potash exploration company, received financing approval of USD 4.07 million from the US International Development Finance Corporation (DFC) for its El Ceibo project in the Neuquen Basin. The El Ceibo project has an inferred mineral resource of 1.6 million metric tons of sylvinite and an estimated 391 million metric tons of potash (MOP), making it one of the largest potash deposits in South America.
- June 2026: Tether has entered Argentina's fertilizer market by leveraging its majority ownership of the agricultural company Adecoagro. In a significant USD 600 million transaction, Adecoagro secured full ownership of Profertil SA, the largest nitrogen fertilizer producer in Argentina.
- November 2025: Yara International ASA, a global leader in crop nutrition solutions, has inaugurated a new solid fertilizer coating unit in Argentina, in collaboration with its distributor Agronort. The technology is considered "innovative" and allows granular fertilizers to be coated with essential micronutrients, such as zinc, in a segment that typically focuses on macronutrients like nitrogen and phosphorus.


Argentina Fertilizers Market Report Scope
Complex, Straight are covered as segments by Type. Conventional, Speciality are covered as segments by Form. Fertigation, Foliar, Soil are covered as segments by Application Mode. Field Crops, Horticultural Crops, Turf & Ornamental are covered as segments by Crop Type.| Complex | ||
| Straight | Micronutrients | Boron |
| Copper | ||
| Iron | ||
| Manganese | ||
| Molybdenum | ||
| Zinc | ||
| Others | ||
| Nitrogenous | Urea | |
| Others | ||
| Phosphatic | DAP | |
| MAP | ||
| SSP | ||
| TSP | ||
| Potassic | MoP | |
| SoP | ||
| Others | ||
| Secondary Macronutrients | Calcium | |
| Magnesium | ||
| Sulfur | ||
| Conventional | |
| Speciality | CRF |
| Liquid Fertilizer | |
| SRF | |
| Water Soluble |
| Fertigation |
| Foliar |
| Soil |
| Field Crops |
| Horticultural Crops |
| Turf & Ornamental |
| Type | Complex | ||
| Straight | Micronutrients | Boron | |
| Copper | |||
| Iron | |||
| Manganese | |||
| Molybdenum | |||
| Zinc | |||
| Others | |||
| Nitrogenous | Urea | ||
| Others | |||
| Phosphatic | DAP | ||
| MAP | |||
| SSP | |||
| TSP | |||
| Potassic | MoP | ||
| SoP | |||
| Others | |||
| Secondary Macronutrients | Calcium | ||
| Magnesium | |||
| Sulfur | |||
| Form | Conventional | ||
| Speciality | CRF | ||
| Liquid Fertilizer | |||
| SRF | |||
| Water Soluble | |||
| Application Mode | Fertigation | ||
| Foliar | |||
| Soil | |||
| Crop Type | Field Crops | ||
| Horticultural Crops | |||
| Turf & Ornamental | |||


Market Definition
- MARKET ESTIMATION LEVEL - Market Estimations for various types of fertilizers has been done at the product-level and not at the nutrient-level.
- NUTRIENT TYPES COVERED - Primary Nutrients: N, P and K, Secondary Macronutrients: Ca, Mg and S, Micronutients: Zn, Mn, Cu, Fe, Mo, B, and Others
- AVERAGE NUTRIENT APPLICATION RATE - This refers to the average volume of nutrient consumed per hectare of farmland in each country.
- CROP TYPES COVERED - Field Crops: Cereals, Pulses, Oilseeds, and Fiber Crops Horticulture: Fruits, Vegetables, Plantation Crops and Spices, Turf Grass and Ornamentals
| Keyword | Definition |
|---|---|
| Fertilizer | Chemical substance applied to crops to ensure nutritional requirements, available in various forms such as granules, powders, liquid, water soluble, etc. |
| Specialty Fertilizer | Used for enhanced efficiency and nutrient availability applied through soil, foliar, and fertigation. Includes CRF, SRF, liquid fertilizer, and water soluble fertilizers. |
| Controlled-Release Fertilizers (CRF) | Coated with materials such as polymer, polymer-sulfur, and other materials such as resins to ensure nutrient availability to the crop for its entire life cycle. |
| Slow-Release Fertilizers (SRF) | Coated with materials such as sulfur, neem, etc., to ensure nutrient availability to the crop for a longer period. |
| Foliar Fertilizers | Consist of both liquid and water soluble fertilizers applied through foliar application. |
| Water-Soluble Fertilizers | Available in various forms including liquid, powder, etc., used in foliar and fertigation mode of fertilizer application. |
| Fertigation | Fertilizers applied through different irrigation systems such as drip irrigation, micro irrigation, sprinkler irrigation, etc. |
| Anhydrous Ammonia | Used as fertilizer, directly injected into the soil, available in gaseous liquid form. |
| Single Super Phosphate (SSP) | Phosphorus fertilizer containing only phosphorus which has lesser than or equal to 35%. |
| Triple Super Phosphate (TSP) | Phosphorus fertilizer containing only phosphorus greater than 35%. |
| Enhanced Efficiency Fertilizers | Fertilizers coated or treated with additional layers of various ingredients to make it more efficient compared to other fertilizers. |
| Conventional Fertilizer | Fertilizers applied to crops through traditional methods including broadcasting, row placement, ploughing soil placement, etc. |
| Chelated Micronutrients | Micronutrient fertilizers coated with chelating agents such as EDTA, EDDHA, DTPA, HEDTA, etc. |
| Liquid Fertilizers | Available in liquid form, majorly used for application of fertilizers to crops through foliar and fertigation. |


Research Methodology
Mordor Intelligence follows a four-step methodology in all our reports.
- Step-1: IDENTIFY KEY VARIABLES: In order to build a robust forecasting methodology, the variables and factors identified in Step-1 are tested against available historical market numbers. Through an iterative process, the variables required for market forecast are set and the model is built on the basis of these variables.
- Step-2: Build a Market Model: Market-size estimations for the forecast years are in nominal terms. Inflation is not a part of the pricing, and the average selling price (ASP) is kept constant throughout the forecast period for each country.
- Step-3: Validate and Finalize: In this important step, all market numbers, variables and analyst calls are validated through an extensive network of primary research experts from the market studied. The respondents are selected across levels and functions to generate a holistic picture of the market studied.
- Step-4: Research Outputs: Syndicated Reports, Custom Consulting Assignments, Databases & Subscription Platforms


