
AR and Persistent Spatial Mapping (VPS) Infrastructure Market Size and Share
Market Overview
| Study Period | 2020 - 2031 |
|---|---|
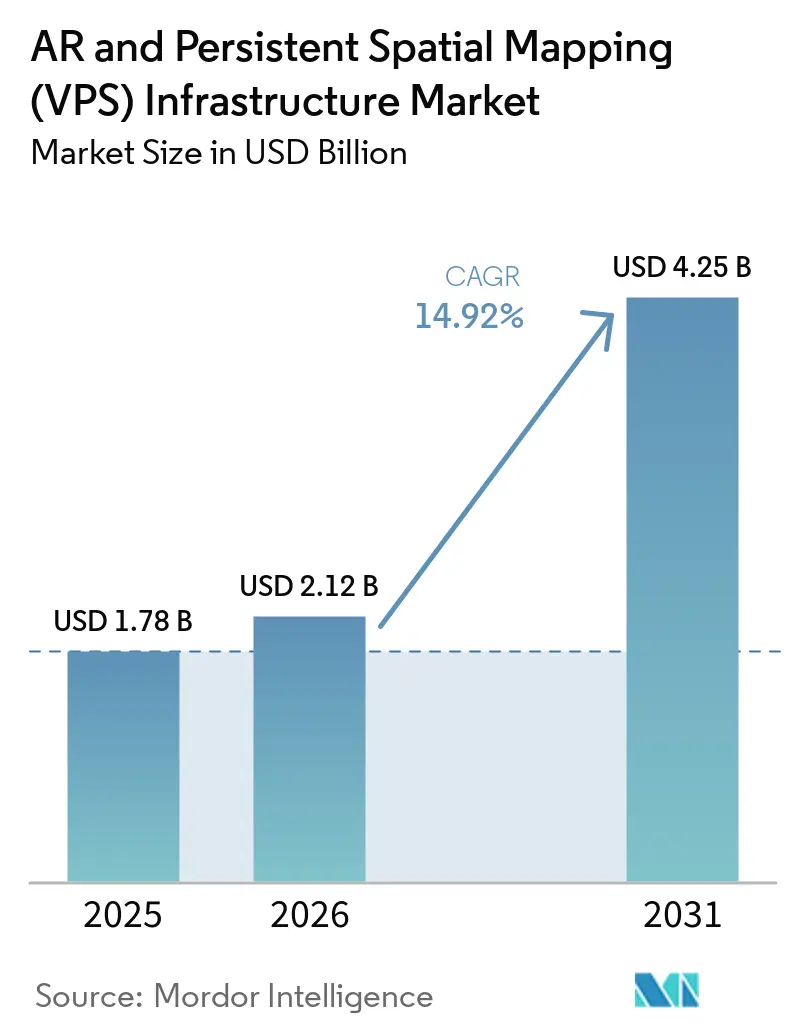
| Market Size (2026) | USD 2.12 Billion |
| Market Size (2031) | USD 4.25 Billion |
| Growth Rate (2026 - 2031) | 14.92 % |
| Fastest Growing Market | Asia-Pacific |
| Largest Market | North America |
| Market Concentration | Medium |
Major Players *Disclaimer: Major Players sorted in no particular order Image © Mordor Intelligence. Reuse requires attribution under CC BY 4.0. | |
AR and Persistent Spatial Mapping (VPS) Infrastructure Market Analysis by Mordor Intelligence
The AR and persistent spatial mapping (VPS) infrastructure market size is expected to expand from USD 1.78 billion in 2025 to USD 2.12 billion in 2026 and is forecast to reach USD 4.25 billion by 2031 at 14.92% CAGR over 2026-2031. Persistent spatial mapping is becoming an operating layer for industrial work, logistics automation, and physical AI systems because it links digital information to stable, centimeter-accurate locations. Enterprise buyers are moving spending from experimental AR projects into operations and maintenance programs, which gives deployments a clearer business purpose. The current buildout remains weighted toward back-end computing, storage, and map-serving capacity because reliable applications depend on a shared spatial foundation. Lower XR device prices can widen the installed base, while edge networks can support applications that need faster localization. The AR and persistent spatial mapping (VPS) infrastructure market is also moving toward a platform model in which developers use spatial APIs to create applications on top of persistent maps.
Key Report Takeaways
- By component, Cloud, Edge, and On-Premises Infrastructure held 38.42% of the AR and persistent spatial mapping (VPS) infrastructure market share in 2025, while Spatial SDKs, APIs, and Content Platforms are projected to expand at a 15.31% CAGR through 2031.
- By mapping scope, Venue and Building Scale held 42.46% revenue share in 2025, while Campus and Industrial-Site Scale is expected to expand at a 16.02% CAGR through 2031 in the AR and persistent spatial mapping (VPS) infrastructure market.
- By deployment model, Cloud accounted for 48.07% of revenue in 2025 and is projected to expand at a 15.67% CAGR through 2031.
- By application, AR Navigation and Wayfinding held 62.21% revenue share in 2025, while Industrial Maintenance, Assembly, and Inspection is projected to expand at a 15.87% CAGR through 2031 in the AR and persistent spatial mapping (VPS) infrastructure market.
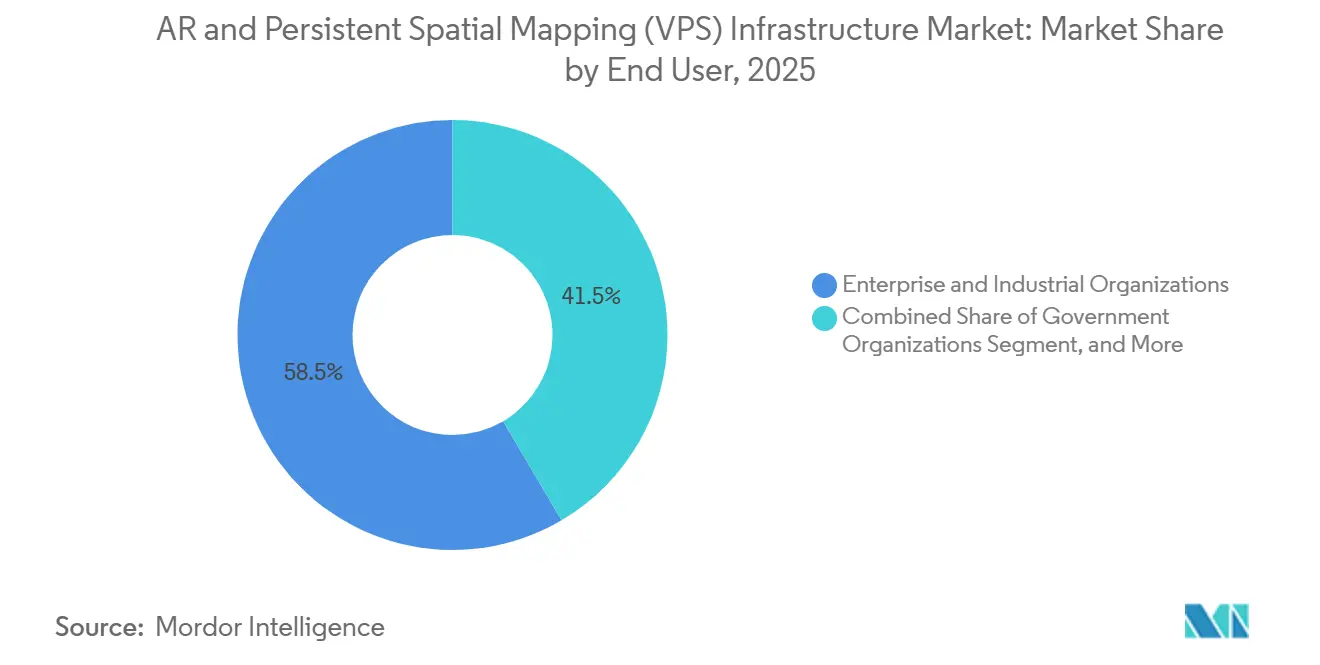
- By end user, Enterprise and Industrial Organizations accounted for 58.47% of revenue in 2025, while Application Developers and System Integrators are expected to expand at a 15.76% CAGR through 2031.
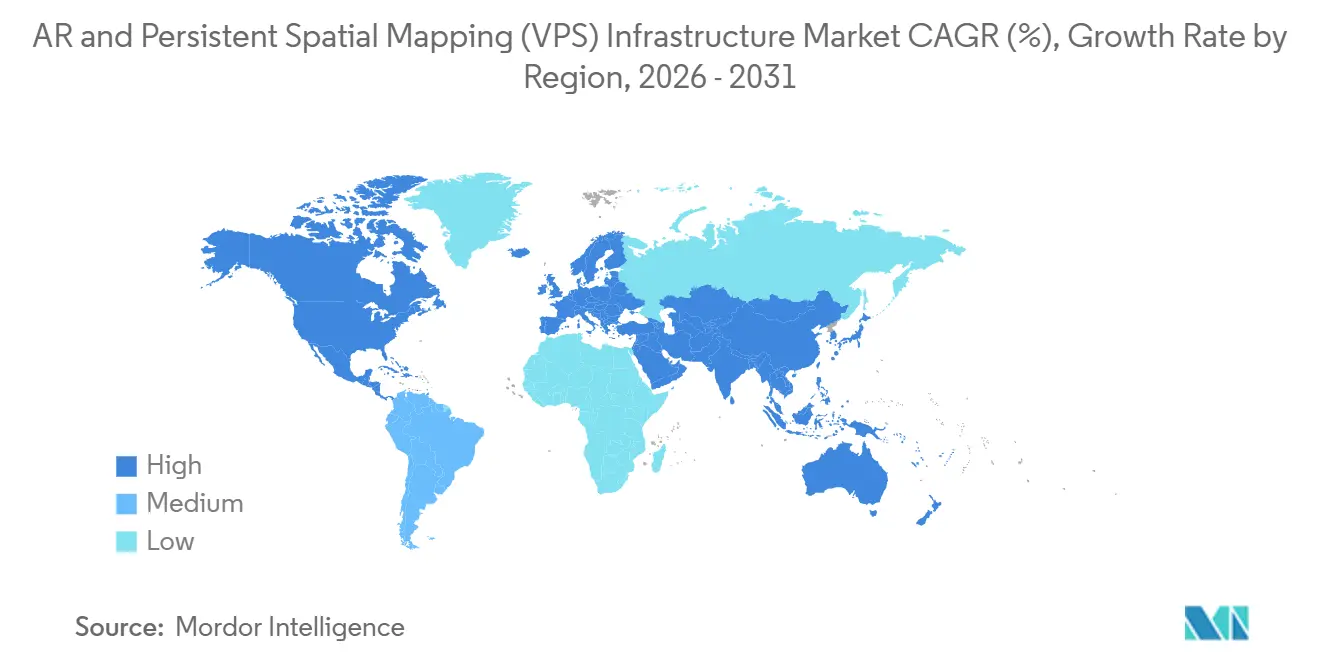
- By geography, North America held 84.12% revenue share in 2025, while Asia-Pacific is projected to expand at a 16.06% CAGR through 2031.
Note: Market size and forecast figures in this report are generated using Mordor Intelligence’s proprietary estimation framework, updated with the latest available data and insights as of January 2026.
Market Trends and Insights
Drivers Impact Analysis of AR and Persistent Spatial Mapping (VPS) Infrastructure Market*
| Driver | (~) % Impact on CAGR Forecast | Geographic Relevance | Impact Timeline |
|---|---|---|---|
| Enterprise Digital-Twin and Spatial Workflow Rollouts | +4.2% | Global, concentrated in North America and Germany | Medium term (2-4 years) |
| Shared Spatial Data Infrastructure for Physical AI Agents | +3.2% | North America and Asia-Pacific core, spillover to Europe and Middle East and Africa | Medium term (2-4 years) |
| Falling XR Hardware Costs and Broader Device Availability | +2.8% | Global, with Asia-Pacific driving volume and North America driving value | Short term (≤ 2 years) |
| Edge Networking and Low-Latency Spatial Computing | +2.4% | North America, Europe, South Korea, and Japan | Medium term (2-4 years) |
| Growth of Autonomous Robots, Drones, and Computer-Vision Navigation | +2.1% | Global industrial corridors and logistics hubs | Medium term (2-4 years) |
| Persistent Map Demand for Private Indoor and Campus Environments | +1.5% | North America and Europe | Short term (≤ 2 years) |
| Source: Mordor Intelligence | |||
Enterprise Digital-Twin and Spatial Workflow Rollouts
Enterprise digital twins are becoming operational systems that need persistent and accurate spatial anchoring. A model has limited value to a field technician if it cannot identify a specific valve or assembly station in real time. A VPS-registered digital twin makes the same information available as a location-based operational layer. ExxonMobil piloted Niantic Spatial's visual positioning system for field-worker guidance in refinery settings, showing how asset-intensive companies are applying the technology to maintenance work rather than isolated demonstrations.[1]Niantic Spatial, “How ExxonMobil Is Piloting Visual Positioning to Transform Field Operations,” Niantic Spatial, nianticspatial.com. This shift can move spending into operations and maintenance budgets, where projects may have stronger support than discretionary IT initiatives. NVIDIA's XR AI framework connects AR glasses with enterprise AI agents through spatially aware perception, extending the need for location-grounded information into human-machine workflows.
Shared Spatial Data Infrastructure for Physical AI Agents
Physical AI agents need shared spatial information to perceive, reason, and act within real environments. Robots, drones, and AR glasses cannot each create and sustain complete maps of the spaces where they operate. Persistent 3D maps provide geospatial context that turns general AI reasoning into actions tied to an actual location. Niantic Spatial designed its Large Geospatial Model to provide that common reference and to collect map updates during normal use. Its partnership with Snap gives 400,000 AR developers and 900 million Snapchatters access to tools that can build and contribute to VPS-based experiences. The AR and persistent spatial mapping (VPS) infrastructure market can therefore support recurring revenue as map queries and developer activity increase instead of relying only on one-time capture projects.
Falling XR Hardware Costs and Broader Device Availability
Lower device prices can make more AR deployments financially practical for enterprises and consumers. The effect reaches beyond headset sales because a useful navigation or context application needs map coverage at each operating location. Enterprise pilots have often been delayed by device costs rather than by the software layer. When the hardware barrier falls, developers can activate integrations that had not supported a viable budget. This can increase demand for SDK access and API calls across the AR and persistent spatial mapping (VPS) infrastructure market. Safety requirements are also becoming part of equipment selection because OSHA's reference to UL 8400 standards is shaping specifications for AR-assisted maintenance in North American facilities.
Edge Networking and Low-Latency Spatial Computing
Localization speed is a practical limit in safety-sensitive settings such as warehouses and factories. An autonomous forklift or inspection drone cannot depend on a slow server response while moving through a busy work area. Edge computing placed near industrial equipment or private 5G networks can support much faster localization requests. AWS describes a spatial data management architecture with versioning, role-based access controls, and event-based workflow connectors for industrial digital twins.[2]Amazon Web Services, “Build L1-4 Industrial Digital Twins With OpenUSD and SDMA on AWS,” AWS Blog, aws.amazon.com. South Korea's enterprise 5G coverage and Japan's factory digitalization programs support the network conditions required for these use cases. The combination of private 5G and local VPS servers can reduce reliance on a distant public cloud location and broaden demand for the AR and persistent spatial mapping (VPS) infrastructure market.
Restraints Impact Analysis of AR and Persistent Spatial Mapping (VPS) Infrastructure Market*
| Restraint | (~) % Impact on CAGR Forecast | Geographic Relevance | Impact Timeline |
|---|---|---|---|
| Privacy, Cybersecurity, and Consent Risks for Captured Spaces | -1.8% | Europe and North America, increasingly Asia-Pacific | Short term (≤ 2 years) |
| High Capture, Map-Maintenance, and Deployment Costs | -1.4% | Global, most acute in emerging markets and small and medium-sized enterprise segments | Long term (≥ 4 years) |
| Map Drift Across Changing Physical Environments | -0.9% | Global, concentrated in construction and industrial settings | Medium term (2-4 years) |
| Fragmented Spatial Standards and Vendor-Locked Map Formats | -0.7% | Global | Long term (≥ 4 years) |
| Source: Mordor Intelligence | |||
Privacy, Cybersecurity, and Consent Risks for Captured Spaces
Spatial mapping can capture the geometry of factories, hospitals, retail locations, and transit facilities. It can also capture facial images and behavioral traces that require careful handling. Article 5(1)(h) of the EU AI Act restricts real-time remote biometric identification in publicly accessible spaces, and the European Data Protection Board's 2026 guidance raises the standard for anonymized data.[3]European Data Protection Board, “Guidelines 02/2026 on Anonymisation,” European Data Protection Board, edpb.europa.eu.Enterprise security and legal teams may require evidence of data controls across the full mapping value chain before approving deployment. That process can extend project timelines by 6 to 18 months in regulated sectors. ISO/IEC 27701 and SOC 2 Type II are becoming practical procurement requirements, which can raise entry costs for smaller providers in the AR and persistent spatial mapping (VPS) infrastructure market.
High Capture, Map-Maintenance, and Deployment Costs
The largest cost burden often sits in initial site capture and the ongoing maintenance of maps. Mobile mapping trolleys, LiDAR rigs, and 360-degree camera systems can require a few thousand to tens of thousands of USD for a single facility. A large campus can require similar spending each time a physical change requires a map refresh. Organizations with hundreds of sites may need dedicated spatial-data teams because this work does not fit a standard software licensing budget. Scan-agnostic platforms can accept different reality-capture inputs and reduce proprietary hardware dependence, although they do not remove the labor needed for survey-grade capture. The constraint is strongest in South America, Africa, and Southeast Asia, where systems integrator capacity remains limited.
*Our forecasts treat driver/restraint impacts as directional, not additive. The impact forecasts reflect baseline growth, mix effects, and variable interactions.
AR and Persistent Spatial Mapping (VPS) Infrastructure Market Segment Analysis
By Component:
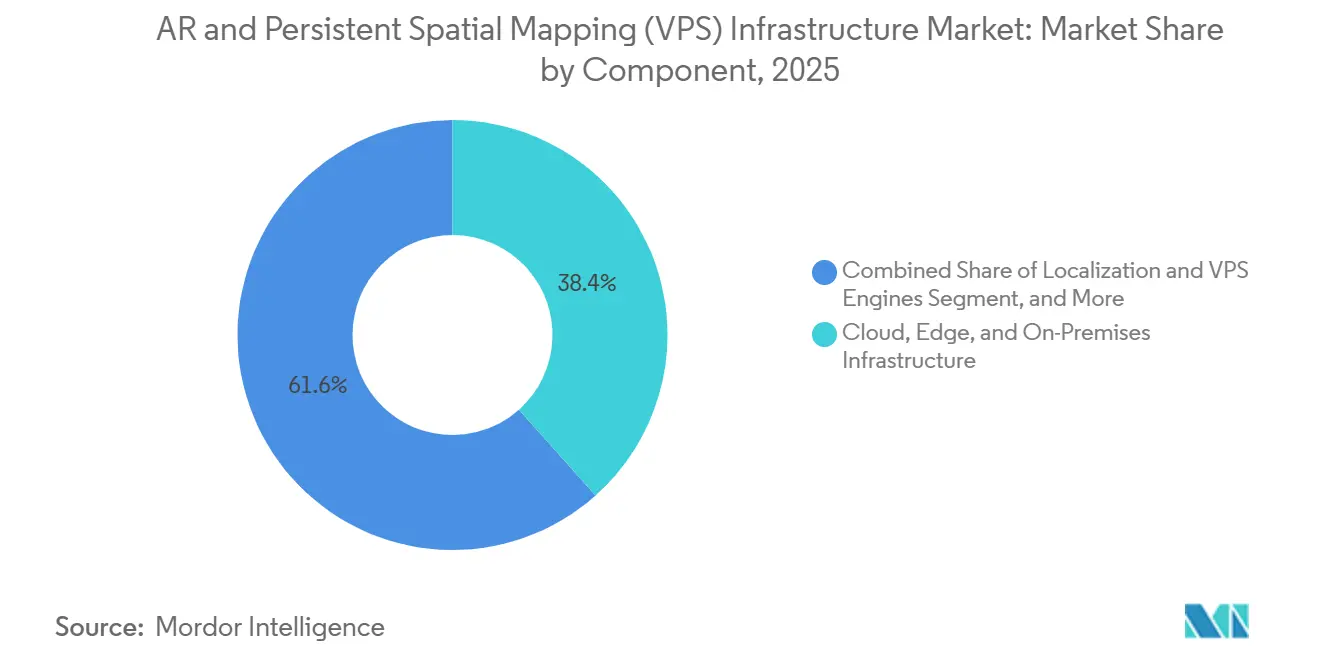
Infrastructure Layer Anchors Enterprise Spatial BuildoutCloud, Edge, and On-Premises Infrastructure held 38.42% of revenue in 2025, making it the largest component category. The share reflects the computing, storage, and map-serving capacity enterprises need before application adoption can scale. Spatial map files such as Gaussian splat models and dense point clouds need substantial processing and storage near the point of use. Localization and VPS Engines address the positioning stage, while Mapping and Capture Tools support the creation of source material. Revenue across these categories is weighted toward enterprise licenses and usage-based API activity rather than hardware sales. Research presented at the ICCV Workshop on Visual Localization and Calibration in 2025 found that Gaussian Splatting representations can support generalizable visual localization without model retraining. This can shorten SDK development cycles by reducing the need for site-specific fine-tuning. The AR and VPS infrastructure industry is following an early pattern in which the infrastructure layer captures much of the revenue before platform services gain share.
Spatial SDKs, APIs, and Content Platforms are projected to expand at a 15.31% CAGR from 2026 to 2031, the fastest component rate. Developers use these tools to build services on maps that have already been created and hosted. Pix4D launched PIX4Dmatic as a unified geospatial platform in February 2026, combining large-scale processing with CAD and GIS deliverables in one workflow. This type of product expansion allows mapping vendors to serve more of the customer workflow. SDK revenue can recur through developer seats and API call volumes instead of depending on a single implementation license. Data sovereignty requirements in France, Germany, and Gulf Cooperation Council states also support on-premises demand in regulated activities. That demand gives the smaller infrastructure categories a role even as cloud services remain widely used. The component mix shows why the AR and persistent spatial mapping (VPS) infrastructure market is developing around both local control and scalable developer access. It also allows the AR and persistent spatial mapping (VPS) infrastructure market to serve developers without requiring every customer to manage the full mapping stack.



By Mapping Scope:
Venue-Scale Deployments Lead, Industrial Sites AccelerateVenue and Building Scale captured 42.46% of the AR and persistent spatial mapping (VPS) infrastructure market share in 2025. Commercial real estate, retail, and hospitality sites use these maps for indoor wayfinding and visitor services. Shopping centers, airports, and convention venues can serve many visitors while keeping per-query infrastructure needs manageable. These locations also have clear operating uses, including better wayfinding and lower staff effort. City and Urban-District Scale and Regional and World-Scale categories remain earlier in their revenue development. They nevertheless attract significant platform interest because of their relevance to smart-city programs and physical AI systems. 360Channel launched its VPS-based 360maps navigation service at TOKYO NODE in January 2026, providing a production example at a major urban destination. The rollout illustrates how venue applications can provide a bridge toward broader urban mapping deployments.
Campus and Industrial-Site Scale is expected to expand at a 16.02% CAGR from 2026 to 2031, the fastest rate among mapping scopes. Manufacturing digitalization and warehouse automation require maps across multiple connected buildings and operational zones. The key need at this scale is version control because physical layouts can change frequently. Updates must reach all dependent applications without requiring a complete rescan. MultiSet AI introduced a map versioning capability in May 2026 with rollback, audit trails, and rate-of-change analysis for industrial users. Research in Computers in 2024 found that UWB-LSTM hybrid positioning in industrial warehouses improved localization accuracy by up to 4% compared with baseline sensor-fusion approaches. These requirements show why reliable map maintenance can be as important as initial mapping in the AR and VPS infrastructure market.
By Deployment Model:
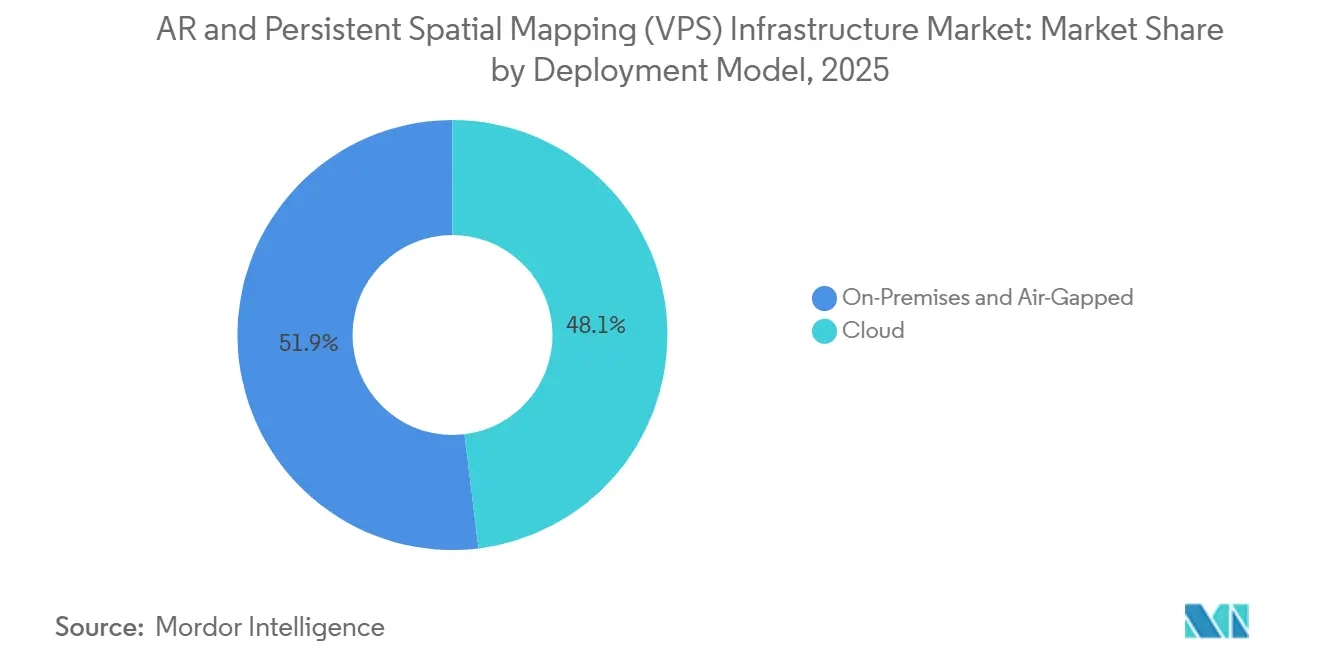
Cloud Dominates While Air-Gapped Demand Reshapes MixCloud held 48.07% of revenue in 2025, the largest deployment-model share, and is projected to expand at a 15.67% CAGR through 2031. Enterprises are familiar with SaaS procurement and can avoid large up-front infrastructure purchases through cloud use. Major cloud platforms can also serve global map workloads with multi-region capacity and controlled access. AWS has outlined spatial data management capabilities that include content-addressable versioning, role-based access, and event-driven pipeline connectors. Pix4D extended georeferenced Gaussian splatting to drone imagery through PIX4Dcloud in October 2025. Such functions show that cloud services are taking on higher-fidelity reconstruction tasks that once depended more heavily on desktop workflows. Cloud therefore remains central to the AR and VPS infrastructure market size as it supports broad access to map processing and delivery.
On-Premises and Air-Gapped deployments are smaller but have an important structural role. Defense, critical infrastructure, and classified government operations may have data sovereignty rules that prevent a cloud-based approach. GDPR Article 28 obligations, French health data hosting requirements, and Gulf Cooperation Council sovereign-cloud policies can also support local deployment in regulated work. MultiSet AI states that its platform can operate from public-cloud to air-gapped settings through a single codebase. This flexibility meets customer demand for a choice of deployment approaches rather than a fixed cloud-or-local decision. Data residency policies in Asian and Middle Eastern locations could further support the on-premises category over the forecast period. The deployment mix makes privacy, control, and low-latency performance continuing considerations for the AR and persistent spatial mapping (VPS) infrastructure industry. These needs also give the AR and persistent spatial mapping (VPS) infrastructure market a role in sectors that cannot place sensitive map data in a public cloud.
By Application:
Navigation Leads While Industrial Use Gains GroundAR Navigation and Wayfinding accounted for 62.21% of revenue in 2025, making it the leading application. It directs workers, visitors, and autonomous systems to specific physical locations. Airports, shopping centers, and logistics sites can use the application to reduce navigation effort and improve site experience. The use case has reached commercial scale because its value is easier to assess than some emerging AR applications. It also creates frequent localization requests that support VPS platform economics. Industrial Maintenance, Assembly, and Inspection is expected to expand at a 15.87% CAGR from 2026 to 2031. ExxonMobil's visual positioning pilot shows how common spatial infrastructure can guide staff to particular refinery assets. In such environments, localization error can affect both work quality and safety, which supports demand for reliable tools across the AR and VPS infrastructure market.
Warehousing, Logistics, and Asset Tracking benefits from the adoption of autonomous material-handling vehicles. Construction, BIM, and Digital-Twin Alignment benefits from BIM requirements in Europe and major infrastructure programs in Asia. Esri and Pix4D launched a real-time terrestrial mapping workflow in February 2026 that combined PIX4Dcatch RTK field capture, ArcGIS Online publication, and AR verification of designed and completed conditions. The workflow illustrates how construction teams can use spatial AR as a quality-control step. Remote Collaboration and Training, Retail and Advertising, and Museums, Tourism, Sports, and Location-Based Entertainment usually depend on more discretionary budgets. They can still generate the high volume of location queries that supports platform revenue. Public Safety, Defense, and Emergency Response remains smaller by revenue but can command premium pricing and long contract terms. These varied applications reduce the AR and persistent spatial mapping (VPS) infrastructure market's dependence on any single customer workflow. They also give the AR and persistent spatial mapping (VPS) infrastructure market a range of demand sources with different procurement cycles.
By End User:
Enterprise Dominance With Developer Ecosystem EmergingEnterprise and Industrial Organizations held 58.47% of revenue in 2025, anchoring demand in operating environments where spatial accuracy can support measurable results. Automotive, oil and gas, aerospace, logistics, and healthcare organizations can use persistent maps in locations with complex assets and repeat work. Government and Public-Sector Organizations contribute demand through smart-city work and defense spatial-data needs. Mobile Network Operators and Cloud Providers can embed VPS capabilities into edge computing offerings. Consumer Brands, Venues, and Media Companies produce high query volumes even when their revenue per query is lower. The end-user mix gives the AR and persistent spatial mapping (VPS) infrastructure market exposure to both long-cycle industrial programs and more rapid venue deployments.
Application Developers and System Integrators are projected to expand at a 15.76% CAGR from 2026 to 2031, the fastest end-user rate. They acquire VPS API access and adapt it to applications for individual customer sectors. Infrastructure providers are developing integrator and developer channels as a route to end-user deployments. More application-layer activity can shift value from producing maps to operating services built on stable maps. Enterprise customers also increasingly want audit trails, access controls, and documentation across the VPS value chain. Providers that include these controls can be more attractive to system integrators serving regulated customers. The expanding developer base indicates that the AR and persistent spatial mapping (VPS) infrastructure market is entering a more mature platform stage. This channel can also help the AR and persistent spatial mapping (VPS) infrastructure market reach industries that need specialized implementation support.
Geography Analysis
North America AR and Persistent Spatial Mapping (VPS) Infrastructure Market
North America held 84.12% of revenue in 2025. The United States combines large enterprise technology budgets, cloud capacity for spatial data, and customers able to deploy VPS across several sites. Defense and intelligence uses support demand for on-premises and air-gapped mapping that is less exposed to commercial IT budgets. Canada contributes through resource-sector digital twins and smart-city pilots, while northern Mexico supports automotive supply-chain demand and OSHA's UL 8400 AR safety standards plus state-level privacy requirements shape deployment decisions.
EMEA and South America AR and Persistent Spatial Mapping (VPS) Infrastructure Market
Europe is the second-largest contributing region, led by Germany, the United Kingdom, and France. Germany's industrial automation base supports campus-scale VPS use in manufacturing and asset management. The United Kingdom's BIM Level 2 requirement for government-funded construction supports VPS-aligned digital-twin work, while GDPR data-minimization rules and the European Data Protection Board's 2026 anonymization guidance shape procurement across the region. Brazil leads the early South American opportunity despite infrastructure and integrator constraints. Saudi Arabia and the UAE support demand through smart-city and construction programs, while Africa remains at an early adoption stage outside major urban centers.
APAC and Oceania AR and Persistent Spatial Mapping (VPS) Infrastructure Market
Asia-Pacific is projected to expand at a 16.06% CAGR from 2026 to 2031, the fastest regional rate. Government industrial policy, strong 5G coverage, and hardware manufacturing capacity support regional demand. 360Channel deployed its 360maps AR navigation service at TOKYO NODE and Toranomon Hills Station Tower in January 2026. China is building mapping infrastructure for smart manufacturing and autonomous logistics under data-residency frameworks, while South Korea's enterprise 5G footprint supports low-latency uses in semiconductor plants and logistics centers. India, Oceania, Vietnam, Thailand, and Malaysia are generating earlier-stage demand as factory digitalization extends through manufacturing corridors.

Competitive Landscape
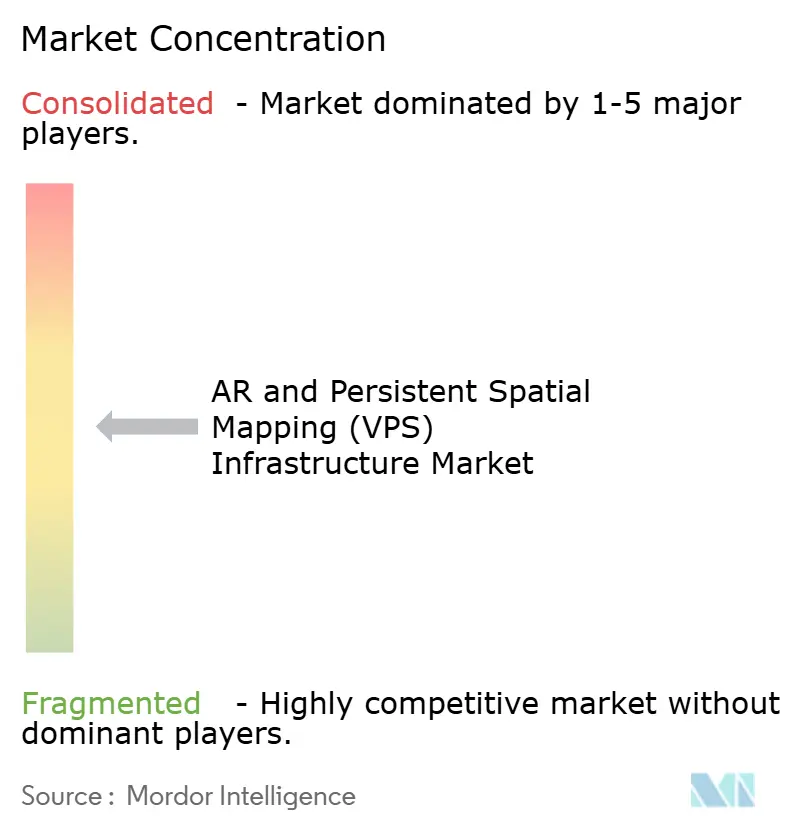
The AR and persistent spatial mapping (VPS) infrastructure market is semi-fragmented, with a small group of global platform providers competing beside a larger set of specialized vendors. Niantic Spatial, NavVis, MultiSet AI, and Matterport operate across broad use cases, while Immersal, Kudan, EasyAR Technology, Sturfee, Visualix, Situm Technologies, Navigine, ARway.ai, Pointr, and Oriient New Media focus on particular technologies or location types. Global platforms compete on map coverage, localization accuracy, physical AI integration, and developer reach. Specialists compete through vertical expertise and support for different deployment models. Vendors increasingly position maps as shared data for robots and AI agents rather than only as AR tools.
Niantic Spatial's partnership with Snap was announced in June 2025 and combined Snap's 900 million Snapchatters and 400,000 Lens Studio developers with Niantic Spatial's VPS and geospatial AI capabilities. The partners stated that the arrangement included a USD 250 million total capital position and planned integrations with Lens Studio, Snapchat, and Spectacles. MultiSet AI launched a commercial 3D Gaussian Splatting-to-VPS pipeline in April 2026 that converts metric-scaled 3DGS models from standard capture tools into centimeter-accurate AR maps. The move reduces hardware lock-in, which has been a source of switching costs for established providers. These moves show that the AR and persistent spatial mapping (VPS) infrastructure market is competing through ecosystem access, capture flexibility, and persistent-map operations.
White space remains in outdoor and agricultural asset management, healthcare facility mapping, and smaller manufacturing and retail sites. These settings face limits from sparse LiDAR coverage, strict data-handling requirements, or pricing models designed for larger deployments. Scan-agnostic providers may address part of the gap by accepting photogrammetric point clouds, Gaussian splat models, and robot-generated maps. Academic work on GSplatLoc at IROS 2025 shows continued work on visual-localization methods for Gaussian Splatting representations.
AR and Persistent Spatial Mapping (VPS) Infrastructure Industry Leaders
Niantic Spatial, Inc.
Immersal Oy
EasyAR Technology Co., Ltd.
Sturfee, Inc.
Visualix GmbH
- *Disclaimer: Major Players sorted in no particular order
AR and Persistent Spatial Mapping (VPS) Infrastructure Market Companies Covered in this Report
- Niantic Spatial, Inc.
- Immersal Oy
- Sturfee, Inc.
- Visualix GmbH
- EasyAR Technology Co., Ltd.
- Placenote, Inc.
- MultiSet AI, Inc.
- ARway.ai Inc.
- Kudan Inc.
- Augmented Pixels, Inc.
- Pointr Ltd.
- Senion AB
- Situm Technologies, S.L.
- Navigine Corporation
- Oriient New Media Ltd.
- NavVis GmbH
- Matterport, Inc.
- Pix4D SA
- Magic Leap, Inc.

Recent Industry Developments in AR and Persistent Spatial Mapping (VPS) Infrastructure Market
- July 2026: Japanese company palan launched a browser-native VPS engine for STYLY WebAR. The service enables spatially anchored AR experiences in web browsers without application installation and was presented as Japan's first domestically developed fully web-based VPS system.
- February 2026: MultiSet AI launched the first commercially available 3D Gaussian Splatting-to-VPS pipeline, allowing developers to transform metric-scaled 3DGS models into centimeter-accurate, cross-platform AR maps without hardware lock-in. The platform supports deployment models from public cloud to air-gapped environments.
- February 2026: Esri and Pix4D launched an integrated real-time terrestrial mapping workflow combining PIX4Dcatch RTK field capture with ArcGIS Online publication. The workflow enables field teams to generate high-precision georeferenced 3D models viewable in AR for as-designed versus as-built verification on infrastructure projects.
- February 2026: Pix4D launched PIX4Dmatic as a unified geospatial platform. It combines large-scale processing with survey-grade CAD and GIS deliverables in a continuous workflow and includes Gaussian splatting as a reconstruction capability.


Global AR and Persistent Spatial Mapping (VPS) Infrastructure Market Report Scope
The AR and Persistent Spatial Mapping (VPS) Infrastructure Market comprises the hardware, software, cloud platforms, and geospatial data services that enable location-aware augmented reality (AR) experiences through accurate visual positioning, environmental understanding, and the anchoring of persistent digital content in real-world spaces.
The AR and Persistent Spatial Mapping (VPS) Infrastructure Market Report is Segmented by Component (Mapping and Capture Tools, Localization and VPS Engines, Spatial SDKs and APIs and Content Platforms, and Cloud, Edge and On-Premises Infrastructure), Mapping Scope (Venue and Building Scale, Campus and Industrial-Site Scale, City and Urban-District Scale, and Regional and World Scale), Deployment Model (Cloud, and On-Premises and Air-Gapped), Application (AR Navigation and Wayfinding, Industrial Maintenance and Assembly and Inspection, Warehousing and Logistics and Asset Tracking, Retail and Advertising and Brand Experiences, Museums and Tourism and Sports and Location-Based Entertainment, Remote Collaboration and Training, Construction and BIM and Digital-Twin Alignment, and Public Safety and Defense and Emergency Response), End User (Enterprise and Industrial Organizations, Government and Public-Sector Organizations, Mobile Network Operators and Cloud Providers, Consumer Brands and Venues and Media Companies, Application Developers and System Integrators), and Geography (North America, South America, Europe, Asia-Pacific, Middle East, and Africa). The Market Forecasts are Provided in Terms of Value (USD).
| Mapping and Capture Tools |
| Localization and VPS Engines |
| Spatial SDKs, APIs, and Content Platforms |
| Cloud, Edge, and On-Premises Infrastructure |
| Venue and Building Scale |
| Campus and Industrial-Site Scale |
| City and Urban-District Scale |
| Regional and World-Scale |
| Cloud |
| On-Premises and Air-Gapped |
| AR Navigation and Wayfinding |
| Industrial Maintenance, Assembly, and Inspection |
| Warehousing, Logistics, and Asset Tracking |
| Retail, Advertising, and Brand Experiences |
| Museums, Tourism, Sports, and Location-Based Entertainment |
| Remote Collaboration and Training |
| Construction, BIM, and Digital-Twin Alignment |
| Public Safety, Defense, and Emergency Response |
| Enterprise and Industrial Organizations |
| Government and Public-Sector Organizations |
| Mobile Network Operators and Cloud Providers |
| Consumer Brands, Venues, and Media Companies |
| Application Developers and System Integrators |
| North America | United States |
| Canada | |
| Mexico | |
| South America | Brazil |
| Rest of South America | |
| Europe | Germany |
| United Kingdom | |
| France | |
| Russia | |
| Rest of Europe | |
| Asia-Pacific | China |
| Japan | |
| South Korea | |
| India | |
| Oceania | |
| Rest of Asia-Pacific | |
| Middle East | Saudi Arabia |
| United Arab Emirates | |
| Turkey | |
| Rest of Middle East | |
| Africa | South Africa |
| Rest of Africa |
| By Component | Mapping and Capture Tools | |
| Localization and VPS Engines | ||
| Spatial SDKs, APIs, and Content Platforms | ||
| Cloud, Edge, and On-Premises Infrastructure | ||
| By Mapping Scope | Venue and Building Scale | |
| Campus and Industrial-Site Scale | ||
| City and Urban-District Scale | ||
| Regional and World-Scale | ||
| By Deployment Model | Cloud | |
| On-Premises and Air-Gapped | ||
| By Application | AR Navigation and Wayfinding | |
| Industrial Maintenance, Assembly, and Inspection | ||
| Warehousing, Logistics, and Asset Tracking | ||
| Retail, Advertising, and Brand Experiences | ||
| Museums, Tourism, Sports, and Location-Based Entertainment | ||
| Remote Collaboration and Training | ||
| Construction, BIM, and Digital-Twin Alignment | ||
| Public Safety, Defense, and Emergency Response | ||
| By End User | Enterprise and Industrial Organizations | |
| Government and Public-Sector Organizations | ||
| Mobile Network Operators and Cloud Providers | ||
| Consumer Brands, Venues, and Media Companies | ||
| Application Developers and System Integrators | ||
| By Geography | North America | United States |
| Canada | ||
| Mexico | ||
| South America | Brazil | |
| Rest of South America | ||
| Europe | Germany | |
| United Kingdom | ||
| France | ||
| Russia | ||
| Rest of Europe | ||
| Asia-Pacific | China | |
| Japan | ||
| South Korea | ||
| India | ||
| Oceania | ||
| Rest of Asia-Pacific | ||
| Middle East | Saudi Arabia | |
| United Arab Emirates | ||
| Turkey | ||
| Rest of Middle East | ||
| Africa | South Africa | |
| Rest of Africa | ||


Key Questions Answered in the Report
What is the AR and VPS infrastructure market size?
The AR and VPS infrastructure market was USD 2.12 billion in 2026 and is forecast to reach USD 4.25 billion by 2031 at a 14.92% CAGR.
What is driving demand for persistent spatial mapping?
Industrial digital twins, physical AI agents, lower XR hardware costs, and edge computing are supporting demand for stable location-based data.
Which component is expanding fastest?
Spatial SDKs, APIs, and Content Platforms are projected to expand at a 15.31% CAGR through 2031.
Which mapping scope has the strongest projected expansion?
Campus and Industrial-Site Scale is expected to expand at a 16.02% CAGR through 2031 as factories and warehouses need updated maps across connected facilities.
Which application leads current revenue?
AR Navigation and Wayfinding held 62.21% of revenue in 2025, supported by use in airports, retail sites, and logistics facilities.
Which region is projected to expand fastest?
Asia-Pacific is projected to expand at a 16.06% CAGR through 2031, supported by industrial policy, 5G coverage, and XR hardware manufacturing.
Page last updated on:





