Ethanolamines Market Size and Share
Market Overview
| Study Period | 2020 - 2031 |
|---|---|
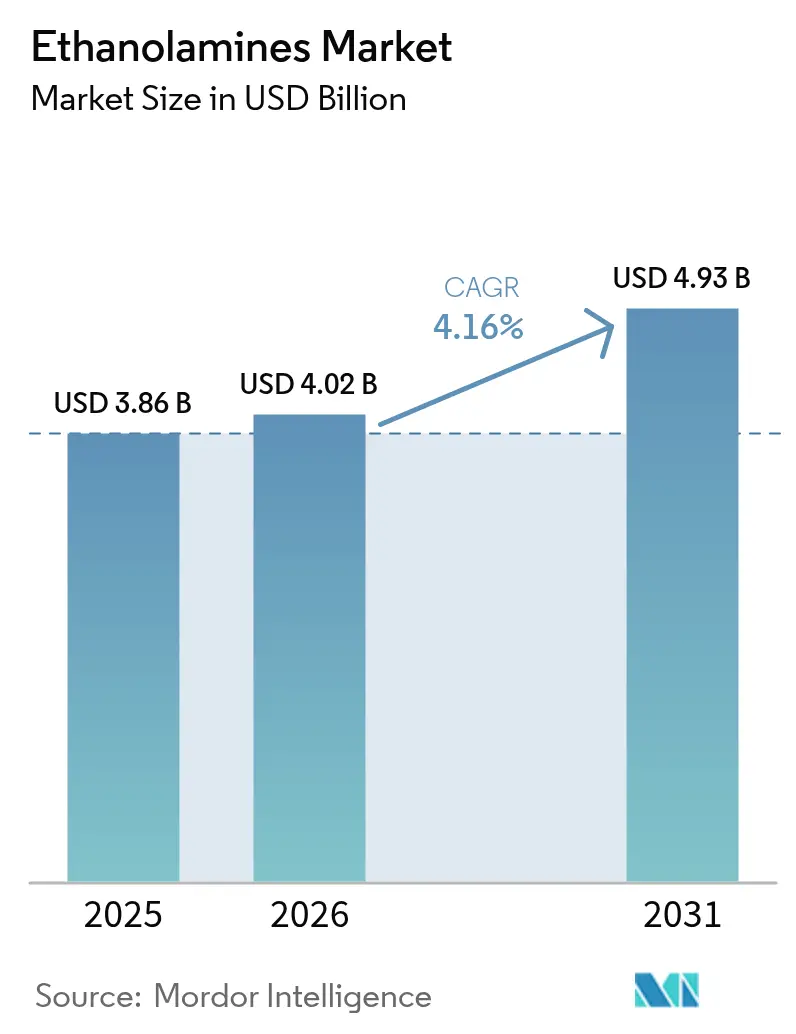
| Market Size (2026) | USD 4.02 Billion |
| Market Size (2031) | USD 4.93 Billion |
| Growth Rate (2026 - 2031) | 4.16% CAGR |
| Fastest Growing Market | Asia-Pacific |
| Largest Market | Asia-Pacific |
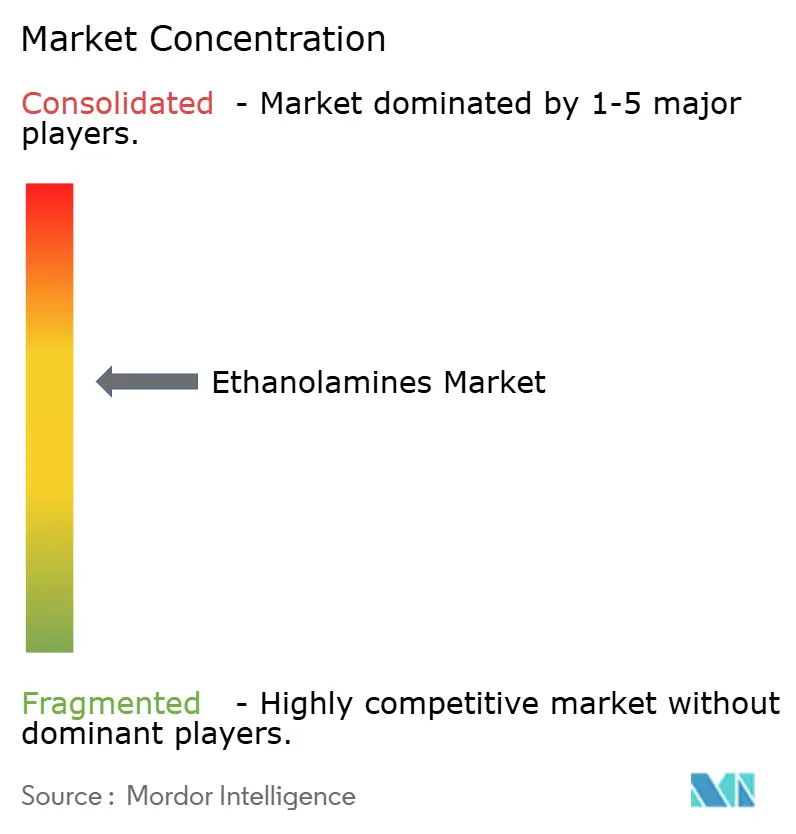
| Market Concentration | Medium |
Major Players *Disclaimer: Major Players sorted in no particular order Image © Mordor Intelligence. Reuse requires attribution under CC BY 4.0. | |
Ethanolamines Market Analysis by Mordor Intelligence
Ethanolamines market size in 2026 is estimated at USD 4.02 billion, growing from 2025 value of USD 3.86 billion with 2031 projections showing USD 4.93 billion, growing at 4.16% CAGR over 2026-2031. Healthy demand from gas treatment, detergents, agrochemicals and advanced manufacturing keeps volumes stable even as producers confront stricter safety and environmental rules. Feedstock-backward integration deals, such as INEOS’s purchase of LyondellBasell’s ethylene oxide and derivatives assets, illustrate how leading suppliers secure cost advantages while locking in supply certainty. Regulatory shifts—most notably the United States Environmental Protection Agency’s significant-new-use rules for ethanolamines entering force in August 2025—encourage investments in bio-based routes without eroding near-term consumption in conventional applications. Meanwhile, incremental capacity expansions by incumbents like BASF in Antwerp and Nouryon in Sweden position the ethanolamines market to meet rising sustainability requirements while preserving regional supply security.
Key Report Takeaways
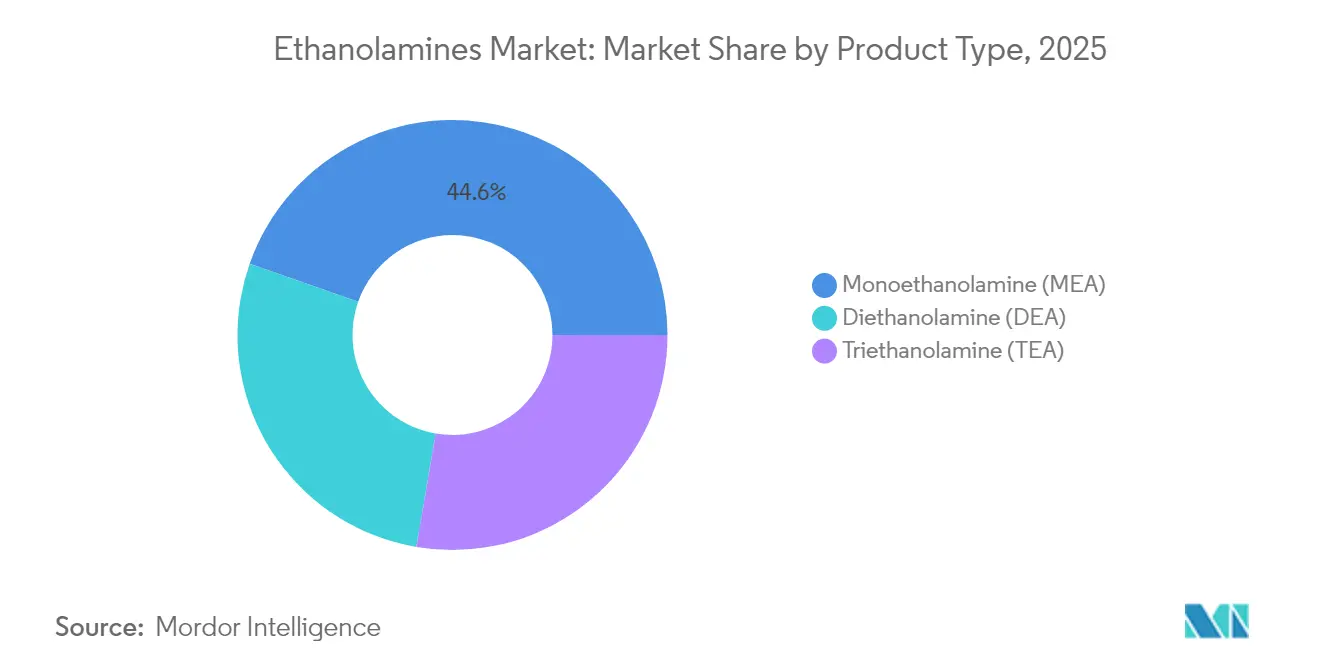
- By product type, monoethanolamine led with 44.62% ethanolamines market share in 2025, while diethanolamine posted the highest 6.62% CAGR outlook to 2031.
- By technology, the ethylene oxide route accounted for 91.75% of the ethanolamines market size in 2025, whereas the bio-ethanol pathway is forecast to expand at 7.12% CAGR through 2031.
- By application, surfactants held a 42.63% revenue share in 2025; herbicides are projected to grow the fastest at 6.29% CAGR to 2031.
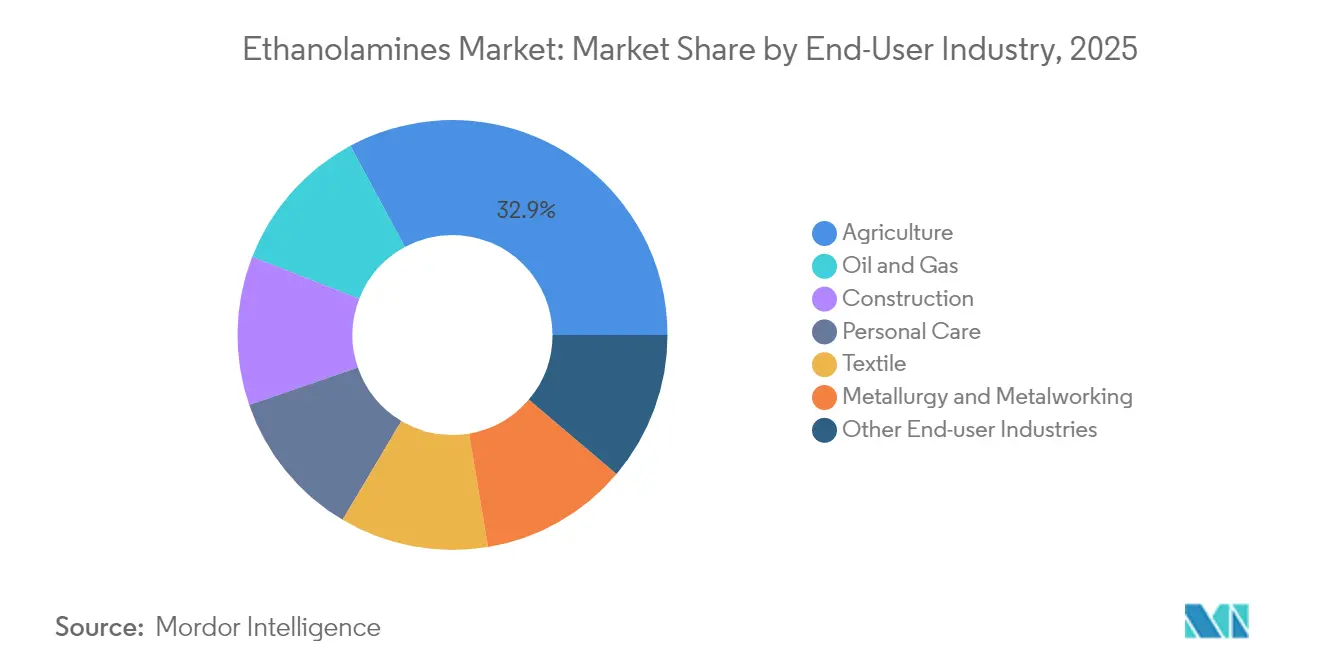
- By end-user, agriculture captured 32.88% of the ethanolamines market in 2025, with continuing growth of 5.69% CAGR anticipated through 2031.
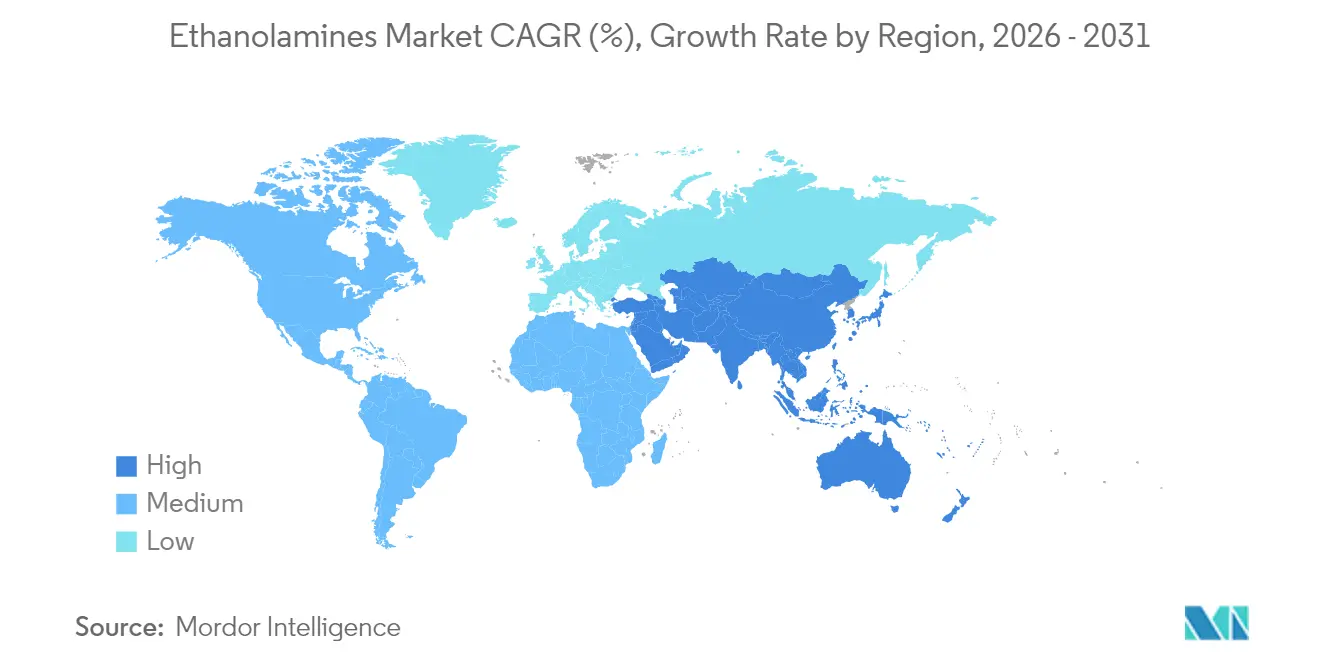
- By geography, Asia-Pacific dominated at 46.35% share in 2025 and is expected to record the highest regional CAGR of 5.06% to 2031.
Note: Market size and forecast figures in this report are generated using Mordor Intelligence’s proprietary estimation framework, updated with the latest available data and insights as of 2026.
Global Ethanolamines Market Trends and Insights
Driver Impact Analysis*
| Driver | (~) % Impact on CAGR Forecast | Geographic Relevance | Impact Timeline |
|---|---|---|---|
| Rapid industrialisation in emerging economies | +0.8% | Asia-Pacific core, spill-over to MEA | Medium term (2-4 years) |
| Surging glyphosate production for herbicide-tolerant crops | +0.6% | Global, with concentration in North America & APAC | Short term (≤ 2 years) |
| Rising demand for water-based metal-working fluids in EV manufacturing | +0.5% | Global, led by North America & Europe | Medium term (2-4 years) |
| Increasing utilization in the agrochemical industry | +0.4% | Global | Long term (≥ 4 years) |
| Growth in bio-based surfactant formulation in personal-care | +0.3% | North America & EU, expanding to APAC | Long term (≥ 4 years) |
| Source: Mordor Intelligence | |||
Rapid industrialisation in emerging economies
Surging fixed-asset investment across China, India, Indonesia and Vietnam stimulates fresh consumption of ethanolamines for gas sweetening, cement additives and process chemicals. Chinese policy packages that target advanced battery raw materials directly raise monoethanolamine offtake for electrolyte purification projects. India’s widening bio-ethanol capacity reinforces future feedstock availability for renewable ethanolamines plants, lowering import dependence while supporting export-oriented specialty chemicals clusters. Expanding construction programs in Southeast Asia lift triethanolamine demand for cement grinding aids, while regional utilities deploy amine-based CO₂ capture to decarbonize coal and gas-fired plants. Urbanisation unlocks higher per-capita purchases of detergents and personal-care items, embedding a structural pull for surfactant-grade ethanolamines. Collectively, these trends embed a broad-based, medium-term uplift in the ethanolamines market.
Surging glyphosate production for herbicide-tolerant crops
Even as weed-resistance debates intensify, acreage sown with herbicide-tolerant soybean and maize varieties keeps expanding in Brazil, Argentina and the United States, sustaining large synthesis volumes for glyphosate that rely on ethanolamines neutralisation steps[1]Bayer AG, “Annual Report 2024,” bayer.com . Multinational formulators are relocating production to cost-competitive Asian hubs, giving the ethanolamines market fresh demand corridors without altering global consumption totals. In developing economies, farm-mechanisation campaigns elevate glyphosate usage because labour-saving herbicides remain cheaper than manual weeding. New double-knock programs that mix glyphosate with complementary actives often boost total amine requirements per hectare. Although regulators in the European Union push for reduced synthetic loads, these restrictions typically shift manufacturing to friendlier jurisdictions rather than curbing absolute tonnage. Consequently, near-term momentum from glyphosate maintains a positive swing factor for ethanolamines market growth.
Rising demand for water-based metal-working fluids in EV manufacturing
Battery-electric vehicle assembly plants prefer water-based coolants for milling, drilling and finishing operations because of lower fire risk and easier wastewater treatment. Ethanolamines function as pH stabilisers and corrosion inhibitors in these fluids, ensuring tool life and dimensional accuracy[2]TotalEnergies Lubricants, “Water-Based Lubricants for Electric Vehicles,” . Lighter aluminium alloys and copper rotors used in EVs require additive packages that control galvanic corrosion, further lifting triethanolamine inclusion rates. Automotive OEM sustainability scorecards measure embedded CO₂; ethanolamine-enabled, water-borne lubricants cut greenhouse-gas footprints by up to 30% versus neat-oil systems. Major fluid formulators are qualifying bio-based monoethanolamine to bolster recycled-content claims, adding a premium layer to supplier negotiations. Sustained EV capacity ramp-ups in the United States, China and Germany therefore furnish a mid-term growth lever for the ethanolamines market.
Increasing utilization in the agrochemical industry
Beyond glyphosate, ethanolamines stabilise pH, aid solubilisation and improve leaf adhesion in fungicides, insecticides and micronutrient formulations. Precision-spray equipment relies on tailored droplet spectra that many ethanolamine surfactants can achieve, keeping delivery efficiency high while reducing drift. As governments restrict older solvent systems, formulators switch to amine-neutralised water-based products to meet stricter occupational-exposure limits. Biostimulant developers also employ ethanolamines as compatibility agents, enabling combined tank mixes that simplify farm logistics. The result is a durable, long-term contribution to ethanolamines market expansion, especially in South America and Southeast Asia where crop-protection intensity rises in tandem with export-crop ambitions.
Restraint Impact Analysis*
| Restraint | (~) % Impact on CAGR Forecast | Geographic Relevance | Impact Timeline |
|---|---|---|---|
| Volatile ethylene oxide feedstock prices | -0.7% | Global | Short term (≤ 2 years) |
| Increasing Weed Resistance to Weaken the Demand for Glyphosate | -0.4% | North America & EU primarily | Medium term (2-4 years) |
| Emergence of greener bio-solvents challenging ethanolamines | -0.3% | Global, led by developed markets | Long term (≥ 4 years) |
| Source: Mordor Intelligence | |||
Volatile ethylene oxide feedstock prices
Spot ethylene-oxide quotes remain highly sensitive to naphtha and natural-gas swings, squeezing standalone ethanolamines producers during sudden upcycles. Several South Korean crackers idled in early 2025 because negative olefin margins rendered operations uneconomic, tightening ethylene-oxide supply in the wider Asia-Pacific basin[3]ICIS Newsroom, “Asia Ethylene Oxide Market Overview Q1 2025,” icis.com. Integrated majors such as BASF and Dow weather volatility better by reallocating oxide streams to the highest-margin derivatives, underscoring structural advantages that reinforce market concentration. Freight disruptions through the Suez and Panama canals add further unpredictability to feedstock arbitrage flows. Smaller formulators respond by trimming run rates or passing through surcharges, yet prolonged price shocks risk demand destruction in price-sensitive applications like commodity detergents. Net impact is a near-term drag on the ethanolamines market until feedstock trends normalise.
Increasing weed resistance to weaken glyphosate demand
Confirmed cases of Amaranthus and Lolium species tolerant to glyphosate continue to climb across the Corn Belt and parts of Europe, prompting agronomists to recommend diversified herbicide programs. As farm-gate margins come under pressure, growers adopt variable-rate application maps that lower total glyphosate litres per hectare, subtly chipping away at ethanolamine consumption. Policy incentives for regenerative agriculture in the European Union push farmers toward mechanical weeding, cover crops and precision-spot treatments that further curb chemical volumes. Agrochemical giants allocate larger R&D budgets to new modes of action, some of which rely on alternative amine intermediates or none at all. Combined, these agronomic and regulatory headwinds exert a medium-term dampener on the ethanolamines market outlook.
*Our forecasts treat driver/restraint impacts as directional, not additive. The impact forecasts reflect baseline growth, mix effects, and variable interactions.
Segment Analysis
By Product Type: MEA dominance underpins volume stability
Monoethanolamine held 44.62% of 2025 revenues, supported by steady gas-sweetening runs, burgeoning carbon-capture pilots and broad detergent usage. The segment is forecast to post a 6.32% CAGR to 2031, reinforcing its anchor role in the ethanolamines market. Monoethanolamine’s high reactivity allows formulators to tailor a wide pH spectrum, sustaining cross-industry relevance. Meanwhile, diethanolamine retains a solid niche in metal-working fluids and herbicide neutralisation, with coproduct value uplift from improved corrosion-inhibition performance. Triethanolamine advances in cement grinding aids, delivering up to 5 MPa compressive-strength gains that shorten curing times on major infrastructure projects.
Diversification across three primary grades protects suppliers from demand swings in any one downstream sector. Carbon-capture retrofits in refineries and steel mills could sharply raise monoethanolamine call-offs, whereas personal-care premiumisation supports triethanolamine margin resilience. Together, these dynamics keep the ethanolamines market well balanced at the product level.


By Technology: Ethylene oxide route maintains scale advantage
The legacy ethylene-oxide process represented 91.75% of global throughput in 2025, reflecting decades of optimisation and sunk-capital advantages. Even so, the bio-ethanol pathway is predicted to accelerate at a 7.12% CAGR, propelled by renewable-content mandates and corporate net-zero targets. Early commercial plants in Thailand and Brazil demonstrate that agricultural-residue-derived bio-ethylene can integrate seamlessly into existing amination trains, reducing downstream qualification hurdles. Carbon-border-adjustment schemes in Europe tighten the cost gap by pricing embedded emissions, tilting future expenditures toward low-carbon routes.
Process intensification efforts—continuous reaction systems, membrane-based separations and catalysed rearrangements—keep legacy technology competitive on cash cost. Still, brand owners willing to pay premiums for certified-low-carbon molecules grant bio-based suppliers an attractive foothold. The resulting dual-pathway framework ensures ample supply while catalysing technology upgrades across the wider ethanolamines market.
By Application: Surfactants remain the volume workhorse
Surfactant and detergent manufacture absorbed 42.63% of total volumes in 2025, a position underpinned by non-ionic formulations for household cleaners and industrial degreasers. High-foaming, low-irritation profiles keep ethanolamine alkoxylates popular in fast-moving consumer goods, driving stable baseline demand. Herbicide formulations, while smaller today, are projected to grow 6.29% CAGR on the back of acreage expansion in Latin America and Africa. Gas treatment retains a strategic role for refineries and LNG export plants, granting monoethanolamine recurring, long-life sales tied to energy-transition retrofits.
Diversifying downstream footprints extend to cement additives that shorten curing cycles and cut clinker factor, water-based metal-working fluids tuned for electric-drive assemblies and niche pharmaceutical-buffer uses. This broad application matrix insulates the ethanolamines market from shocks in any single end-use segment.
By End-user Industry: Agriculture keeps leadership despite volatility
Agriculture held 32.88% of 2025 demand, reflecting the continued dominance of glyphosate and the rollout of novel post-emergent herbicides containing ethanolamine salts. Although weed resistance and regulatory scrutiny inject uncertainty, acreage growth and rising farm-input intensity keep medium-term prospects positive. Oil & gas processing remains a core outlet as amine-based gas-sweetening ensures pipeline-quality natural gas. Construction delivers incremental upside through cement and concrete improvers, especially in Southeast Asia’s infrastructure boom. Personal-care producers leverage certified-renewable ethanolamines to align with corporate carbon targets and consumer sustainability expectations.
This multi-sector exposure balances cyclical swings, cementing the ethanolamines market as a resilient chemical platform that flexibly satisfies both commodity and specialty requirements.
Geography Analysis
Asia-Pacific dominated with a 46.35% revenue share in 2025, buoyed by integrated petrochemical complexes, competitive labour and expanding downstream manufacturing hubs. Chinese refiners continually debottleneck mono-ethanolamine lines to serve domestic detergent and electronic-chemicals customers, while India’s bio-ethanol surge positions the subcontinent as a future export base for renewable ethanolamines. Southeast Asia’s agrochemical formulators, concentrated in Thailand and Vietnam, offer further pull as regional crop-protection spending climbs.
North America retains a robust production backbone anchored by Texas and Louisiana oxide-derivative clusters. INEOS’s USD 700 million purchase of LyondellBasell’s facility secures feedstock for long-term supply contracts with gas-sweetening licensors. Huntsman’s E-GRADE expansion in The Woodlands targets semiconductor-purification niches, giving the region a value-added hedge against commodity margin cycles.
Europe’s stringent carbon agenda steers investment toward low-emission units, exemplified by BASF’s 140,000-ton upgrade in Antwerp. Nouryon’s ISCC PLUS accreditation at Stenungsund spurs personal-care demand by enabling traceable renewable content. Carbon-border-adjustment pricing is expected to elevate import premiums on high-emission ethanolamines, indirectly favouring certified European output. Collectively, these regional dynamics sustain a balanced global network that underpins steady flows in the ethanolamines market.

Competitive Landscape
The ethanolamines market exhibits moderate consolidation, with vertically integrated majors leveraging structural feedstock access and regulatory expertise to defend share. INEOS’s feedstock-securing acquisition locks in oxide intermediates at advantaged cost and exemplifies the supply-chain-control strategy that top players pursue.
Differentiation increasingly revolves around sustainability credentials. Nouryon’s ISCC PLUS certification allows pass-through of green premiums to home-and-personal-care brand owners seeking verifiable low-carbon inputs. Emerging entrants focus on bio-ethanol routes and niche performance additives, yet significant capital intensity, strict exposure-limit regulations and entrenched customer relationships raise the barrier to rapid displacement.
Competitive intensity therefore hinges on capacity expansion timing, feedstock hedging capability and portfolio breadth across commodity and specialty grades—all of which shape margin trajectories in the ethanolamines market.
Ethanolamines Industry Leaders
Dow
SABIC
BASF
Huntsman Corporation
INEOS
- *Disclaimer: Major Players sorted in no particular order

Recent Industry Developments
- September 2024: BASF opened its new alkyl ethanolamine plant at the Verbund site in Antwerp, Belgium, boosting global capacity by nearly 30% to more than 140,000 tons annually.
- June 2024: Nouryon obtained ISCC PLUS certification for green ethylene oxide, ethanolamines and ethylene amines at its Stenungsund, Sweden facility, allowing customers to cut Scope 3 emissions.


Global Ethanolamines Market Report Scope
Ethanolamines are colorless, viscous organic compounds used as feedstock in the production of various chemical compounds such as monoethanolamine (MEA), diethanolamines (DEA), and others that are further used in the manufacture of emulsifiers, detergents, pharmaceuticals, and other products. The ethanolamines market is divided into three sections: product type, end-user industry, and geography. By product type, the market is segmented into monoethanolamine, diethanolamine, and triethanolamine. By end-user industry, the market is segmented into agriculture, construction, personal care, oil and gas, metallurgy and metalworking, textiles, and other end-user industries. The report also covers the market size and forecasts for the market in 15 countries across the globe. For each segment, the market sizing and forecasts have been done on the basis of value (USD million).
| Monoethanolamine (MEA) |
| Diethanolamine (DEA) |
| Triethanolamine (TEA) |
| Ethylene Oxide Route |
| Bio-ethanol Route |
| Gas Treatment |
| Herbicides (Glyphosate) |
| Surfactants & Detergents |
| Cement & Concrete Additives |
| Personal-care Formulations |
| Metal-working Fluids |
| Other Applications |
| Oil and Gas |
| Agriculture |
| Construction |
| Personal Care |
| Textile |
| Metallurgy and Metalworking |
| Other End-user Industries |
| Asia-Pacifc | China |
| India | |
| Japan | |
| South Korea | |
| Rest of Asia-Pacific | |
| North America | United States |
| Canada | |
| Mexico | |
| Europe | Germany |
| United Kingdom | |
| France | |
| Italy | |
| Rest of Europe | |
| South America | Brazil |
| Argentina | |
| Rest of South America | |
| Middle East and Africa | Saudi Arabia |
| South Africa | |
| Rest of Middle East and Africa |
| By Product Type | Monoethanolamine (MEA) | |
| Diethanolamine (DEA) | ||
| Triethanolamine (TEA) | ||
| By Technology | Ethylene Oxide Route | |
| Bio-ethanol Route | ||
| By Application | Gas Treatment | |
| Herbicides (Glyphosate) | ||
| Surfactants & Detergents | ||
| Cement & Concrete Additives | ||
| Personal-care Formulations | ||
| Metal-working Fluids | ||
| Other Applications | ||
| By End-user Industry | Oil and Gas | |
| Agriculture | ||
| Construction | ||
| Personal Care | ||
| Textile | ||
| Metallurgy and Metalworking | ||
| Other End-user Industries | ||
| By Geography | Asia-Pacifc | China |
| India | ||
| Japan | ||
| South Korea | ||
| Rest of Asia-Pacific | ||
| North America | United States | |
| Canada | ||
| Mexico | ||
| Europe | Germany | |
| United Kingdom | ||
| France | ||
| Italy | ||
| Rest of Europe | ||
| South America | Brazil | |
| Argentina | ||
| Rest of South America | ||
| Middle East and Africa | Saudi Arabia | |
| South Africa | ||
| Rest of Middle East and Africa | ||


Key Questions Answered in the Report
What is the current Ethanolamines Market size?
The ethanolamines market size reached USD 4.02 billion in 2026 and is projected to touch USD 4.93 billion by 2031, advancing at a 4.16% CAGR.
Which product grade leads global demand?
Monoethanolamine dominates, holding 44.62% revenue share in 2025 and benefiting from a 6.32% CAGR outlook to 2031.
How fast is the bio-ethanol production route growing?
Bio-based technology is set to expand at a 7.12% CAGR through 2031 as brands and regulators push for renewable content.
Why does Asia-Pacific command the largest regional share?
Integrated petrochemical hubs, large detergent and herbicide industries and rapid industrialisation gave Asia-Pacific 46.35% of global sales in 2025.
Page last updated on:


