Active Protection Systems Market Size and Share
Market Overview
| Study Period | 2020 - 2031 |
|---|---|
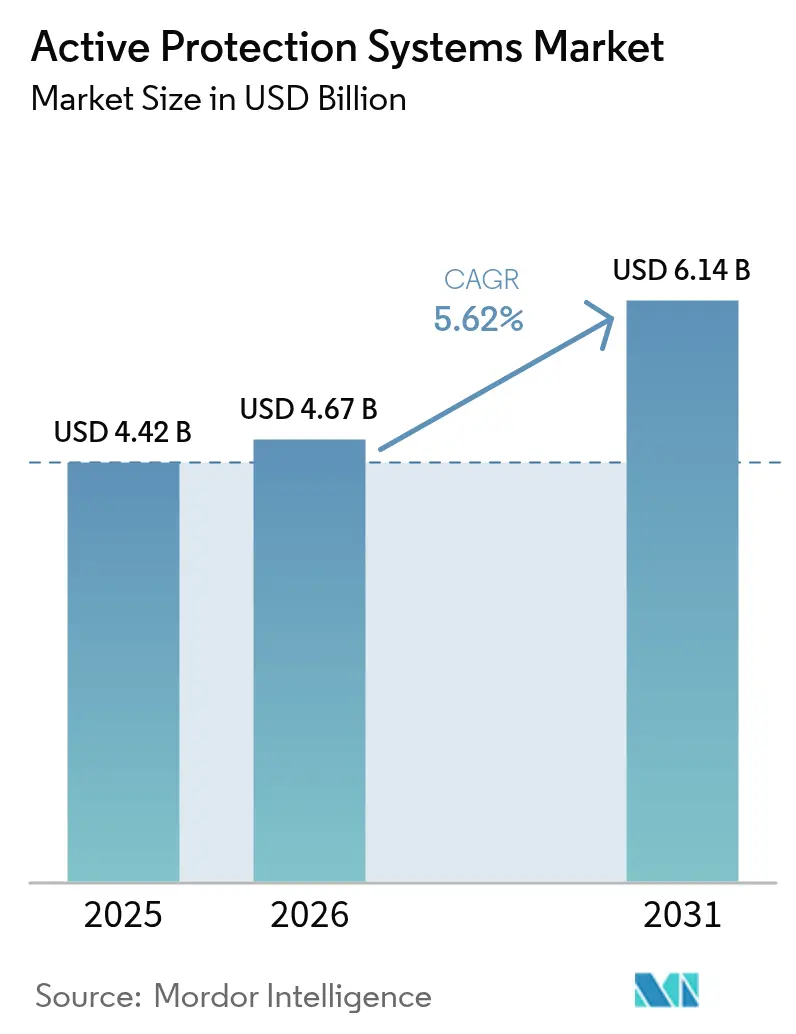
| Market Size (2026) | USD 4.67 Billion |
| Market Size (2031) | USD 6.14 Billion |
| Growth Rate (2026 - 2031) | 5.62% CAGR |
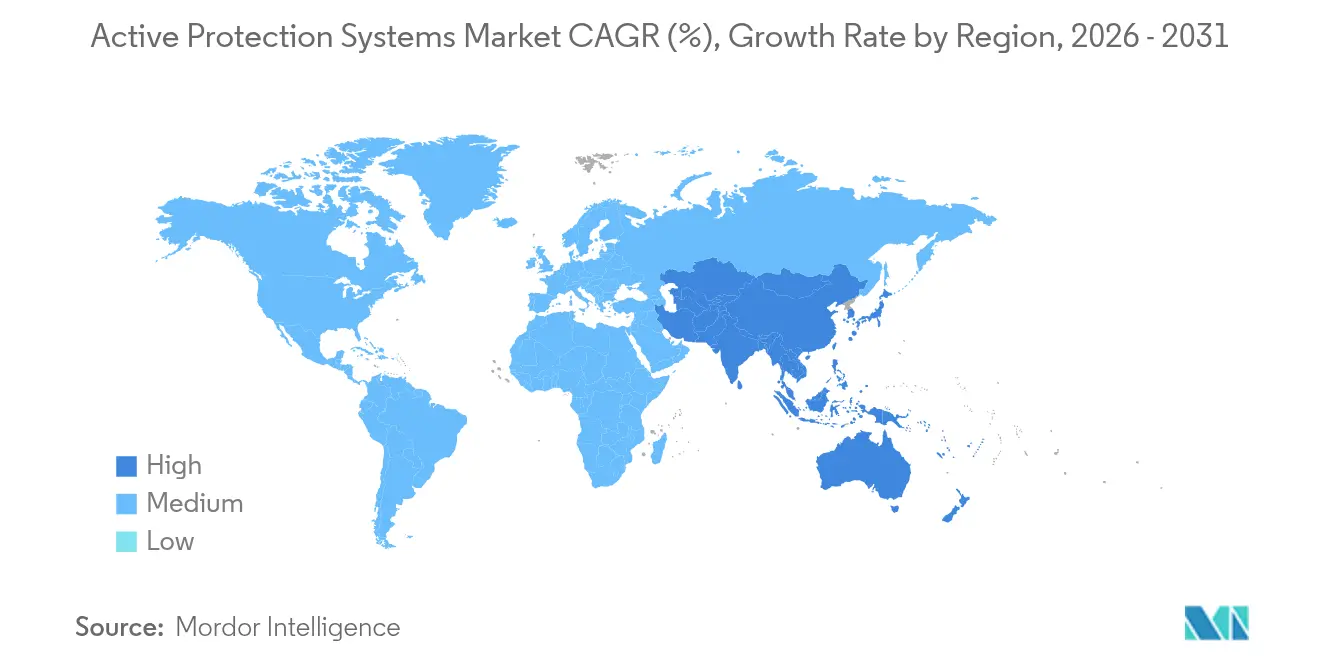
| Fastest Growing Market | Asia Pacific |
| Largest Market | Europe |
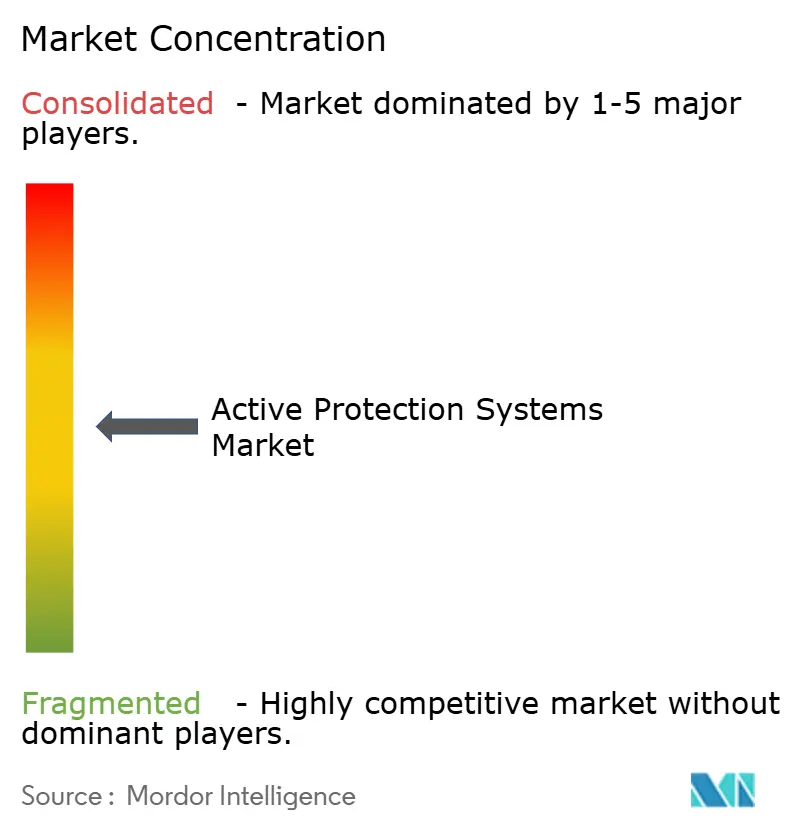
| Market Concentration | Medium |
Major Players *Disclaimer: Major Players sorted in no particular order Image © Mordor Intelligence. Reuse requires attribution under CC BY 4.0. | |
Active Protection Systems Market Analysis by Mordor Intelligence
The active protection systems market size was valued at USD 4.42 billion in 2025 and estimated to grow from USD 4.67 billion in 2026 to reach USD 6.14 billion by 2031, at a CAGR of 5.62% during the forecast period (2026-2031). It is forecasted to expand to USD 5.91 billion by 2030, advancing at a 5.98% CAGR as militaries race to harden vehicles against proliferating anti-tank guided missiles and loitering munitions. NATO’s mandate for APS-equipped main battle tanks and European programs account for the largest share. At the same time, fast-growing Asia-Pacific budgets fund indigenous solutions that lessen dependence on foreign suppliers.[1]Source: European Commission, “ReArm Europe Plan,” ieu-monitoring.com Demand is shifting toward integrated hard-kill and AI-enabled soft-kill countermeasures that classify and defeat threats in microseconds, curbing collateral damage risks in urban settings. Supply-chain fragility around gallium nitride chips continues to temper near-term output. Yet, venture funding above USD 500 million in 2024–2025 is accelerating sensor-fusion and directed-energy prototypes that promise step-change protection levels.
Key Report Takeaways
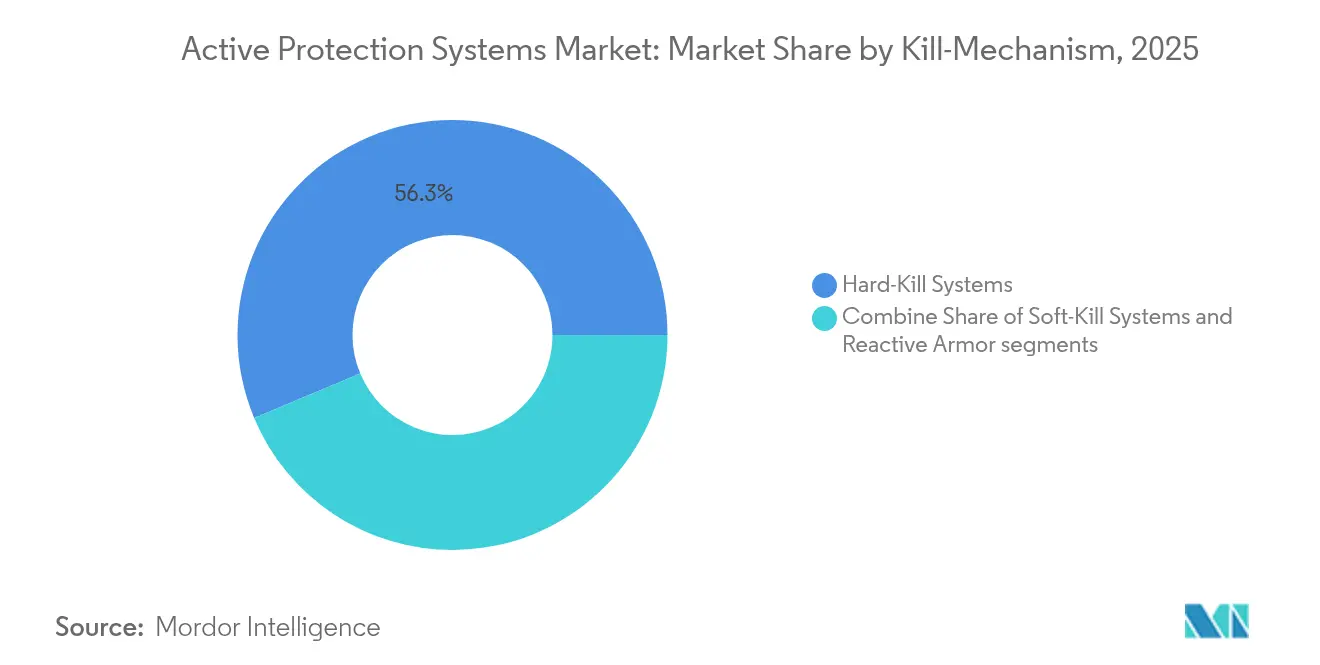
- By kill mechanism, hard-kill systems led with 56.30% of the active protection systems market share in 2025; soft-kill countermeasures are projected to rise at 7.28% CAGR through 2031.
- By platform, land platforms accounted for 72.90% of the market size of active protection systems in 2025, while airborne platforms are set to grow at 8.05% CAGR by 2031.
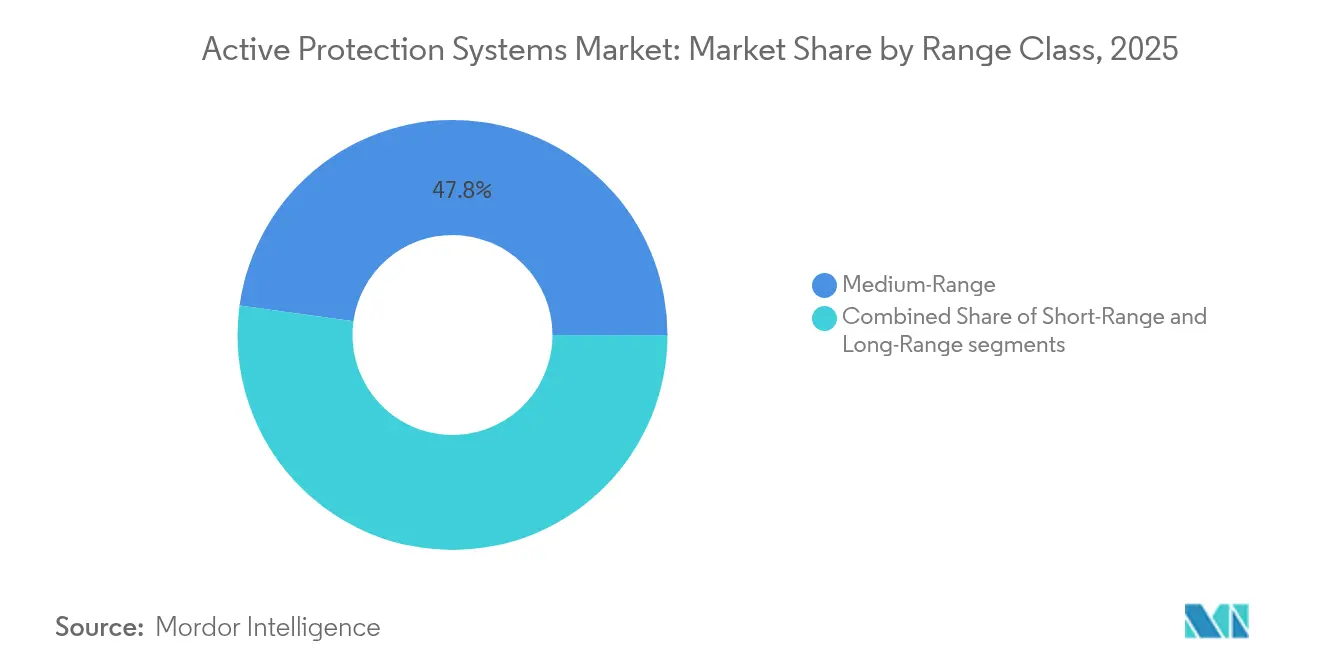
- By range class, medium-range solutions captured a 47.80% share of the active protection systems market in 2025; long-range systems are forecasted to expand at a 6.95% CAGR between 2026 and 2031.
- By end user, defense forces dominated with 91.10% of the active protection systems market share in 2025, while homeland security users are poised for 7.62% CAGR over the same period.
- By region, Europe led with 38.40% revenue share in 2025, whereas Asia-Pacific is expected to post the fastest 6.55% CAGR through 2031.
Note: Market size and forecast figures in this report are generated using Mordor Intelligence’s proprietary estimation framework, updated with the latest available data and insights as of 2026.
Global Active Protection Systems Market Trends and Insights
Drivers Impact Analysis*
| Driver | (~) % Impact on CAGR Forecast | Geographic Relevance | Impact Timeline |
|---|---|---|---|
| NATO mandate for APS-equipped MBTs by 2030 | +1.2% | Europe, North America | Medium term (2-4 years) |
| Rapid integration of AI sensor-fusion chips | +0.9% | Global | Short term (≤ 2 years) |
| US MAPS open-architecture procurement wave | +0.8% | North America, allied nations | Medium term (2-4 years) |
| Electrically powered soft-kill launchers cut SWaP | +0.6% | Global | Long term (≥ 4 years) |
| Ukrainian conflict lessons accelerating retrofits | +1.1% | Europe, Eastern Europe | Short term (≤ 2 years) |
| Venture-backed drone-swarm defeat modes | +0.7% | Global, concentrated in US/Europe | Medium term (2-4 years) |
| Source: Mordor Intelligence | |||
NATO Mandate for APS-Equipped MBTs by 2030
NATO’s STANAG 4686 sets unified performance baselines that have spurred member-state spending on common APS solutions, lowering per-unit costs and standardizing logistics across Leopard 2A8 and Challenger 3 fleets. Contract awards worth EUR 800 billion (USD 943.72 billion) under the ReArm Europe Plan earmark survivability upgrades as a top priority, pulling forward procurement to meet the 2030 deadline. The resulting scale advantages favour established vendors with combat-proven hardware and shorten certification cycles for incremental upgrades.
Rapid Integration of AI Sensor-Fusion Chips
Machine-learning models running on gallium nitride radar processors allow APS to predict projectile behaviour, trim false-positive alerts, and choose the least destructive countermeasure.[2]Source: HENSOLDT, “Sensor-Fusion Solutions,” hensoldt.net Performance gains are tied to semiconductor supply, which remains vulnerable to Chinese gallium export limits that have already prompted US DARPA initiatives for alternative wafers.
US MAPS Open-Architecture Procurement Wave
The Modular Active Protection System program embraces sensor-agnostic and effector-agnostic standards, enabling plug-and-play upgrades on Abrams and Stryker formations. This model widens the supplier base to niche AI and electro-optic start-ups, compresses refresh cycles, and mitigates vendor lock-in risks that historically slowed US Army survivability roadmaps.
Ukrainian Conflict Lessons Accelerating Retrofits
Front-line data confirm that reactive armour alone cannot stop modern ATGMs and FPV drones, pushing NATO members to retrofit proven APS kits on in-service fleets within two-year windows. Russia’s Arena-M fielding has mirrored this urgency, but Western solutions retain an edge in sensor discrimination accuracy. Accelerated timelines privilege ready-to-deliver systems and sideline untested concepts.
Restraints Impact Analysis*
| Restraint | (~) % Impact on CAGR Forecast | Geographic Relevance | Impact Timeline |
|---|---|---|---|
| Electromagnetic compatibility failures on legacy vehicles | -0.8% | Global, particularly older fleet operators | Short term (≤ 2 years) |
| Export-control restrictions on GaN radar chips | -0.6% | Global, concentrated in Asia-Pacific | Medium term (2-4 years) |
| High false-positive rates in dense urban terrain | -0.5% | Urban-focused deployments globally | Long term (≥ 4 years) |
| Fragmentation-injury liability risk for peace-keeping ops | -0.3% | UN peacekeeping regions, Africa/Middle East | Long term (≥ 4 years) |
| Source: Mordor Intelligence | |||
Electromagnetic Compatibility Failures on Legacy Vehicles
Vintage armoured vehicles lack shielding for high-power radar bursts, forcing costly rewiring that can exceed APS price tags and delay fielding.[3]Source: CORDIS, “EMC Challenges in Armoured Vehicles,” cordis.europa.eu Operators must trade off between partial capability loss during activations or full electrical refits, constraining retrofit addressability on pre-2000 platforms.
Export-Control Restrictions on GaN Radar Chips
Gallium nitride (GaN) embargoes raise lead times and compel design pivots toward lower-performance semiconductors, splitting the active protection systems market into technology ‘haves’ and ‘have-nots’ based on geopolitical ties. Complex licensing also increases sales-cycle friction for smaller vendors with limited compliance staff.
*Our forecasts treat driver/restraint impacts as directional, not additive. The impact forecasts reflect baseline growth, mix effects, and variable interactions.
Segment Analysis
By Kill Mechanism: Hard-Kill Reliability and Soft-Kill Agility
Hard-kill systems controlled 56.30% of 2025 revenue in the active protection systems market share, reflecting operator trust in interceptors that physically destroy shaped-charge and kinetic-energy penetrators mid-flight. Elbit Systems’ Iron Fist demonstration against 120 mm sabot rounds proved that compact launchers can neutralize high-velocity projectiles, prompting armies to adopt layered defenses that mix explosive countermeasures with passive armor. Mature hard-kill designs such as Rafael’s Trophy now integrate AI target prioritization, enabling vehicles to defeat multiple threats arriving within milliseconds of one another and to log telemetry that feeds continuous software updates. The ability to re-stock launch-tubes quickly on forward operating bases lowers downtime. It keeps combat units in theater, a logistical advantage that resonates with NATO planners tasked to keep mechanized brigades operational for extended rotations.
Soft-kill launchers remain the smaller revenue pool, yet their 7.28% CAGR underlines a strategic pivot toward non-lethal defeat modes that reduce collateral damage and meet urban-warfare rules of engagement. Electrically triggered multispectral smoke and IR dazzlers eliminate the need for explosive cartridges, cutting weight, boosting magazine depth, and lowering life-cycle costs. Neural-network classifiers now decide in real time whether to blind the seeker or spoof its guidance loop, trimming false activations that plagued first-generation jammers. These features make soft-kill suites attractive for peace-support missions, VIP convoys, and homeland-security fleets that operate close to civilian populations. As governments impose tighter restrictions on fragmentation risk, suppliers that can certify near-zero civilian harm are positioned to gain market share.


By Platform: Land Vehicles Dominate as Airborne Demand Accelerates
Land vehicles generated 72.90% of the active protection systems market size in 2025, buoyed by mass retrofit programs that place Trophy, Iron Fist, and StrikeShield on Leopard 2, Abrams, and Bradley fleets across Europe and the United States. These tracked platforms already carry sufficient power reserves and offer generous hull real estate, simplifying sensor mast placement and wiring runs. Program offices also benefit from decades of integration know-how, established depot-level maintenance, and a ready cadre of trainers who can certify crews within weeks. The result is a predictable acquisition pathway that lets ministries of defence obligate multi-year funds without excessive technical risk.
Airborne demand grows at an 8.05% CAGR as unmanned combat aerial vehicles and rotary-wing assets require protection from shoulder-launched missiles and kamikaze drones. Trophy-Light and similar derivatives trim radar aperture size and substitute explosive interceptors with directed-energy pulses to remain within stringent weight envelopes. Developers also pair compact AESA panels with conformal laser dazzlers to protect tiltrotor craft during shipboard and austere-field take-offs, environments where man-portable threats are most acute. Early flight tests on UH-60 and V-280 prototypes show negligible impact on range or payload, removing a key objection from aviation program managers. As distributed-operations doctrine pushes helicopters into small, dispersed landing zones, the value proposition of airborne APS shifts from nice-to-have to mandatory.
By Range Class: Medium-Range Sweet-Spot and Emerging Long-Range Layer
Medium-range interceptors held a 47.80% share of the active protection systems market in 2025, offering a 10 to 100 m stand-off that balances radar horizon with the need to avoid triggering on civilian clutter. Their cost-to-coverage ratio makes them the baseline layer on most NATO IFVs, and the architecture readily scales from four-sensor to six-sensor arrays as vehicle commanders demand 360-degree envelopes. Integrated battle-management software now cues fire-control radar only when infrared trackers detect a likely hostile object, slashing emissions that could reveal vehicle positions.
Long-range concepts are advancing at a 6.95% CAGR as armies confront hypersonic glide vehicles, top-attack missiles, and drone swarms that require earlier engagement. NATO field manuals now describe multi-layer “APS-plus-SHORAD” constructs. Long-range packets hand off surviving threats to medium- and short-range nodes, ensuring vertical and horizontal depth. Vendors are experimenting with dual-pulse interceptors and mini-missiles that share propulsion stacks with shipboard close-in weapon systems, reducing per-shot costs through cross-domain commonality. As software-defined waveforms enable sensors to extend detection to 3 km and beyond, the line between APS and vehicle-mounted air defense continues to blur, opening budget pools previously reserved for brigade air defense programs.
By End User: Military Predominance Meets Homeland-Security Uptake
Defense forces absorbed 91.10% of the 2025 demand, a function of high unit prices and clear doctrinal metrics that tie vehicle survivability directly to combat-power retention. Government-to-government channels accelerate approvals, while offset agreements funnel subsystem production into domestic factories, aligning industrial-policy goals with procurement calendars. Multi-year umbrella contracts let armies buy spares and software patches under the same line item, easing sustainment budgeting and encouraging incremental capability drops rather than costly block upgrades.
Homeland-security users are growing at 7.62% CAGR as paramilitary police, border forces, and energy-infrastructure guards equip high-value vehicles with soft-kill curtains that obscure thermal signatures and mislead commercial drones. These agencies often co-fund R&D with defence ministries, leveraging dual-use grants to offset acquisition outlays. AI-enabled shot selection lets crews operate safely within crowded urban corridors, and the non-lethal nature of smoke-screen or laser-dazzle rounds satisfies civilian oversight bodies. As autonomous delivery drones and hobbyist quadcopters proliferate, demand for scalable, regulation-friendly APS solutions is expected to migrate from tactical SWAT units to municipal emergency services fleets, widening the customer base beyond traditional security organs.
Geography Analysis
Europe retained leadership with 38.40% of 2025 revenue after Germany and the United Kingdom standardised on Trophy APS, catalysing follow-on buys across the Nordics, Italy, and Poland. The ReArm Europe Plan directs EUR 800 billion (USD 943.72 billion) to plug capability gaps, prioritising vehicle survivability kits that meet NATO interchangeability rules.
Asia-Pacific delivers the fastest 6.55% CAGR; Japan’s Type 10 upgrades, South Korea’s K2 enhancements, and India’s in-house programmes reinforce regional supply chains that lower dependence on US Foreign Military Sales timelines. East Asia defence spending climbed 6.2% to USD 411 billion in 2023, providing a durable funding base for local sensor-fusion chip foundries.
North America profits from MAPS open-architecture rollouts and robust venture investment that incentivises microwave and laser start-ups, while the Middle East leverages high oil revenues to import kinetic and directed-energy layers; Saudi Arabia alone earmarked USD 78 billion for defence in 2025. Israel’s export of Arrow 3 and Iron Beam variants underlines the region’s appetite for bleeding-edge survivability beyond traditional armor.

Competitive Landscape
The active protection systems market is moderately fragmented: top Israeli, German, and US primes hold combat-proven portfolios, yet more than 20 mid-tier firms supply sensors, launchers, or AI middleware. Rafael capitalises on Trophy’s unrivalled operational record to secure serial production slots on Leopard 2A8, Challenger 3, and Abrams variants. Rheinmetall differentiates via StrikeShield’s hybrid reactive-active tiles that shave weight relative to bolt-on cages, while Elbit Systems positions Iron Fist as a lower-cost alternative for IFVs.
Strategic consolidation is accelerating. AeroVironment’s USD 4.1 billion BlueHalo acquisition combines loitering-munition know-how with counter-swarm algorithms, creating a vertically integrated drone-to-defence powerhouse. Anduril’s purchase of Numerica’s radar business complements its Lattice AI platform and signals a move into hardened vehicle markets previously dominated by legacy primes.
White-space opportunities revolve around reducing false alarms in megacities. Start-ups targeting AI-driven scene understanding, low-SWaP solid-state launchers, and non-kinetic microwave beams are drawing sizeable venture rounds, evidencing investor belief that software-defined protection will drive the next competitive reshuffle.
Active Protection Systems Industry Leaders
Rafael Advanced Defense Systems Ltd.
Rheinmetall AG
BAE Systems plc
Elbit Systems Ltd
ASELSAN A.Ş.
- *Disclaimer: Major Players sorted in no particular order

Recent Industry Developments
- March 2025: SaaB AB, in partnership with Ukrainian defense firm Radionix, inked a Memorandum of Understanding (MoU) to forge a strategic alliance in sensors and defense electronics, bolstering Ukraine's defense capabilities. This collaboration zeroes in on developing and maintaining sensors and defense electronics across various domains, harnessing the unique strengths of both companies.
- February 2025: HENSOLDT AG secured a contract worth EUR 17.6 million (USD 18.4 million) from the German Federal Office of Bundeswehr Equipment, Information Technology, and In-Service Support (BAAINBw). The contract is for developing an optical detection system demonstrator named Odaeon. Odaeon leverages HENSOLDT's Jammer Head 2 technology, part of its Multifunctional Self-Protection System (MUSS). The project contract extends until the close of 2026, with BAAINBw set to test the demonstrator that year.


Global Active Protection Systems Market Report Scope
An active protection system (APS) is a close-in weapon system (CIWS) that acts as the last line of defense and is deployed to prevent the incoming projectile from having a direct impact on the target. The report includes both hard-kill and soft-kill systems installed onboard military assets, such as main battle tanks (MBTs), and naval assets, such as frigates and destroyers. The hard-kill systems include rocket/missile-based, gun-based, and reactive armour-based weaponry that physically counterattacks an incoming threat thereby destroying/altering its payload/warhead in such a way that the intended effect on the target is severely impeded. The soft kill systems include electronic countermeasures, such as electro-optic jammer, radar decoy, and infrared decoy, that alter the electromagnetic, acoustic, or other signature of the target thereby altering the tracking and sensing behaviour of an incoming threat.
The active protection systems market is segmented by type, platform, and geography. By type, the market is segmented into hard-kill systems and soft-kill systems. By platform, the market is segmented into terrestrial and naval. The report also covers the market sizes and forecasts in 11 countries across major regions. For each segment, the market sizing has been done in terms of value (USD).
| Hard-Kill Systems |
| Soft-Kill Systems |
| Reactive Armor |
| Land |
| Marine |
| Airborne |
| Short-Range |
| Medium-Range |
| Long-Range |
| Defense Forces |
| Homeland Security and Paramilitary |
| North America | United States | |
| Canada | ||
| Mexico | ||
| Europe | United Kingdom | |
| Germany | ||
| France | ||
| Russia | ||
| Rest of Europe | ||
| Asia-Pacific | China | |
| Japan | ||
| India | ||
| South Korea | ||
| Australia | ||
| Rest of Asia-Pacific | ||
| South America | Brazil | |
| Rest of South America | ||
| Middle East and Africa | Middle East | Israel |
| United Arab Emirates | ||
| Saudi Arabia | ||
| Rest of Middle East | ||
| Africa | South Africa | |
| Rest of Africa | ||
| By Kill-Mechanism | Hard-Kill Systems | ||
| Soft-Kill Systems | |||
| Reactive Armor | |||
| By Platform | Land | ||
| Marine | |||
| Airborne | |||
| By Range Class | Short-Range | ||
| Medium-Range | |||
| Long-Range | |||
| By End-User | Defense Forces | ||
| Homeland Security and Paramilitary | |||
| By Geography | North America | United States | |
| Canada | |||
| Mexico | |||
| Europe | United Kingdom | ||
| Germany | |||
| France | |||
| Russia | |||
| Rest of Europe | |||
| Asia-Pacific | China | ||
| Japan | |||
| India | |||
| South Korea | |||
| Australia | |||
| Rest of Asia-Pacific | |||
| South America | Brazil | ||
| Rest of South America | |||
| Middle East and Africa | Middle East | Israel | |
| United Arab Emirates | |||
| Saudi Arabia | |||
| Rest of Middle East | |||
| Africa | South Africa | ||
| Rest of Africa | |||


Key Questions Answered in the Report
What is the current size of the active protection systems market?
The market is valued at USD 4.67 billion in 2026 and is projected to reach USD 6.14 billion by 2031, advancing at a 5.62% CAGR during the forecast period (2026-2031).
Which region leads the active protection systems market?
Europe holds the largest 38.40% revenue share, propelled by NATO mandates and large-scale MBT upgrade programs.
Which segment is growing the fastest?
Airborne platforms exhibit the highest 8.05% CAGR due to lightweight solutions for unmanned aircraft and helicopters.
What is driving adoption of AI in active protection systems?
AI-enabled sensor fusion cuts false-positive rates and enables microsecond threat classification, crucial for urban deployments.
How are GaN export controls affecting suppliers?
Restrictions on gallium nitride (GaN) chips extend lead times and push manufacturers to source alternative semiconductors or redesign radar modules.
Page last updated on:


