Acoustic Camera Market Size and Share
Market Overview
| Study Period | 2019 - 2030 |
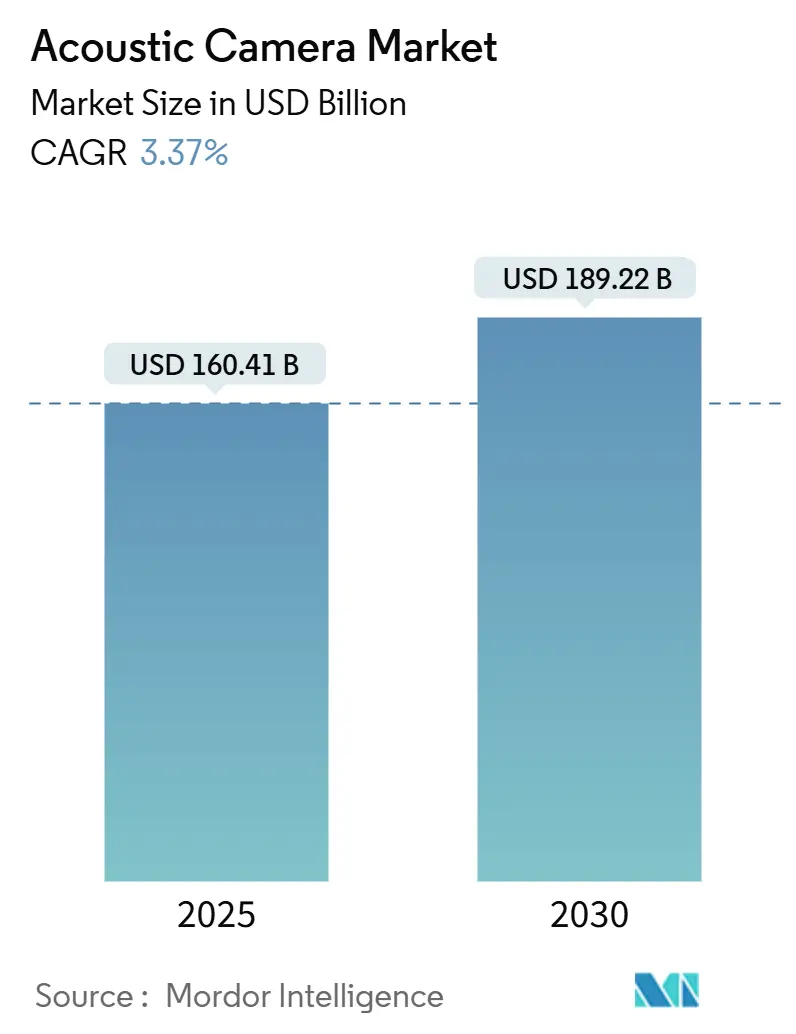
| Market Size (2025) | USD 160.41 Billion |
| Market Size (2030) | USD 189.22 Billion |
| Growth Rate (2025 - 2030) | 3.37% CAGR |
| Fastest Growing Market | Asia Pacific |
| Largest Market | North America |
| Market Concentration | Medium |
Major Players*Disclaimer: Major Players sorted in no particular order Image © Mordor Intelligence. Reuse requires attribution under CC BY 4.0. |
|
Acoustic Camera Market Analysis by Mordor Intelligence
The acoustic camera market was valued at USD 160.41 billion in 2025 and is forecast to reach USD 189.22 billion by 2030, expanding at a 3.37% CAGR. Cost reductions in MEMS microphone arrays and the arrival of compact edge-AI processors have lowered system bills-of-materials below USD 5,000, moving acoustic imaging from research laboratories into factory floors and city streets. Municipal authorities are deploying noise-enforcement cameras, automotive engineers are digitizing NVH testing for electric vehicles, and utilities are pairing beamforming modules with predictive-maintenance platforms. Edge analytics now runs on-device, trimming cloud bandwidth and latency while widening use cases in remote assets. Competitive activity centers on algorithm efficiency and software ecosystems rather than scale, allowing niche innovators to stand alongside diversified test-instrument majors. [1]European Commission, “EU Noise Policy,” europa.eu
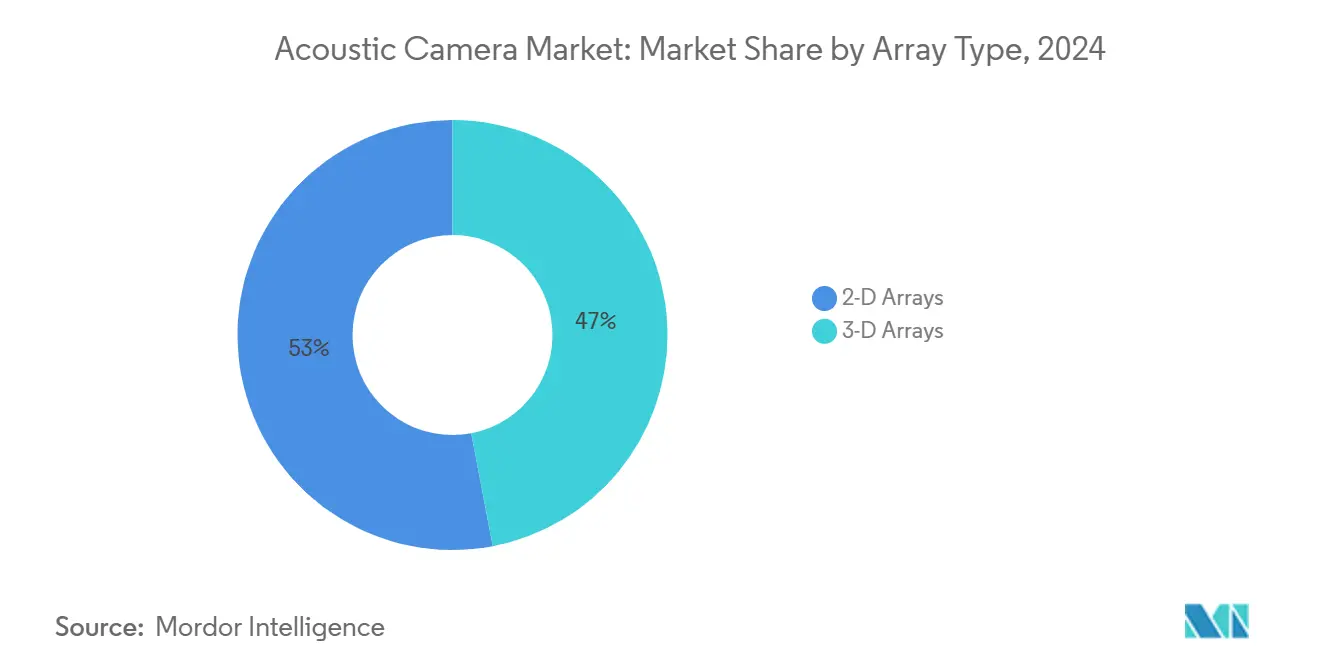
By array technology, 2-D arrays held 53% of the acoustic camera market share in 2024, while 3-D arrays are forecast to advance at a 16.2% CAGR to 2030.
By measurement type, near-field systems accounted for 61% of the acoustic camera market size in 2024; far-field platforms are projected to grow at a 14.8% CAGR through 2030.
By application, noise source identification led with 46% revenue share in 2024; mechanical fault diagnostics is expected to post an 18.9% CAGR to 2030.
By end-user industry, the energy and power segment are set to expand at a 15.0% CAGR between 2025 and 2030.
By geography, Europe commanded 31% revenue in 2024, while APAC is forecast to climb at a 14.3% regional CAGR through 2030.
Global Acoustic Camera Market Trends and Insights
Drivers Impact Analysis
| Driver | (~) % Impact on CAGR Forecast | Geographic Relevance | Impact Timeline |
|---|---|---|---|
| Tightening global urban-noise regulations | 0.80% | Global, with early adoption in Europe & North America | Medium term (2-4 years) |
| Rapid NVH digitalisation in e-mobility platforms | 0.90% | Global, concentrated in automotive manufacturing hubs | Short term (≤ 2 years) |
| Shift from handheld sound-level meters to imaging sensors on smart factories | 0.60% | APAC core, spill-over to North America & Europe | Medium term (2-4 years) |
| Rising aerospace cabin-comfort certification thresholds | 0.40% | North America & Europe, expanding to APAC | Long term (≥ 4 years) |
| Edge-AI beamforming modules enable sub-USD 5,000 BOM acoustic cameras | 0.70% | Global, with fastest adoption in cost-sensitive markets | Short term (≤ 2 years) |
| Integration into autonomous-robot inspection payloads | 0.30% | Global, with early gains in industrial automation centers | Long term (≥ 4 years) |
Source: Mordor Intelligence
Tightening Global Urban-Noise Regulations
Municipal agencies are moving from point sound-level meters to spatial imaging that links violations to individual vehicles. European and North American cities installed camera-based noise radars during 2024, and solutions such as SoundVue deliver Class 1 accuracy that satisfies legal-evidence requirements. The European Union targets a 30% cut in transport noise by 2030, spurring long-term procurement of rugged outdoor acoustic cameras. Preference is shifting toward permanent roadside units over mobile trailers, anchoring multi-year hardware demand and service contracts.
Rapid NVH Digitalization in E-Mobility Platforms
Electric powertrains silence combustion masking, unveiling tonal signatures from motors, inverters, and HVAC ducts. Automakers boosted acoustic test budgets during 2024; Hyundai adopted 3-D scanning rigs for full interior mapping. Real-time beamforming lets engineers visualize radiation patterns under actual driving, closing corrective loops before start-of-production. Growing fleets of commercial vans and city buses adopt the same methodologies to meet comfort and regional noise-homologation rules.
Shift from Handheld Sound-Level Meters to Imaging Sensors on Smart Factories
Industrial plants are replacing walk-around meters with wall-mounted or handheld imagers able to screen entire workshops. Products such as the Fluke ii900 detect compressed-air leaks 70 m away, while SV600 fixed imagers feed alarms into SCADA dashboards. Paybacks often land within months because compressed air losses inflate utility bills. Acoustic cameras operate at safe standoff distances, supporting condition-based maintenance without stopping production lines.
Rising Aerospace Cabin-Comfort Certification Thresholds
FAA Advisory Circular 36-4D and European standards require granular noise mapping during aircraft development. [3]Federal Aviation Administration, “Advisory Circular 36-4D,” faa.gov Urban-air-mobility prototypes undergo similar scrutiny as community impacts become critical. Aerospace OEMs are fitting anechoic chambers with large-aperture arrays to pinpoint trim panel buzz or hydraulic pump whine. Digital storage of spatial sound fields ensures traceable compliance documentation throughout the airframe life cycle. [2]NASA, “Urban Air Mobility Noise Research,” nasa.gov
Restraints Impact Analysis
| Restraint | (~) % Impact on CAGR Forecast | Geographic Relevance | Impact Timeline |
|---|---|---|---|
| High upfront capex for 3D MEMS-array rigs | -0.50% | Global, with higher impact in cost-sensitive markets | Short term (≤ 2 years) |
| Scarcity of field-calibration standards across regions | -0.30% | Global, with regional variations in standards adoption | Medium term (2-4 years) |
| Patent thickets around delay-and-sum beam-forming IP | -0.20% | Global, concentrated in technology-intensive markets | Long term (≥ 4 years) |
| Limited ruggedised options for harsh-weather utilities | -0.20% | Global, with higher impact in extreme climate regions | Medium term (2-4 years) |
Source: Mordor Intelligence
High Upfront Capex for 3-D MEMS-Array Rigs
Research-grade 3-D configurations can exceed USD 100,000 because hundreds of phase-matched microphones, precision housings, and high-bandwidth converters raise material and assembly costs. Optical MEMS microphones now deliver 80 dB SNR, yet process tooling and yield learning curves postpone sweeping price drops. Small enterprises lean on shared-service laboratories or rent 3-D systems until modular arrays below USD 50,000 proliferate.
Scarcity of Field-Calibration Standards Across Regions
IEC 61094 offers laboratory methods, but accredited facilities remain unevenly distributed. Portable cameras used outdoors often need onsite calibration, yet reference sources for multi-channel arrays are scarce. Disparate protocols slow cross-border deployments because instruments qualified in one jurisdiction may require recertification elsewhere. Global standard harmonization and field calibration products remain open opportunities for suppliers.
Segment Analysis
By Array Type: 3-D Arrays Drive Premium Applications
2-D architectures retained 53% share of the acoustic camera market in 2024 owing to proven reliability and lower pricing. They dominate plant leak surveys and automotive component checks. Meanwhile, 3-D units are moving at a 16.2% CAGR as cabin noise mapping, urban-air-mobility trials, and complex machinery enclosures call for full-volume localization. The Octagon system with 192 microphones demonstrates resolution across 20 Hz to 10 kHz bands. As MEMS costs ease, the acoustic camera market size for 3-D platforms is expected to close the gap with mainstream options. Artificial-intelligence pattern recognition is improving hit rates, allowing smaller apertures to match legacy performance.
System integrators embed real-time visualization within CAD dashboards, so engineers iterate acoustic treatments in minutes rather than days. This workflow compression justifies premiums in aerospace and luxury vehicle segments. Prototype 3-D arrays shipped in 2024 at under USD 60,000, signalling a trajectory toward broader adoption among mid-tier suppliers and university labs.
By Measurement Type: Far-Field Applications Accelerate
Near-field setups commanded 61% revenue in 2024 thanks to clear standards and controlled environments. Chamber testing, gearbox analysis, and benchtop RandD remain anchor use cases. Far-field demand is climbing at a 14.8% CAGR in step with wind turbine noise audits, smart city sound mapping, and aircraft pass-by trials. Minimum variance distortion less response algorithms now separate sources more than 50 m away despite heavy background traffic. As a result, the acoustic camera market size for long-range systems is projected to double through 2030. Infrastructure managers integrate data into geospatial dashboards that overlay acoustic metrics on facility blueprints for quick dispatch of repair crews.
Field operators value rugged enclosures rated IP65 or higher and low-power edge processors that relay alerts over 4G or LoRaWAN. Vendors emphasizing ease of installation and cloud APIs are winning bids in municipal tenders and renewable-energy farms.
By Application: Mechanical Fault Diagnostics Emerges
Noise source identification held 46% revenue in 2024 and remains the entry point for adopters. Mature toolchains and analyst familiarity support ongoing replacement of single-channel meters. Mechanical fault diagnostics, however, is poised for 18.9% CAGR growth as rotating equipment owners pivot to condition-based maintenance. Ice accretion on wind blades, pressure-relief valve chatter, and gearbox pitting generate high-frequency emissions that cameras capture before catastrophic failure. The acoustic camera market share for this segment is expected to expand steadily through early adoption by energy providers.
Machine-learning libraries now flag anomalies automatically, reducing engineering hours. Early pilots documented maintenance cost savings of up to 30% versus interval-based inspections. Facility managers thus prioritize cross-training vibration technicians on acoustic imaging to leverage existing predictive-maintenance budgets.
By End-User Industry: Energy Sector Transformation
Automotive retained 34% revenue in 2024 tied to stringent pass-by noise rules and rising electric-vehicle complexity. Production lines mount cameras at end-of-line stations to catch seat squeak, trim buzz, or inverter whine. Energy and power assets represent the fastest climber with a 15.0% CAGR. Wind operators deploy trailer-mounted cameras near nacelles to track blade damage, while utilities scan substation insulators for partial discharges. Semiconductor fabs add cleanroom cameras because contact microphones risk contamination. Over the forecast horizon, distributed renewables and aging grids are projected to lift energy orders past automotive R and D spend in several national markets.

Note: Segment shares of all individual segments available upon report purchase
Geography Analysis
Europe held 31% of the acoustic camera market in 2024, anchored by stringent environmental regulations and a sophisticated automotive supply chain. German OEMs run full-vehicle NVH programs that cascade camera data into digital twins, while French municipalities engage multi-year urban noise-camera pilots to secure 30% transport noise cuts by 2030. Funding instruments from Horizon Europe accelerate academic-industry consortia that refine 3-D beamforming software.
APAC is set for a 14.3% CAGR. China legislated acoustic vehicle alerting systems under GB/T 37153-2018, pushing tier-one suppliers to validate loudspeaker signatures with imaging tools. Smart-city programs in Shenzhen and Singapore embed permanent acoustic mapping nodes at intersections. Japanese electronics plants, known for Six Sigma quality, fit cameras over pick-and-place lines to catch vacuum-leak hiss, driving consistent regional orders. India’s expanding metro-rail footprint is specifying acoustic leak detection on compressed-air braking systems.
North America retains an influential role as aerospace primes comply with FAA noise certification and as OSHA broadens exposure guidelines. Industrial end users integrate acoustic cameras with vibration, thermal, and power-quality sensors in unified dashboards. Oil and gas producers in the Gulf Coast mount cameras on robotic crawlers for storage tank inspections, mitigating confined-space entry risks.
South America and the Middle East and Africa form nascent but promising territories. Mining operators in Chile test portable imagers to pinpoint vent fan resonance, while Gulf utilities trial cameras for desert power-line inspections where visual drones struggle with glare and sand. Uptake here is expected to trail advanced regions by two to three years yet remains additive to global volumes.

Competitive Landscape
The acoustic camera market exhibits moderate fragmentation. Hottinger Brüel and Kjær aligns acoustic cameras with vibration analysers and data recorders, leveraging a broad installed base. Teledyne FLIR cross-sells thermal plus acoustic imaging kits for factory maintenance. Fluke focuses on handheld tools, using channel partners that already sell electrical test meters. Specialist firms such as Sorama, Microflown Technologies, and gfai tech compete effectively through proprietary array geometries and cloud analytics.
Strategic moves in 2024 and 2025 reinforce software emphasis. Sorama rolled out a web-portal that lets non-experts upload recordings and receive annotated maps within minutes. Microflown expanded defense offerings with counter-UAS packages that layer acoustic localization atop radar. Intellectual-property clusters around delay-and-sum patents persist, yet vendors are exploring minimum-variance or neural beamformers to circumvent royalties. Opportunities remain in ruggedized IP67 designs, integrated tri-sensor payloads, and subscription models that bundle analytics with hardware leases.
Platform vendors are embedding edge-AI chips to shrink power draws below 10 W, enabling long-duration battery or solar operation. Suppliers that expose RESTful APIs gain traction as integrators fold acoustic layers into Industry 4.0 dashboards. Price competition is most intense below USD 10,000, where small factories weigh cameras against compressed-air energy losses. [4]Spectris plc, “2024 Full-Year Results,” spectris.com
Acoustic Camera Industry Leaders
-
Hottinger Brüel & Kjær Sound & Vibration Measurement A/S
-
gfai tech GmbH
-
Teledyne FLIR LLC
-
Fluke Corporation
-
SM Instruments Inc.
- *Disclaimer: Major Players sorted in no particular order

Recent Industry Developments
- June 2025: HEC Compuse Enterprise completed a USD 150 million takeover of Poyun, securing upstream MEMS microphone capacity for industrial and automotive acoustic sensors.
- June 2025: NTT Corporation unveiled a high-definition sound-wave visualization platform that merges high-speed cameras with AI-enhanced optical imaging.
- September 2025: Syntiant Corporation acquired Knowles Corporation’s Consumer MEMS Microphones business for USD 150 million, marrying ultra-low-power neural processors with high-performance transducers.
- July 2024: Siemens debuted “Sound of Science” digital-twin acoustics at the Salzburg Festival’s Großes Festspielhaus, showing future calibration synergies for acoustic cameras.
Global Acoustic Camera Market Report Scope
An acoustic camera is an imaging device that is used to locate sound sources and characterize these sound sources. The acoustic camera consists of a group of microphones, also called a microphone array, that is simultaneously acquired to represent the sound sources' location.
The scope of the study focuses on a global market analysis of acoustics camera products. Market sizing encompasses the revenue generated through acoustics camera products across the globe sold by various market players. The study also tracks the key market parameters, underlying growth influencers, and major vendors operating in the industry, which supports the market estimations and growth rates over the forecast period. The study further analyzes the overall impact of Covid-19 on the ecosystem. The report's scope encompasses market sizing and forecast for segmentation by array type, end-user industry, and geography.
| By Array Type | 2-D Arrays | ||
| 3-D Arrays | |||
| By Measurement Type | Near-Field | ||
| Far-Field | |||
| By Application | Noise Source Identification | ||
| Leak Detection | |||
| Mechanical Fault Diagnostics | |||
| Others (Bio-acoustics, RandD) | |||
| By End-user Industry | Automotive and Mobility | ||
| Aerospace and Defense | |||
| Electronics and Semiconductor | |||
| Energy and Power | |||
| Other Industries | |||
| By Geography | North America | United States | |
| Canada | |||
| Europe | Germany | ||
| United Kingdom | |||
| France | |||
| Rest of Europe | |||
| Asia-Pacific | China | ||
| Japan | |||
| India | |||
| Rest of Asia-Pacific | |||
| Middle East and Africa | United Arab Emirates | ||
| Saudi Arabia | |||
| South Africa | |||
| Rest of Middle East and Africa | |||
| South America | Brazil | ||
| Argentina | |||
| Rest of South America | |||
| 2-D Arrays |
| 3-D Arrays |
| Near-Field |
| Far-Field |
| Noise Source Identification |
| Leak Detection |
| Mechanical Fault Diagnostics |
| Others (Bio-acoustics, RandD) |
| Automotive and Mobility |
| Aerospace and Defense |
| Electronics and Semiconductor |
| Energy and Power |
| Other Industries |
| North America | United States |
| Canada | |
| Europe | Germany |
| United Kingdom | |
| France | |
| Rest of Europe | |
| Asia-Pacific | China |
| Japan | |
| India | |
| Rest of Asia-Pacific | |
| Middle East and Africa | United Arab Emirates |
| Saudi Arabia | |
| South Africa | |
| Rest of Middle East and Africa | |
| South America | Brazil |
| Argentina | |
| Rest of South America |
Key Questions Answered in the Report
What is the current size of the acoustic camera market?
The acoustic camera market was worth USD 160.41 billion in 2025 and is projected to reach USD 189.22 billion by 2030.
Which region is projected to grow fastest?
Asia Pacific is forecast to record a 14.3% CAGR through 2030, driven by expanding manufacturing hubs and smart-city programs.
Why are 3-D acoustic arrays gaining popularity?
3-D arrays offer higher spatial resolution required for aerospace cabin mapping and complex machinery enclosures and are growing at a 16.2% CAGR.
How are acoustic cameras used in predictive maintenance?
Mechanical fault diagnostics uses beamforming to detect early anomalies such as wind-turbine blade damage, enabling maintenance savings of up to 30%.
Which end-user industry shows the highest growth rate?
The energy and power sector leads with a 15.0% CAGR due to wind-farm monitoring and transmission-line inspections.
What technological trend is most influencing product design?
Edge-AI processors allowing real-time analysis on the device are reducing bandwidth needs and expanding deployment in remote or mobile settings.
Page last updated on: July 6, 2025

