3D Rendering Market Size and Share
Market Overview
| Study Period | 2020 - 2031 |
|---|---|
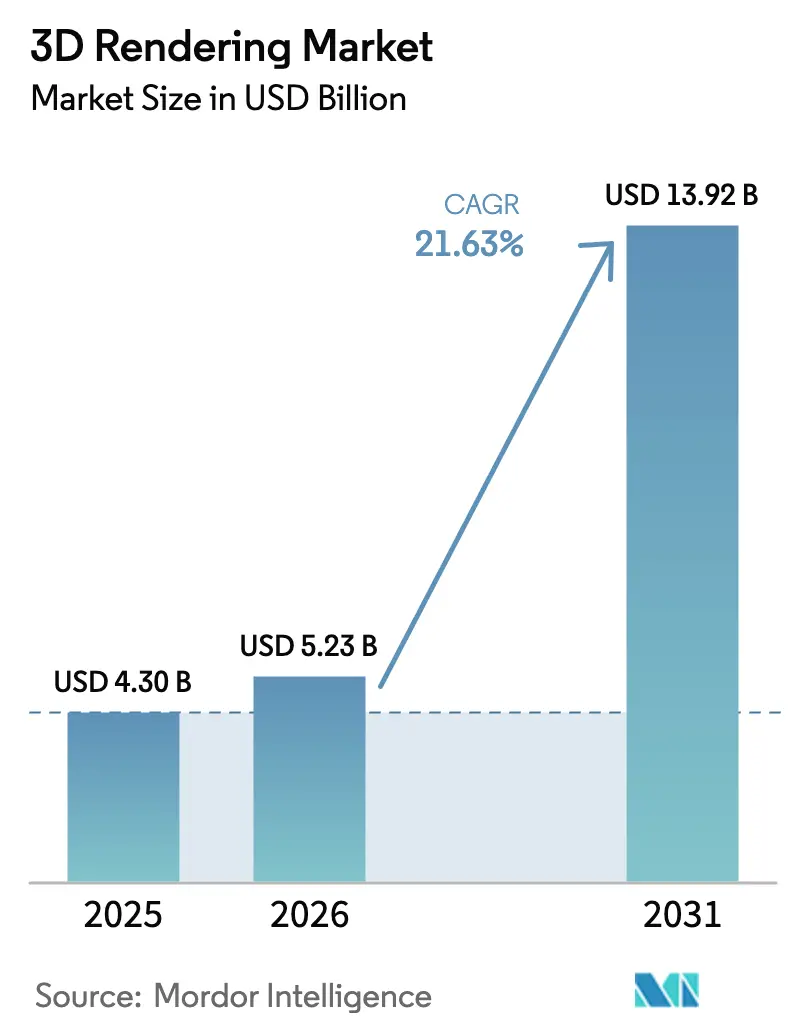
| Market Size (2026) | USD 5.23 Billion |
| Market Size (2031) | USD 13.92 Billion |
| Growth Rate (2026 - 2031) | 21.63% CAGR |
| Fastest Growing Market | North America |
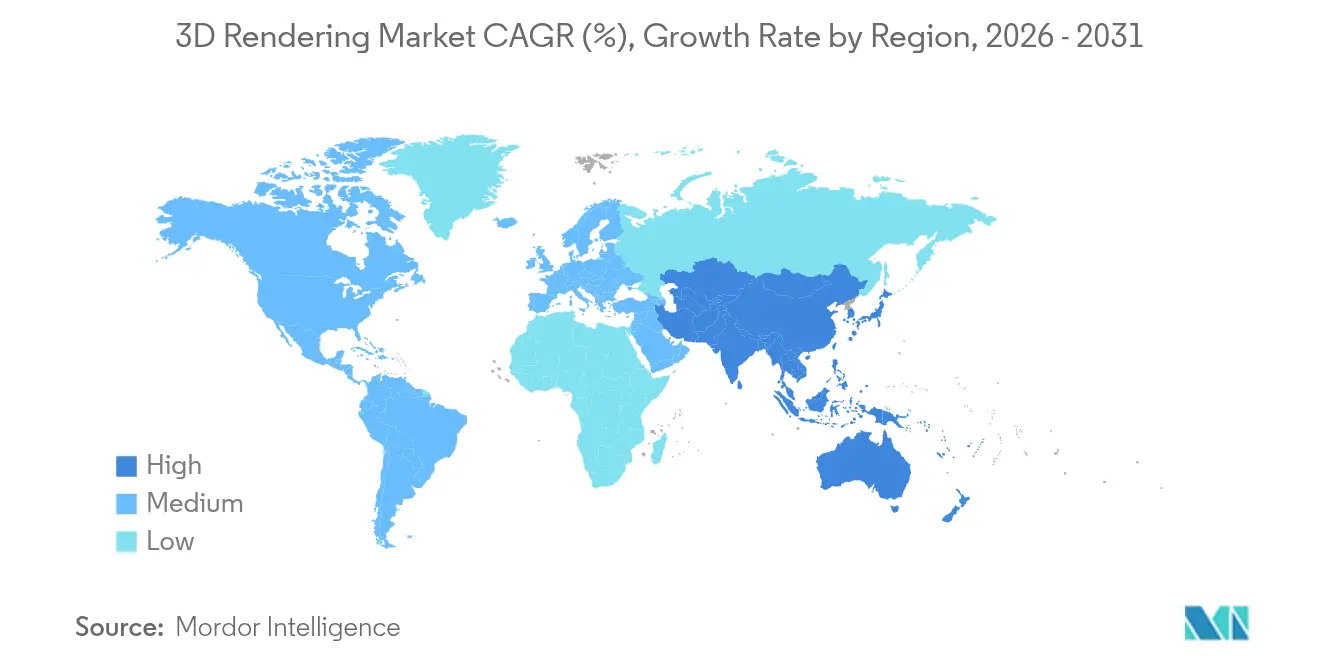
| Largest Market | Asia Pacific |
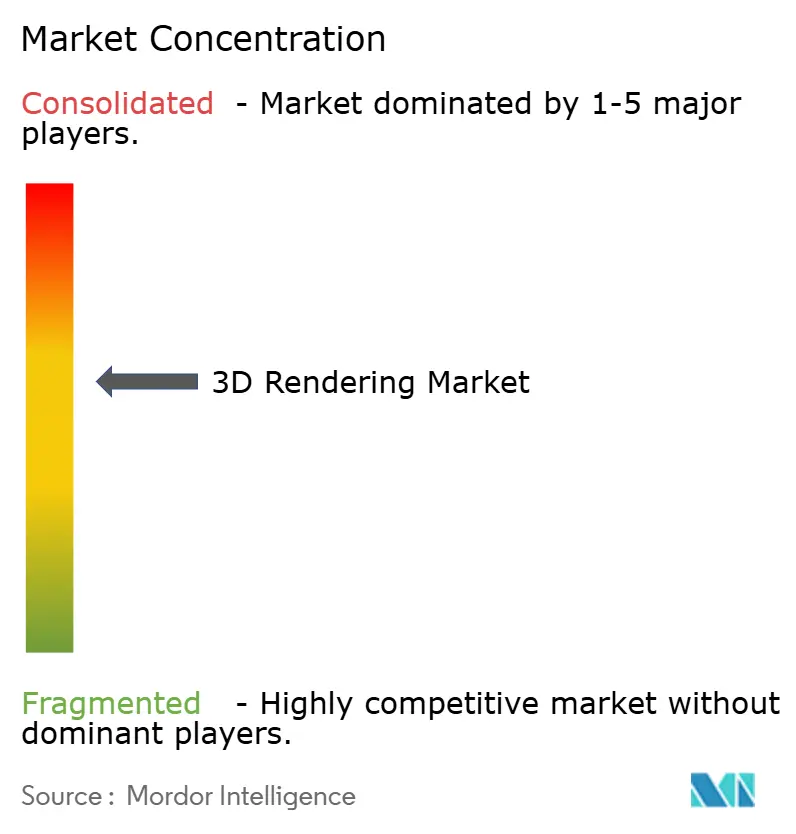
| Market Concentration | Medium |
Major Players *Disclaimer: Major Players sorted in no particular order Image © Mordor Intelligence. Reuse requires attribution under CC BY 4.0. | |
3D Rendering Market Analysis by Mordor Intelligence
The 3D rendering market size is expected to grow from USD 4.30 billion in 2025 to USD 5.23 billion in 2026 and is forecast to reach USD 13.92 billion by 2031 at 21.63% CAGR over 2026-2031. Enterprises are broadening photorealistic visualization from a creative option to an operational staple, particularly across manufacturing, construction, and retail. Real-time ray tracing, cloud render farms, and growing OpenUSD interoperability shrink production bottlenecks and deepen cross-team collaboration. Hardware advances such as NVIDIA’s current GPU architectures raise energy efficiency more than 20-fold versus CPU pipelines, letting firms scale visualization without equal cost escalation. Cloud GPU prices have also fallen sharply, so smaller studios can match larger rivals, while AI-driven denoising brings near-instant feedback to design iterations. As enterprises pursue digital twins and immersive commerce, demand for high-quality, fast-turnaround renders continues to widen, creating multi-year tailwinds for the 3D rendering market.
Key Report Takeaways
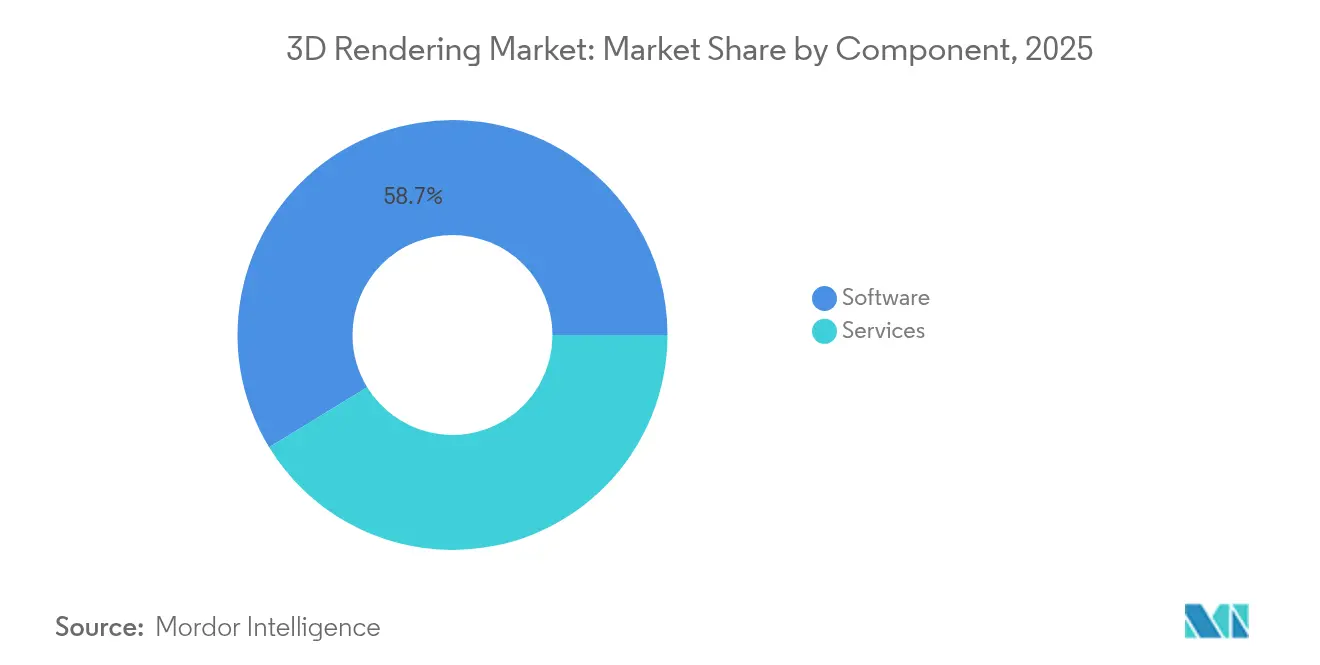
- By component, software retained 58.74% of 3D rendering market share in 2025, whereas services are on track for a 25.35% CAGR through 2031.
- By application, architectural visualization led with 41.90% share, but AR/VR and metaverse workflows are the fastest-growing, expanding at 28.10% CAGR.
- By operating system, Windows accounted for 73.85% share in 2025, yet browser-based/WebGL solutions are rising at a 27.55% CAGR to 2031.
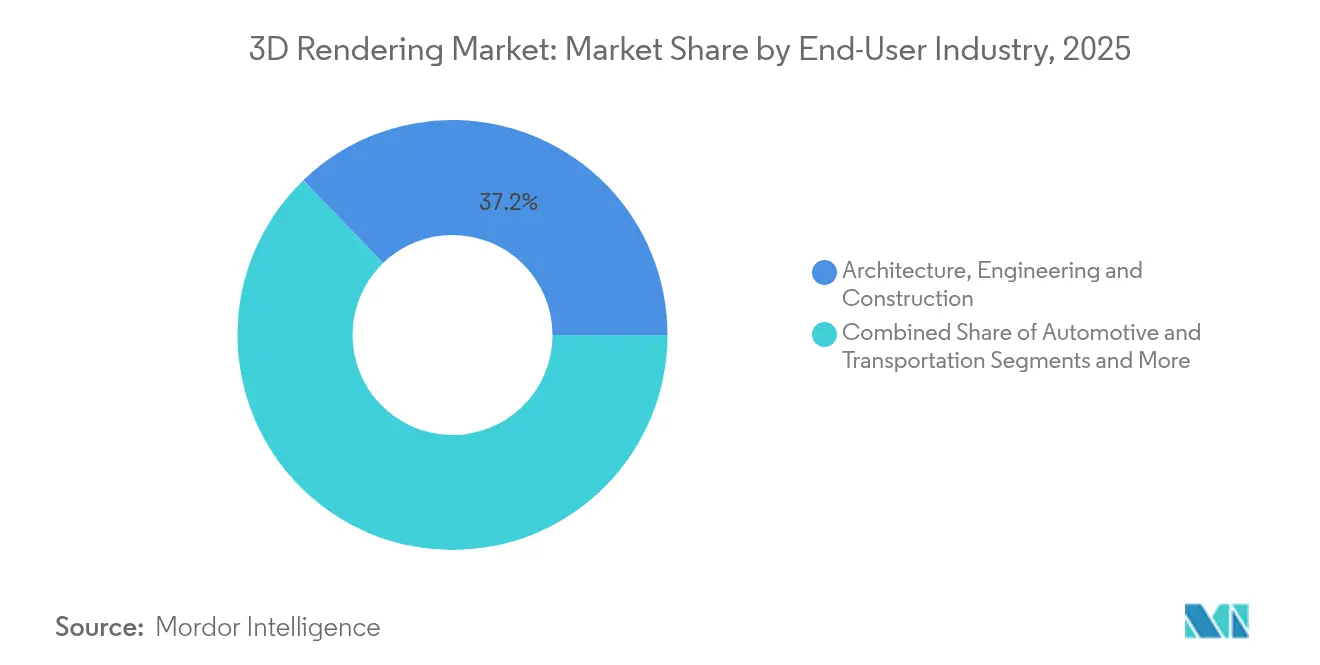
- By end-use industry, the AEC segment captured 37.20% of the 3D rendering market size in 2025; gaming shows the strongest momentum with a 23.95% CAGR.
- By geography, North America held 43.05% of overall revenue in 2025; APAC is projected to grow the fastest, logging a 29.10% CAGR to 2031.
Note: Market size and forecast figures in this report are generated using Mordor Intelligence’s proprietary estimation framework, updated with the latest available data and insights as of 2026.
Global 3D Rendering Market Trends and Insights
Drivers Impact Analysis*
| Driver | (~) % Impact on CAGR Forecast | Geographic Relevance | Impact Timeline |
|---|---|---|---|
| Photorealistic marketing visuals demand | +3.2% | North America, Europe | Short term (≤ 2 years) |
| BIM-centric AEC adoption surge | +4.1% | North America, APAC | Medium term (2-4 years) |
| Real-time GPU rendering breakthroughs | +5.8% | North America, Europe | Medium term (2-4 years) |
| Cloud render-farm cost efficiencies | +2.9% | Global | Short term (≤ 2 years) |
| OpenUSD interoperability momentum | +3.5% | Technology hubs worldwide | Long term (≥ 4 years) |
| E-commerce 3D product configurators | +2.7% | North America, Europe | Short term (≤ 2 years) |
| Source: Mordor Intelligence | |||
Real-time GPU rendering breakthroughs
NVIDIA’s Ada-generation GPUs deliver more than 20× energy efficiency relative to CPU renderers, trimming operating cost and carbon footprint for visualization teams.[1]NVIDIA Corporation, “NVIDIA Ada Lovelace Architecture,” nvidia.com Designers now adjust lighting, materials, and camera angles with frame-accurate feedback, eliminating the render-wait-review cycle that once stalled creative iteration. Falling cloud GPU prices—Thunder Compute quotes USD 0.66 per A100 hour versus USD 4.10 on tier-one clouds—extend real-time capability to budget-constrained studios. AI-powered denoisers further lift image fidelity by suppressing path-tracing noise with minimal compute overhead. Together, these shifts expand the 3D rendering market by letting even small firms deliver AAA-grade visuals on tight schedules.
BIM-centric AEC adoption surge
Government mandates in Singapore, the UK, and others require BIM on public projects, raising demand for integrated rendering that visualizes building data before ground is broken. Linking BIM models to real-time engines enables virtual walkthroughs, clash detection, and sequencing analysis, reducing rework and material waste. Siemens pairs Tecnomatix with GPU rendering so plant engineers preview assembly flows and cut ramp-up lead times.[2]Siemens AG, “Tecnomatix Digital Factory Case Studies,” siemens.comCloud collaboration lets architects in different cities co-edit the same model, while AI analytics suggest energy-efficiency tweaks, turning visualization into an operational planning tool that lifts the overall 3D rendering market.
OpenUSD interoperability momentum
The Alliance for OpenUSD released version 24.03 with stronger cross-platform consistency, easing asset interchange among Adobe, Apple, Autodesk, and NVIDIA toolchains . BMW uses USD-based workflows inside NVIDIA Omniverse to create a live digital twin of its electric vehicle factory, cutting production layout planning costs by up to 30%. USD’s layer system permits multiple artists to modify the same scene non-destructively, collapsing revision cycles that once spanned days. As enterprises adopt USD pipelines, vendor lock-in risk falls and collaborative efficiency rises, adding long-tail growth to the 3D rendering market.
E-commerce 3D product configurators
Furniture brands that embed interactive 3D product views report conversion uplifts reaching 94%, while return rates decrease once shoppers visualize scale and finish in-context.[3]Threekit Inc., “Retail 3D Configurator Benchmark 2025,” threekit.com IKEA and Crate and Barrel deploy AR overlays so buyers place virtual models in their homes on a smartphone, merging retail and visualization. Configurator platforms auto-generate marketing images, slashing photo-shoot budgets and speeding catalog refreshes. AI recommendation engines upsell complementary items, lifting average order value. These use cases expand the 3D rendering market beyond creative departments into core commerce operations.
Restraints Impact Analysis*
| Restraint | % Impact on CAGR Forecast | Geographic Relevance | Impact Timeline |
|---|---|---|---|
| Licensing costs and software piracy | -2.8% | Emerging markets | Medium term (2-4 years) |
| Shortage of skilled 3D artists | -3.4% | North America, Europe | Long term (≥ 4 years) |
| Cloud egress-fee inflation | -1.9% | Global | Short term (≤ 2 years) |
| GPU energy-use sustainability scrutiny | -1.5% | Europe, North America | Long term (≥ 4 years) |
| Source: Mordor Intelligence | |||
Shortage of skilled 3D artists
Job postings that cite real-time 3D grew 601% faster than the overall market, yet VFX studios cut 10–15% of headcount in 2024 because mid-level talent remains scarce. Senior artists versed in USD workflows command premium rates, squeezing budgets of small agencies entering the 3D rendering market. Universities lag: curricula emphasize legacy tools over cloud and AI-assisted pipelines, so graduate supply trails corporate demand. Fast-track bootcamps shorten the gap but cannot reverse the longer-term talent deficit that tempers market growth.
Licensing costs and software piracy
Autodesk Maya’s USD 1,875 annual price tags many freelancers; some resort to cracked copies, especially in lower-income regions. Piracy erodes vendor revenue needed for Rand D and support, while users face security risks and compatibility gaps. Vendors offer tiered cloud pricing and educational discounts, yet IP enforcement remains inconsistent. Until legal alternatives reach parity with user budgets, software piracy will shave points off the otherwise high-growth trajectory of the 3D rendering market.
*Our forecasts treat driver/restraint impacts as directional, not additive. The impact forecasts reflect baseline growth, mix effects, and variable interactions.
Segment Analysis
By Component: Services Scale Amid Software Leadership
Software commanded 58.74% of revenue in 2025, confirming enterprise preference for in-house tool ownership. SaaS deployments now offset capex, yet regulated verticals still buy perpetual licenses for secure on-premise clusters. Services, though starting smaller, are climbing at 25.35% CAGR as clients outsource burst workloads to render-farm specialists. Managed rendering vendors leverage bulk GPU contracts, offering hourly rates that undercut self-hosted rigs while providing elastic capacity during peak campaign periods. Visualization consulting is the fastest sub-category because firms need expertise to migrate toward USD pipelines and AI-driven asset creation. Growing project complexity and skill shortages ensure services stay the chief expansion lever for the 3D rendering market.
The services boom also reinforces hardware demand. Providers partition clusters into multi-tenant slices so hundreds of customers share compute without large up-front commitments.


By Application: AR/VR Closes Gap with Architectural Visualization
Architectural visualization still delivers 41.90% of 2025 revenue, underpinned by global infrastructure projects and mandated BIM usage. Photoreal fly-throughs and digital twin site inspections make 3D renders a core bid requirement, anchoring steady spend in the 3D rendering market. Yet AR/VR and metaverse experiences race forward at 28.10% CAGR as remote-work practices normalize virtual collaboration and immersive training. Enterprise VR onboarding from automotive and energy clients drives fresh budget lines toward real-time rendering engines, narrowing the gap with traditional AEC revenue.
This convergence fuels cross-application toolchains. Architects use VR headsets to present floor-plan changes, marketing teams repurpose the same asset for product launches, and game-engine providers supply cinematic post-processing to both. As boundaries blur, AR/VR’s high CAGR will gradually reshape the application mix, raising its 3D rendering market share toward the end of the forecast window.
By Operating System: Browser Platforms Break Desktop Lock-In
Windows kept 73.85% share in 2025 thanks to entrenched IT standards and a vast ecosystem of plug-ins. Still, browser-based/WebGL solutions are outpacing every desktop OS, expanding at 27.55% CAGR as firms value zero-install tools for distributed teams. WebAssembly lets applications equal native speed, while GPU cloud back-ends remove local hardware constraints. That democratizes creation for users on macOS, Linux, and Chromebooks, broadening the 3D rendering market reach beyond traditional power users.
Enterprises pilot browser IDEs to shorten onboarding and ensure version parity across offices. Render previews share instantly via a URL, accelerating design cycles. As security frameworks mature, CIOs gain confidence to host proprietary assets in managed cloud sandboxes, chipping away at Windows dominance while inflating the overall 3D rendering market size devoted to SaaS workspaces.
By End-Use Industry: Gaming Runs Neck-and-Neck with AEC
AEC held 37.20% revenue in 2025, buoyed by infrastructure spending and sustainable-construction regulations that require simulation. Gaming, however, is the momentum leader, advancing at 23.95% CAGR. Unreal Engine and Unity now export turnkey cinematic renders, letting studios re-use real-time assets for trailers and influencer content—workflows once processed through offline VFX farms. Automotive OEMs employ game-engine digital twins for plant optimization, further blending industrial and entertainment use cases that enlarge the 3D rendering market.
E-commerce and healthcare also gather steam. Retailers adopt 3D configurators to cut return logistics costs, and surgical teams visualize anatomy before procedures, raising output accuracy. This diversification shields the 3D rendering market from cyclical softness in any single vertical.
By Rendering Technique: Real-time Path Tracing Surges
Hybrid rendering struck a 38.70% balance in 2025, combining raster speed with path-traced quality. Yet real-time path tracing is the breakout, running at 25.40% CAGR on next-generation GPUs with AI denoisers. Image fidelity that once required minutes per frame now streams live to a viewport, enabling creative approvals during meetings. Ray tracing remains pivotal for physically correct lighting in marketing and AEC, whereas rasterization persists where frame-rate prioritization is critical, such as large-scale collaborative VR sessions. As hardware costs fall, real-time path tracing is forecast to win share across segments, cementing its role in the expanding 3D rendering market.
Geography Analysis
North America generated 43.05% of global revenue in 2025, underpinned by its entertainment hubs, digital-twin pilots in automotive manufacturing, and strong venture funding. Public-sector defense and aerospace programs further validate near-real-time visualization, accelerating broader enterprise follow-on spending and cementing regional leadership within the 3D rendering market.
APAC is the fastest riser, projected at a 29.10% CAGR, as China’s gaming giants, India’s e-commerce push, and Japan’s Project PLATEAU expand urban 3D models across 250 cities. Government digitization grants subsidize software licenses and GPU clusters, while local device makers preload AR shopping apps, seeding new user bases for visualization content. These factors raise the APAC 3D rendering market size quickly through 2031.
Europe maintains steady growth via automotive visualization in Germany, energy-efficient rendering tech adoption under EU sustainability directives, and a burgeoning start-up scene in Paris and Helsinki focused on USD toolchains. Middle East and Africa capitalize on smart-city and mega-project investments, whereas South America taps gaming-community expansion. Although regional drivers differ, collective global demand sustains double-digit gains for the 3D rendering market.

Competitive Landscape
Competition remains fragmented yet intensely innovative. NVIDIA, Autodesk, and Adobe leverage scale to integrate AI and USD across hardware, CAD, and creative suites, capturing shared mindshare across buyer segments. Unity Technologies and Epic Games push real-time rendering into industrial decision-making, translating decades of gaming IP into digital twins that lift factory planning productivity. Chaos, Blender, and other specialist engines compete on feature cadence and price flexibility, preventing market concentration at the very top.
Partnerships substitute for outright Mand A. BMW works with NVIDIA Omniverse on factory twins; Siemens pairs with NVIDIA on industrial metaverse offerings; Capgemini bought Unity’s digital-twin consulting arm to speed enterprise adoption. Vendors prioritize OpenUSD compliance, cloud deployment choices, and AI-driven automation to differentiate. The seller mix and rapid standard shifts create a healthy but competitive 3D rendering market where no vendor can stagnate.
3D Rendering Industry Leaders
Adobe Inc.
Autodesk, Inc.
Dassault Systems
NVIDIA Corporation
Chaos Software Ltd.
- *Disclaimer: Major Players sorted in no particular order

Recent Industry Developments
- July 2025: Autodesk released 3ds Max 2026 with AI-driven real-time rendering that cuts scene times 40% and supports Unreal Engine 5.3 integration.
- June 2025: Epic Games unveiled Twinmotion 2025.2 featuring cloud rendering and multi-user collaboration for AEC clients.
- May 2025: NVIDIA posted record Q1 FY 2026 revenue of USD 44.1 billion; professional visualization reached USD 509 million, up 19% YoY.
- October 2024: Unity 6 launched, shifting more workloads from CPU to GPU and adding multiplayer authoring tools.


Global 3D Rendering Market Report Scope
3D rendering refers to the technique of producing a photorealistic two-dimensional image derived from three-dimensional models. It represents the concluding phase in the 3D visualization process, which encompasses the creation of object models, the application of textures to these models, and the incorporation of lighting within the scene.
The study tracks the revenue accrued through the sale of 3D rendering software and services by various players in the global market. The study also tracks the key market parameters, underlying growth influencers, and major vendors operating in the industry, which supports the market estimations and growth rates over the forecast period. It further analyses the aftereffects of COVID-19 and other macroeconomic factors on the market. The report’s scope encompasses market sizing and forecasts for the various market segments.
3D rendering market report is segmented by component (software and services), by application (product, design, & modeling, animation, visualization & simulation, and others), by operating system (windows, macOS, and linux), by end-use (automotive, architecture, engineering & construction, manufacturing, gaming, media & entertainment, and others), and by geography (North America, Europe, Asia-Pacific, Latin America, and Middle East and Africa). The market sizes and forecasts are provided in terms of value (USD) for all the above segments.
| Software | On-premise |
| Cloud / SaaS | |
| Rendering plug-ins | |
| Services | Visualization and Modeling |
| Animation and Walkthrough | |
| Consulting and Integration | |
| Managed Rendering (Render-farm) |
| Product Design and Modeling |
| Architectural Visualization |
| Animation and VFX |
| Simulation and Training |
| Marketing and Advertising |
| AR/VR and Metaverse |
| Windows |
| macOS |
| Linux |
| Browser-based / WebGL |
| Architecture, Engineering and Construction |
| Automotive and Transportation |
| Manufacturing and Industrial |
| Media and Entertainment |
| Gaming |
| Healthcare and Life Sciences |
| E-commerce and Retail |
| Others |
| Ray Tracing |
| Rasterization |
| Hybrid Rendering |
| Real-time Path Tracing |
| North America | United States | |
| Canada | ||
| Mexico | ||
| South America | Brazil | |
| Argentina | ||
| Rest of South America | ||
| Europe | United Kingdom | |
| Germany | ||
| France | ||
| Italy | ||
| Spain | ||
| Russia | ||
| Rest of Europe | ||
| Asia-Pacific | China | |
| Japan | ||
| India | ||
| South Korea | ||
| Australia and New Zealand | ||
| Rest of Asia-Pacific | ||
| Middle East and Africa | Middle East | Saudi Arabia |
| UAE | ||
| Turkey | ||
| Rest of Middle East | ||
| Africa | South Africa | |
| Nigeria | ||
| Kenya | ||
| Rest of Africa | ||
| By Component | Software | On-premise | |
| Cloud / SaaS | |||
| Rendering plug-ins | |||
| Services | Visualization and Modeling | ||
| Animation and Walkthrough | |||
| Consulting and Integration | |||
| Managed Rendering (Render-farm) | |||
| By Application | Product Design and Modeling | ||
| Architectural Visualization | |||
| Animation and VFX | |||
| Simulation and Training | |||
| Marketing and Advertising | |||
| AR/VR and Metaverse | |||
| By Operating System | Windows | ||
| macOS | |||
| Linux | |||
| Browser-based / WebGL | |||
| By End-Use Industry | Architecture, Engineering and Construction | ||
| Automotive and Transportation | |||
| Manufacturing and Industrial | |||
| Media and Entertainment | |||
| Gaming | |||
| Healthcare and Life Sciences | |||
| E-commerce and Retail | |||
| Others | |||
| By Rendering Technique | Ray Tracing | ||
| Rasterization | |||
| Hybrid Rendering | |||
| Real-time Path Tracing | |||
| By Geography | North America | United States | |
| Canada | |||
| Mexico | |||
| South America | Brazil | ||
| Argentina | |||
| Rest of South America | |||
| Europe | United Kingdom | ||
| Germany | |||
| France | |||
| Italy | |||
| Spain | |||
| Russia | |||
| Rest of Europe | |||
| Asia-Pacific | China | ||
| Japan | |||
| India | |||
| South Korea | |||
| Australia and New Zealand | |||
| Rest of Asia-Pacific | |||
| Middle East and Africa | Middle East | Saudi Arabia | |
| UAE | |||
| Turkey | |||
| Rest of Middle East | |||
| Africa | South Africa | ||
| Nigeria | |||
| Kenya | |||
| Rest of Africa | |||


Key Questions Answered in the Report
What is the current value of the 3D rendering market?
It is valued at USD 5.23 billion in 2026, with a forecast to reach USD 13.92 billion by 2031.
Which component segment is growing fastest?
Services, including managed render farms and visualization consulting, are rising at a 25.35% CAGR through 2031.
Why is APAC the fastest-growing region?
Government digitization projects, expanding gaming ecosystems, and manufacturing investment push APAC growth to a projected 29.10% CAGR.
How does OpenUSD benefit enterprises?
It standardizes scene data exchange, reducing asset conversion time and enabling collaborative editing across different software tools.
Page last updated on:


