
3D Printing Gases Market Size and Share
Market Overview
| Study Period | 2021 - 2031 |
|---|---|
| Market Size (2026) | USD 73.71 Billion |
| Market Size (2031) | USD 110.17 Billion |
| Growth Rate (2026 - 2031) | 8.37 % |
| Fastest Growing Market | Asia-Pacific |
| Largest Market | Asia-Pacific |
| Market Concentration | Medium |
Major Players *Disclaimer: Major Players sorted in no particular order Image © Mordor Intelligence. Reuse requires attribution under CC BY 4.0. | |
3D Printing Gases Market Analysis by Mordor Intelligence
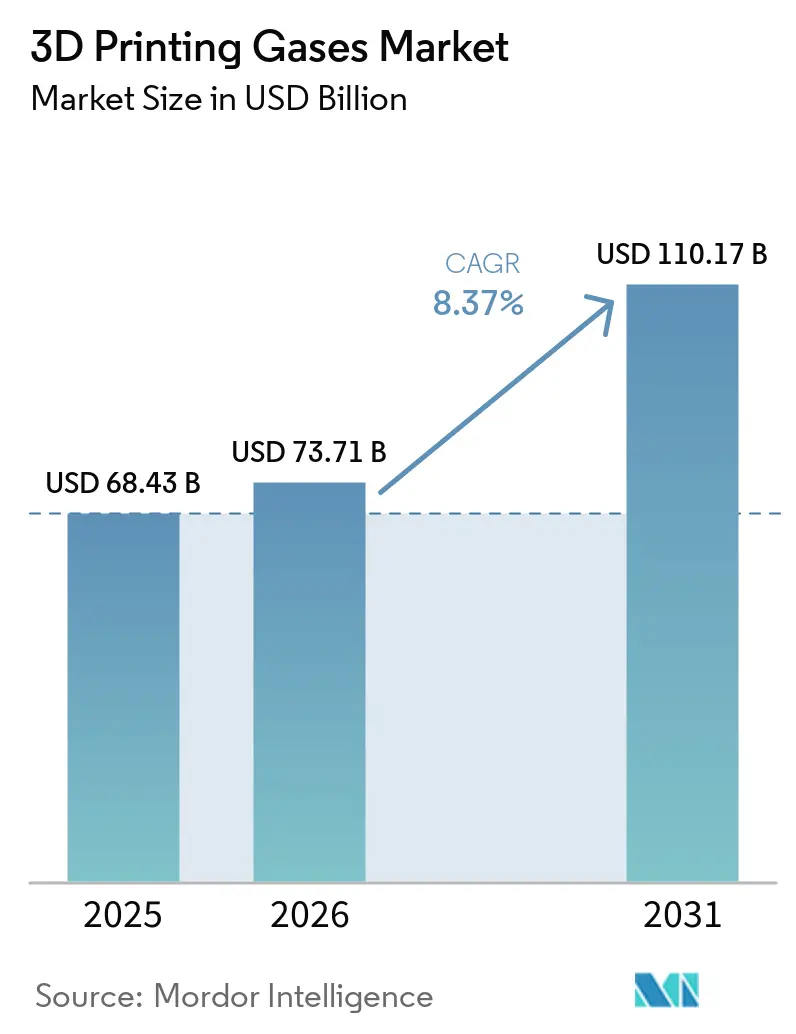
The 3D printing gases market size was valued at USD 68.43 billion in 2025 and is estimated to grow from USD 73.71 billion in 2026 to reach USD 110.17 billion by 2031, at a CAGR of 8.37% during the forecast period (2026-2031). The 3D printing gases market is expanding as metal additive manufacturing shifts from prototyping to qualified production, requiring controlled atmospheres during printing and post-processing. High-purity argon and nitrogen are used in powder atomization, build chamber purging, powder handling, and thermal treatment, thereby making gas suppliers more closely involved in production workflows. Aerospace and medical manufacturers place greater importance on documented atmosphere control, as qualification and regulatory processes increasingly require traceability and process consistency. This favors suppliers that can offer dependable gas production, distribution, monitoring, and technical support through long-term contracts. Helium supply constraints and the capital required for high-purity infrastructure remain significant limitations, particularly for smaller manufacturers and regions with less-developed bulk gas networks.
Key Report Takeaways
- By gas, argon held 45.35% of the 3D printing gases market share in 2025, while nitrogen is forecast to grow at a CAGR of 9.14% through 2031.
- By function, insulation accounted for 42.83% of the 3D printing gases market share in 2025, while cooling is forecast to grow at a CAGR of 9.45% through 2031.
- By technology, laser sintering accounted for 39.41% of the 3D printing gases market in 2025, while binder jetting is forecast to expand at a 9.33% CAGR through 2031.
- By end-user industry, healthcare accounted for 28.17% of the 3D printing gases market size in 2025 and is expected to grow at a CAGR of 9.82% through 2031.
- By geography, Asia-Pacific accounted for 55.62% of the market value in 2025 and is forecast to grow at a CAGR of 9.51% through 2031.
Note: Market size and forecast figures in this report are generated using Mordor Intelligence’s proprietary estimation framework, updated with the latest available data and insights as of January 2026.
Global 3D Printing Gases Market Trends and Insights
Drivers Impact Analysis*
| Drivers | (~) % Impact on CAGR Forecast | Geographic Relevance | Impact Timeline |
|---|---|---|---|
| Industrialization of Metal Additive Manufacturing | +2.3% | Global, with concentration in China, Germany, and the United States | Long term (≥ 4 years) |
| Aerospace Qualification and Lightweighting Requirements | +1.4% | North America, Europe, APAC, including Japan and South Korea | Medium term (2-4 years) |
| Expansion of Powder Atomization and Feedstock Production | +1.2% | Global, with early production gains in the United States, China, and Sweden | Long term (≥ 4 years) |
| Rising Demand for Patient-Specific Medical Components | +1.0% | North America, Europe, APAC core, with spillover to the Middle East and Africa (MEA) | Medium term (2-4 years) |
| Real-Time Atmospheric Monitoring and Gas-Recovery Systems | +0.7% | Global, concentrated in high-precision manufacturing hubs | Short term (≤ 2 years) |
| Source: Mordor Intelligence | |||
Industrialization of Metal Additive Manufacturing
The 3D printing gases market benefits as metal additive manufacturing transitions from low-volume prototyping to certified serial production. Production facilities require a continuous supply of argon and nitrogen, often under long-term contracts rather than project-based cylinder purchases. Gas demand extends beyond the build chamber to powder handling, chamber cycling, thermal processing, and recovery systems. These requirements can multiply gas use by 3× to 5× relative to build chamber capacity alone. Multi-laser powder bed fusion platforms contribute to this demand, as larger machines require stable, uniform gas flow across wider build areas. The expansion from single- and dual-laser systems to 12-laser systems, with larger configurations under development, also increases the value of real-time atmospheric monitoring and gas-recovery equipment.
Aerospace Qualification and Lightweighting Requirements
Aerospace qualification requirements create a sustained need for high-specification gases in the 3D printing gases market. NADCAP expanded its additive manufacturing framework in 2025 through revised criteria for metallic powder bed fusion (AC7131/1) and directed energy deposition (AC7131/2). These requirements cover gas management, powder purchasing, and personnel qualification, making atmospheric control an auditable part of aerospace production. Suppliers producing reactive alloy parts must demonstrate disciplined gas handling before programs move into serial production. This can make it difficult to change argon specifications, even when alternative gases offer lower unit costs. More than 100 powder bed fusion audits were completed under the framework by mid-2026, with accredited suppliers across North America, Europe, Taiwan, Saudi Arabia, and India.
Expansion of Powder Atomization and Feedstock Production
Powder atomization is a major source of gas consumption in the 3D printing gases market, as argon and nitrogen are used at high pressure to produce metal feedstock. NADCAP began trial audits for powder production in 2025 at Carpenter, Höganäs, Tekna, and AP&C (Advanced Powders & Coatings), increasing the importance of documented gas control in this part of the supply chain. A 2026 study on K340 tool steel found that nitrogen atomization improved flowability and produced finer solidification structures compared with argon atomization. The study reported a Hall flow time as low as 14.2 seconds and a higher apparent density for nitrogen-atomized powder. Amaero executed binding contracts in December 2025 for an argon recycling plant designed to reduce argon cost per kilogram of powder by 80% and achieve a 2.0- to 2.5-year payback period. SSAB announced in June 2026 that it would expand its Oxelösund facility to reach 350 tons per year of additive manufacturing-grade steel powder by Q1 2028[1]SSAB, “SSAB Expands Steel Powder Production Capacity in Oxelösund,” SSAB, ssab.com.
Rising Demand for Patient-Specific Medical Components
Demand for patient-specific medical components supports the 3D printing gases market, as metal implants require tightly controlled production environments. The U.S. Food and Drug Administration Quality Management System Regulation became effective on February 2, 2026, and incorporated ISO 13485:2016 by reference. This change makes documented process control more important for medical device manufacturers using metal additive manufacturing. A 2026 clinical framework for custom-made medical devices identifies temperature, pressure, and gas-flow monitoring as process quality requirements during the build cycle. The combined U.S. and European regulatory environment raises expectations for controlled-atmosphere validation across medical supply chains. It also creates a stronger basis for suppliers that can provide gas purity records and process support to medical manufacturers.
Restraints Impact Analysis*
| Restraints | (~) % Impact on CAGR Forecast | Geographic Relevance | Impact Timeline |
|---|---|---|---|
| High Cost of High-Purity Gas Infrastructure | -1.2% | Global, more pronounced in South America and MEA, where bulk gas networks are underdeveloped | Long term (≥ 4 years) |
| Supply and Price Volatility of Helium and Specialty Gases | -0.9% | Global, acute in Northeast Asia and Europe, with Qatar-dependent supply chains | Short term (≤ 2 years) |
| Limited Process-Gas Expertise Among Smaller Manufacturers | -0.5% | APAC emerging markets, South America, and MEA | Medium term (2-4 years) |
| Source: Mordor Intelligence | |||
High Cost of High-Purity Gas Infrastructure
The cost of high-purity gas infrastructure limits smaller additive manufacturers' participation in the 3D printing gases market. Serial metal production requires cryogenic argon logistics, nitrogen pressure swing adsorption or membrane systems, leak-tight piping, and chambers capable of operating at oxygen levels below 100 parts per million (ppm). Manufacturers with fewer than 10 metal printers often depend on delivered argon cylinders, which cost more per unit than bulk supply or on-site generation. This cost structure limits their ability to enter long-term supply arrangements and reduces operating margins at higher production output. The constraint is most pronounced in South America and MEA, where bulk liquid argon logistics and high-pressure distribution networks are less developed. Limited process-gas expertise can compound the problem, as smaller firms may lack the personnel needed to specify, operate, and validate complex atmospheric systems.
Supply and Price Volatility of Helium and Specialty Gases
Supply and price volatility in helium restrain the 3D printing gases market, particularly for aerospace and research applications. Early in 2026, disruption at QatarEnergy's 77-million-ton-per-year Liquefied Natural Gas (LNG) facility removed 63 million cubic meters of annual helium production, representing one-third of global supply. Reuters reported that spot prices doubled within weeks, while sustained outages of 60 to 90 days could raise delivered prices by 25% to 50% for customers without long-term contracts. Helium accounts for a smaller share of gas consumption than argon and nitrogen, but it has distinctive process properties in laser powder bed fusion. A U.S. Department of Energy study found that helium can suppress keyhole porosity by reducing effective energy absorption, even though it has a limited direct cooling effect on the printed part. Replacing helium with argon can therefore require complete process revalidation under material specifications, extending the impact of supply disruptions.
*Our forecasts treat driver/restraint impacts as directional, not additive. The impact forecasts reflect baseline growth, mix effects, and variable interactions.
Segment Analysis
By Gas: Argon Maintains Its Lead While Nitrogen Gains Cost-Sensitive Uses
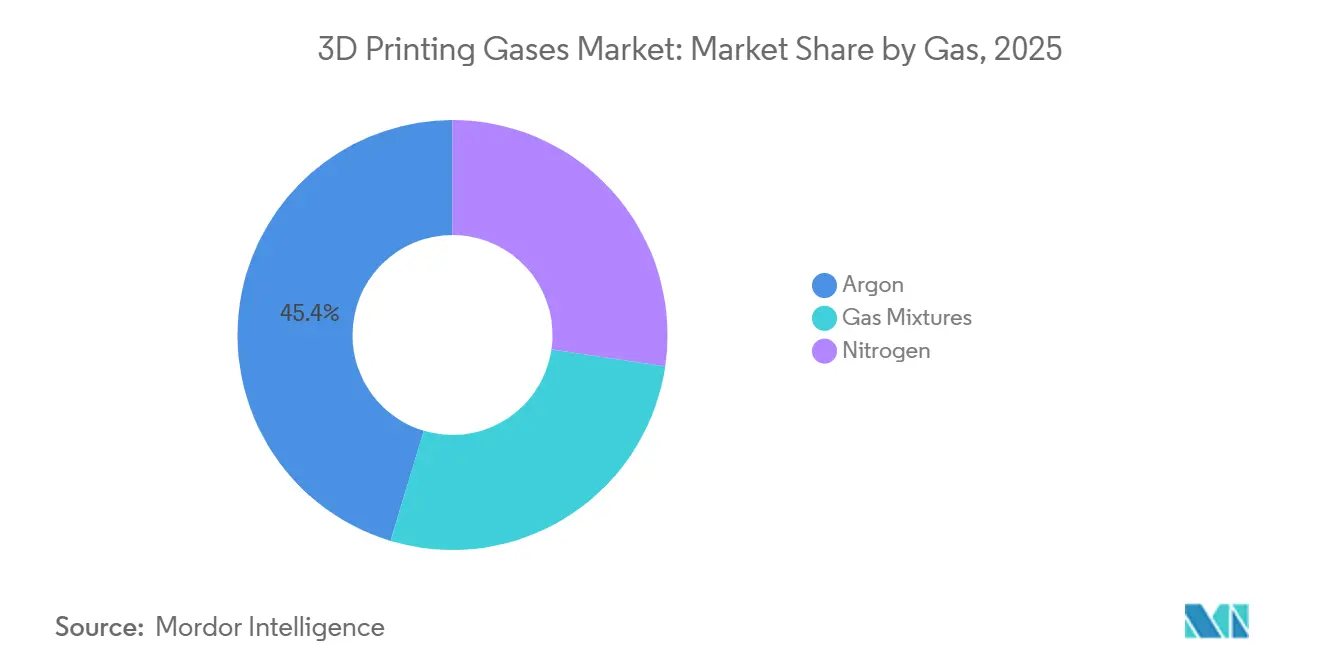
Argon held 45.35% of the 3D printing gases market in 2025. Its position reflects its use with titanium, nickel superalloys, and cobalt-chrome in powder bed fusion, where trace nitrogen can form inclusions that reduce fatigue performance. Aerospace programs commonly specify argon for reactive alloy builds under controlled quality systems. These requirements create a degree of specification continuity for argon, even where nitrogen costs 30% to 40% less per unit. Gas mixtures remain the smallest category, but they are gaining interest in wire-arc directed energy deposition. A 2025 study of Inconel 718 wire-arc additive manufacturing found that an R7 composition of 2% hydrogen with argon performed better than single-gas options for bead geometry and defect control.
Nitrogen is the fastest-growing gas type, with a projected CAGR of 9.14% through 2031. It is used where its lower inertness does not compromise material performance, including stainless steel, tool steel, and aluminum composite applications. The 3D printing gases market also uses nitrogen in powder atomization, where its properties can improve the economics of industrial feedstock production. Research on K340 tool steel found that nitrogen-atomized powder had 20% better flowability than argon-atomized powder and exhibited finer dendrite arm spacing. On-site nitrogen generation through pressure swing adsorption or membrane systems can lower the cost per Nm³ by 60% to 70% compared with delivered cylinder supply. Messer commissioned a facility in East China in August 2026 with 50,000 Nm³/h of high-purity nitrogen supply capacity for advanced manufacturing customers, illustrating the scale of supply being developed for compatible uses.



By Function: Insulation Remains Essential While Cooling Expands with Higher-Power Systems
Insulation held 42.83% of the market value in 2025, making it the leading function in the 3D printing gases market. The category includes build chamber purging, powder-bed blanketing, and atmosphere maintenance during printing. These steps are central to metal additive manufacturing because oxygen exposure can damage powder and part quality. Controlled nitrogen atmospheres also support surface oxidation control during binder jetting at ambient temperature. Illumination is the smallest function, covering nitrogen blanketing in UV-curing photopolymer applications such as stereolithography and PolyJet. The other category includes carrier-gas roles in directed energy deposition, wire feeds, and powder conveying.
Cooling is the fastest-growing function, with a projected CAGR of 9.45% through 2031. Multi-laser laser powder bed fusion systems and high-power directed energy deposition platforms create greater thermal loads during each build. Controlled nitrogen and argon flows help reduce residual stress, limit thermal distortion, and shorten inter-layer cycle times. Air Products identifies controlled cooling flows as important for dimensional accuracy in metallic builds because thermal gradients affect mechanical properties. Helium's high thermal conductivity does not necessarily translate into direct cooling of printed parts in laser powder bed fusion. A Department of Energy study instead points to reduced energy absorption and lower keyhole porosity, which supports a more targeted approach to gas-mixture selection.
By Technology: Laser Sintering Leads While Binder Jetting Broadens Gas Demand
Laser sintering accounted for 39.41% of the 3D printing gases market in 2025. Its lead reflects the installed base of laser powder bed fusion systems in aerospace and medical metal production. These systems often require purging to below 100 ppm oxygen before a build begins. They also need continuous argon recirculation through filtration to remove spatter and metal condensate. Post-build cooling can require dedicated atmosphere management, creating consistent demand for high-purity gas. Stereolithography and PolyJet use less gas because their main requirement is nitrogen blanketing during post-curing stages.
Binder jetting is projected to grow at a CAGR of 9.33% through 2031. The technology is used in automotive and industrial metal production, where throughput and unit economics can be attractive at volumes above several thousand parts. Gas use occurs at several stages, including nitrogen during printing, inert or reducing atmospheres during debinding at 300 to 500°C, and argon or hydrogen blends during sintering above 1,000°C. These controlled conditions support part densities above 99% in binder-jetted metals. Research on 17-4 PH stainless steel has documented the importance of oxygen content during the debinding process. Linde supports this production route with sintering-atmosphere solutions and process-consulting services for metal binder-jetting customers.
By End-User Industry: Healthcare Combines Scale with the Fastest Growth
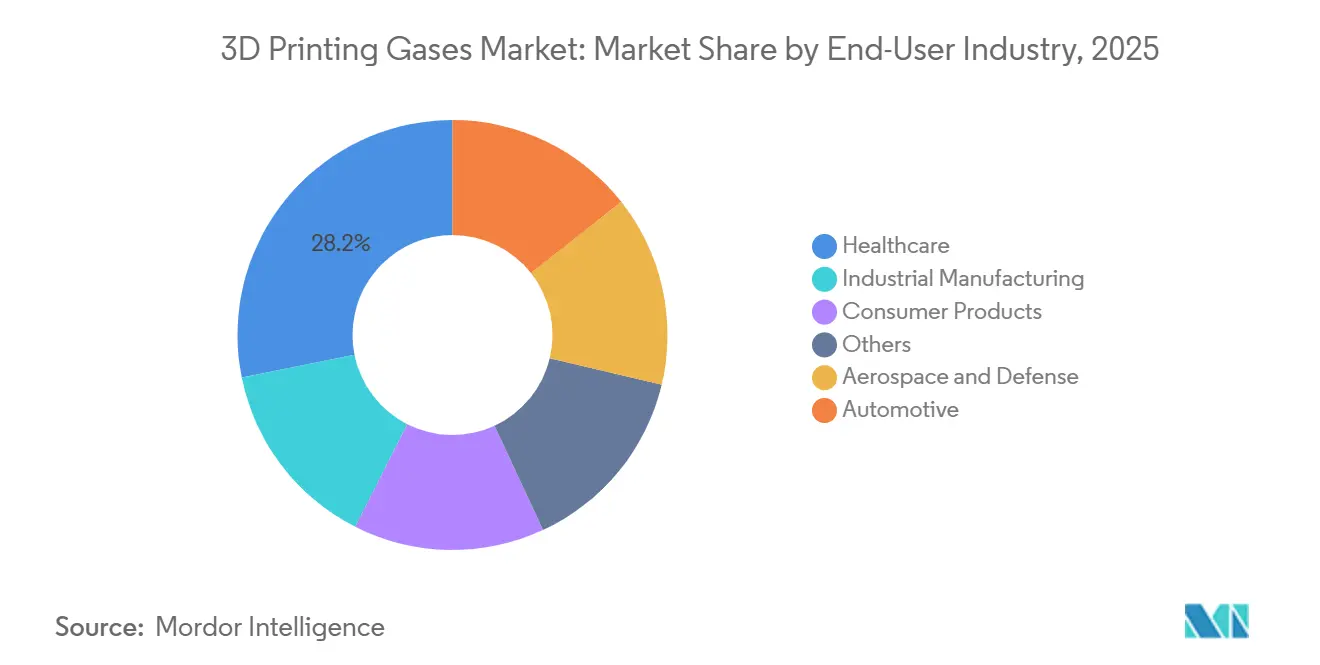
Healthcare accounted for 28.17% of the 3D printing gases market in 2025 and is projected to grow at a CAGR of 9.82% through 2031. Patient-specific implants require controlled metal additive manufacturing processes that support regulatory documentation. The FDA Quality Management System Regulation, effective February 2, 2026, incorporated ISO 13485:2016 by reference. This makes controlled atmosphere documentation part of the regulated quality trail for medical device manufacturing. A 2026 European framework for patient-specific PEEK cranial and facial implants described real-time gas-flow monitoring as a process-control checkpoint and reported a 3- to 5-day turnaround from image acquisition to sterile delivery.
Aerospace and defense are the second-largest end-user areas and have the highest specification intensity. Their argon requirements are often embedded in procurement specifications through NADCAP accreditation and related process controls. Automotive production is expanding through binder jetting and nitrogen-atmosphere laser sintering for compatible stainless steel structural parts. Industrial manufacturing uses substantial quantities of on-site nitrogen for tool steels, polymer composites, and multi-material structures. Consumer products remain the smallest defined end-user category, but desktop metal printing is creating distributed demand for bottled argon and nitrogen. This dispersed demand remains outside the large-scale contract structures used by the largest manufacturing sites.
Geography Analysis
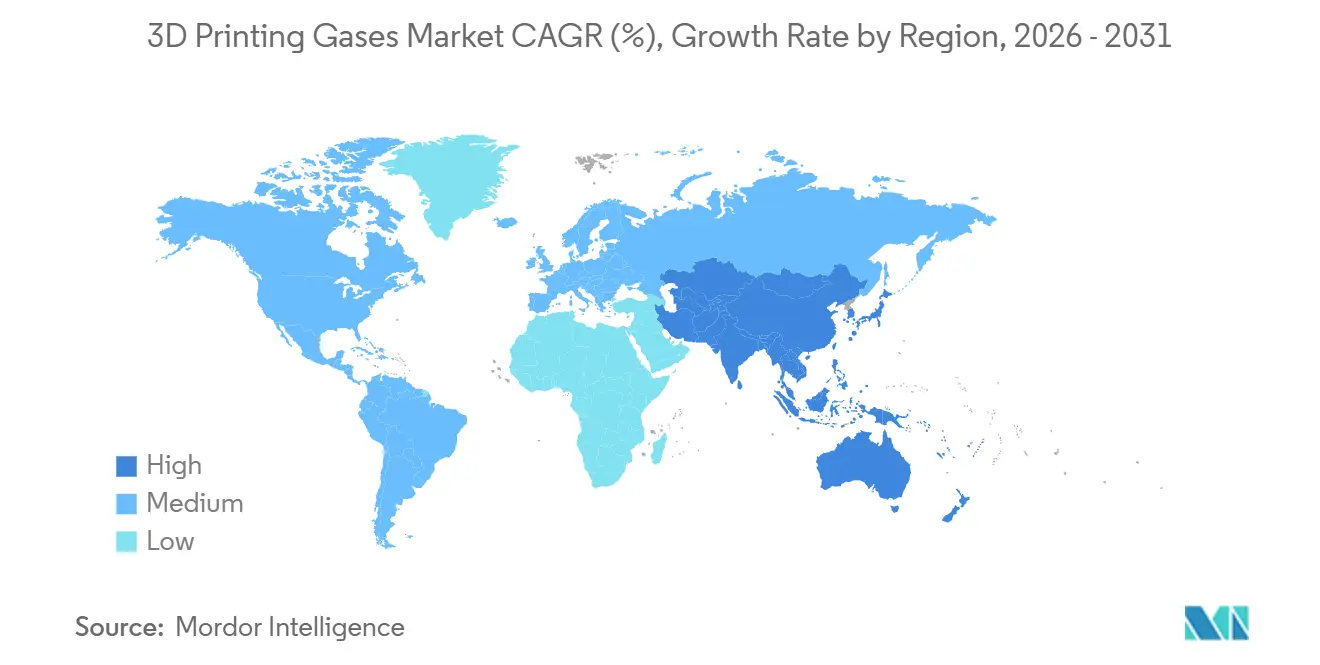
Asia-Pacific accounted for 55.62% of the 3D printing gases market in 2025 and is expected to record the highest regional CAGR of 9.51% through 2031. The region's position is driven by additive manufacturing activity in China, Japan, India, and other manufacturing centers. In August 2025, Japan's Taiyo Nippon Sanso was selected for a five-year New Energy and Industrial Technology Development Organization (NEDO) project combining sinter-based additive manufacturing and digital process design. The project runs from FY2024 through FY2028 and includes 3DPro gas solutions with Yamaha Motor, Mitsubishi Materials, and Kyushu University. In August 2026, Messer commissioned a 50,000 Nm³/h high-purity nitrogen facility in East China to serve customers in the electronics and advanced manufacturing sectors. These developments reflect a shift toward larger, longer-term gas supply arrangements across Northeast Asia and ASEAN manufacturing corridors[2]Nippon Sanso Holdings Corporation, “Research and Development of a Metal 3D Printer System Combining Sinter-Based Additive Manufacturing and Digital Process Design Adopted as a NEDO Project,” Nippon Sanso Holdings, nipponsanso.com.
North America is the second-largest regional market for 3D printing gases. A dense US aerospace and defense supply chain and a growing domestic powder production base support its position. In June 2026, Amaero commissioned its third Electrode Induction-melting Gas Atomization (EIGA) atomizer in Tennessee, expanding titanium alloy powder capacity to 480 tons per year. The company plans to commission an argon recycling plant in Q1 2027, designed to reduce the cost per kilogram of argon by 80%. Canada and Mexico are growing secondary locations as automotive and aerospace suppliers build additive manufacturing capacity near North American original equipment manufacturers. This is increasing regional demand for reliable supplies of argon and nitrogen, as well as specialized powder-processing support.
Europe remains a significant regional market, with Germany maintaining a large automotive and aerospace additive manufacturing base. Air Liquide supplies nitrogen, argon, and helium across the additive manufacturing workflow, including atomization, storage, build-chamber inerting, and post-processing. In June 2026, SSAB announced that its Oxelösund facility will reach 350 tons per year of additive manufacturing-grade steel powder in Q1 2028, adding a new demand point for upstream use of argon and nitrogen in Northern Europe. South America, the Middle East, and Africa (MEA) are smaller but developing markets for 3D printing gases. Brazil's industrial manufacturing base, GCC aerospace programs, and South Africa's medical device activity are generating demand, while underdeveloped bulk gas infrastructure continues to limit near-term adoption.

Competitive Landscape
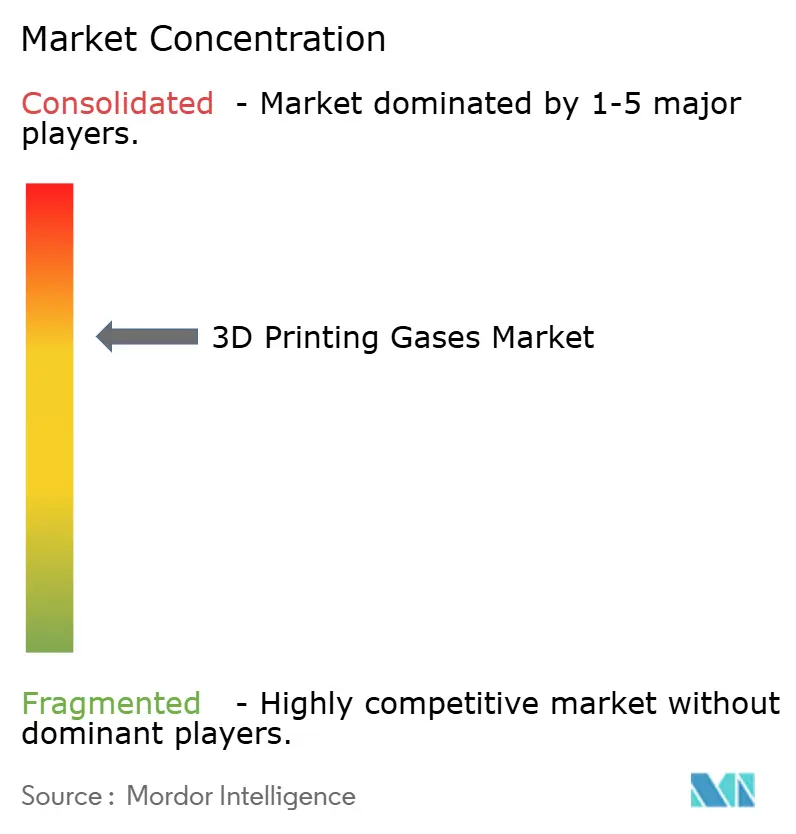
The 3D printing gases market is moderately concentrated, with Air Liquide, Linde PLC, Air Products, and Nippon Sanso Holdings serving much of the high-specification contract base. These suppliers compete on production capacity, distribution networks, application engineering, and purity documentation. Their offerings commonly include gas management system design, atmospheric monitoring support, and process consulting for original equipment manufacturer qualification. Aerospace and medical customers often favor multi-year service arrangements, as production stability takes priority over marginal changes in gas prices. A 2025 US patent describes a protective-gas additive manufacturing system that uses a mixer connected to inert and carbon dioxide sources and specifies a gas purity of at least 99.995%. This indicates that gas delivery architecture and traceability are becoming important elements of competitive positioning.
Gas recovery, recycling, and closed-loop atmosphere management are creating opportunities beyond conventional gas supply. Amaero's planned Q1 2027 argon recycling capability targets an 80% reduction in argon cost per kilogram of powder, providing a commercial reference point for powder producers seeking to manage gas consumption and operating costs. Cambridge Sensotec introduced a SIL 2-compliant oxygen analyzer for additive manufacturing safety systems in July 2025. Such monitoring systems can link gas delivery to measured process conditions and quality requirements. Suppliers that combine gas provision with monitoring and recovery technology are positioned to capture additional value in the 3D printing gases market.
Regional suppliers serve locations where global majors have less extensive distribution. Yingde Gases in China, Ellenbarrie Industrial Gases in India, and Gulfcryo in the Middle East can use local logistics and delivered-price flexibility to pursue additive manufacturing customers. Kaimeite Gases and SOL Spa are also positioned as regional suppliers for mid-market service bureaus in China and Southern Europe. These firms may be better suited to smaller contract volumes that global suppliers do not prioritize. Established leaders, however, retain advantages in purity traceability, technical services, and access to long-term contracts.
3D Printing Gases Industry Leaders
Linde PLC
Air Liquide
Air Products and Chemicals, Inc.
Messer SE & Co. KGaA
Nippon Sanso Holdings Corporation
- *Disclaimer: Major Players sorted in no particular order

Recent Industry Developments
- August 2026: Messer commissioned a new facility in East China with approximately 50,000 Nm³/h high-purity nitrogen supply capacity, expanding its bulk gas supply for China's electronics and advanced manufacturing sector. With this addition, Messer operates four large-scale bulk gas supply projects in China for electronics and advanced manufacturing customers, supplying nitrogen and argon for manufacturing-intensive industries.
- July 2026: Linde announced a USD 1 billion investment to expand its on-site industrial gas complex in Phoenix, Arizona, under a long-term agreement to supply ultra-high-purity nitrogen, oxygen, and argon via two new SPECTRA air separation units. The project added approximately USD 1 billion to Linde's sale-of-gas backlog, bringing it to USD 8.1 billion, with supply-side implications for high-purity gas availability in the U.S. Southwest advanced manufacturing corridor.


Global 3D Printing Gases Market Report Scope
3D printing gases are airborne emissions, volatile organic compounds (VOCs), and chemical fumes released during the additive manufacturing process as polymers are heated or resins are cured. These emissions are generated across various 3D printing technologies, including fused deposition modeling (FDM), stereolithography (SLA), and selective laser sintering (SLS).
The 3D printing gases market is segmented by gas, function, technology, end-user industry, and geography. By gas, the market is segmented into argon, nitrogen, and gas mixtures. By function, the market is segmented into insulation, cooling, illumination, and others. By technology, the market is segmented into stereolithography, laser sintering, binder jetting, polyjet, and others. By end-user industry, the market is segmented into aerospace and defense, automotive, healthcare, industrial manufacturing, consumer products, and others. The report also covers market size and forecasts for 3D printing gases across 15 countries in major regions. The market sizes and forecasts are provided in terms of value (USD).
| Argon |
| Nitrogen |
| Gas Mixtures |
| Insulation |
| Cooling |
| Illumination |
| Others |
| Stereolithography |
| Laser Sintering |
| Binder Jetting |
| PolyJet |
| Others |
| Aerospace and Defense |
| Automotive |
| Healthcare |
| Industrial Manufacturing |
| Consumer Products |
| Others |
| Asia-Pacific | China |
| India | |
| Japan | |
| South Korea | |
| ASEAN Countries | |
| Rest of Asia-Pacific | |
| North America | United States |
| Canada | |
| Mexico | |
| Europe | Germany |
| United Kingdom | |
| France | |
| Italy | |
| NORDIC Countries | |
| Rest of Europe | |
| South America | Brazil |
| Argentina | |
| Rest of South America | |
| Middle East and Africa | Saudi Arabia |
| South Africa | |
| Rest of Middle East and Africa |
| By Gas | Argon | |
| Nitrogen | ||
| Gas Mixtures | ||
| By Function | Insulation | |
| Cooling | ||
| Illumination | ||
| Others | ||
| By Technology | Stereolithography | |
| Laser Sintering | ||
| Binder Jetting | ||
| PolyJet | ||
| Others | ||
| By End-User Industry | Aerospace and Defense | |
| Automotive | ||
| Healthcare | ||
| Industrial Manufacturing | ||
| Consumer Products | ||
| Others | ||
| By Geography | Asia-Pacific | China |
| India | ||
| Japan | ||
| South Korea | ||
| ASEAN Countries | ||
| Rest of Asia-Pacific | ||
| North America | United States | |
| Canada | ||
| Mexico | ||
| Europe | Germany | |
| United Kingdom | ||
| France | ||
| Italy | ||
| NORDIC Countries | ||
| Rest of Europe | ||
| South America | Brazil | |
| Argentina | ||
| Rest of South America | ||
| Middle East and Africa | Saudi Arabia | |
| South Africa | ||
| Rest of Middle East and Africa | ||


Key Questions Answered in the Report
What is current market size of 3D Printing Gases Market?
The 3D printing gases market size was valued at USD 68.43 billion in 2025 and is estimated to grow from USD 73.71 billion in 2026 to reach USD 110.17 billion by 2031, at a CAGR of 8.37% during the forecast period (2026-2031).
Why is nitrogen growing quickly in additive manufacturing?
Nitrogen is forecast to grow at a 9.14% CAGR through 2031 because it is lower-cost in compatible steel, aluminum composite, and powder atomization applications.
Which end-user sector has the strongest outlook?
Healthcare held 28.17% of the value in 2025 and is expected to grow at a 9.82% CAGR through 2031, supported by patient-specific devices and tighter process documentation.
Which region has the highest growth outlook?
Asia-Pacific held 55.62% of the value in 2025 and is projected to grow at a 9.51% CAGR through 2031.
Page last updated on:


 Your data is secure and never sold or shared.


