
US Coffee Market Analysis by Mordor Intelligence
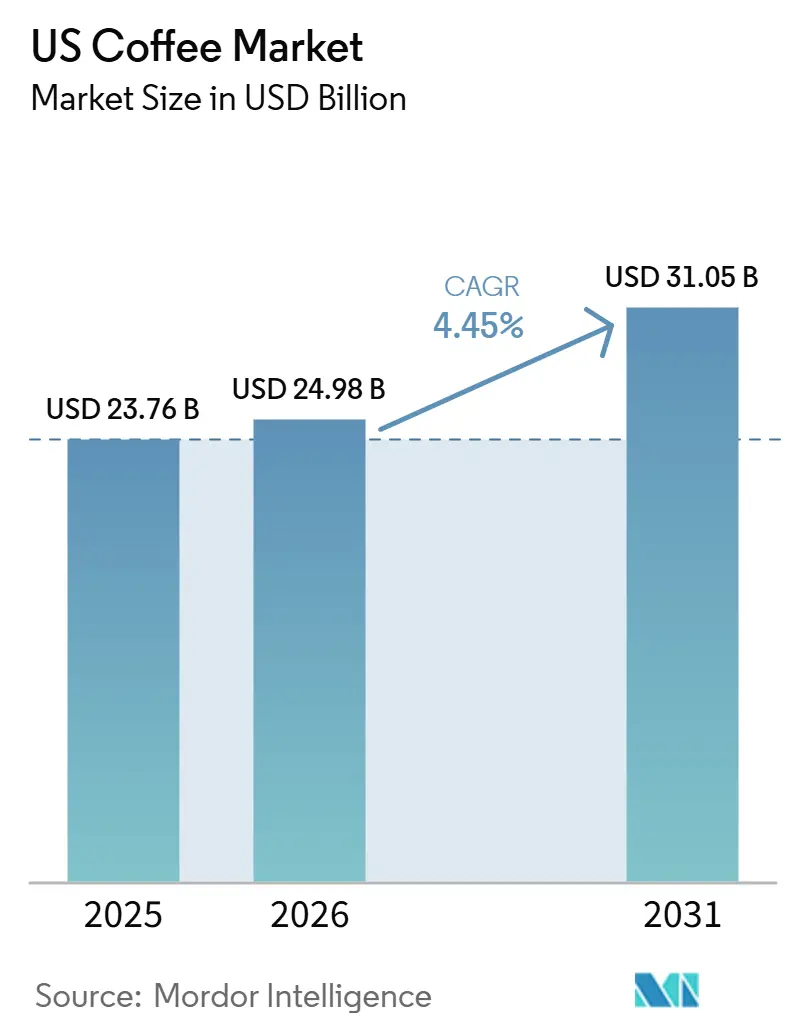
The US coffee market size was valued at USD 24.98 billion in 2026 and estimated to grow from USD 26.09 billion in 2027 to reach USD 32.23 billion by 2032, at a CAGR of 4.32% during the forecast period (2027-2032). The market volume was valued at 1.3 million tons in 2026 and estimated to grow from 1.32 million tons in 2027 to reach 1.45 million tons by 2032, at a CAGR of 1.85% during the forecast period (2027-2032).
Retail packaged formats anchor spending in the United States, making affordability under climate-related cost pressure central to ground coffee and single-serve offers. Suppliers extend branded retail ranges as specialty adoption and app ordering support premium and prepared-coffee occasions. California also ties qualifying state-connected food-service access to packaging approval. Price realization on packaged coffee is the main test for suppliers, while specialty adoption and app ordering give prepared-coffee sellers the clearer route to premium growth.
Key Report Takeaways
- Ground coffee led product types with a 39.17% US coffee market share in 2026, while coffee pods and capsules are forecast to grow fastest at a CAGR of 5.72% during 2027-2032.
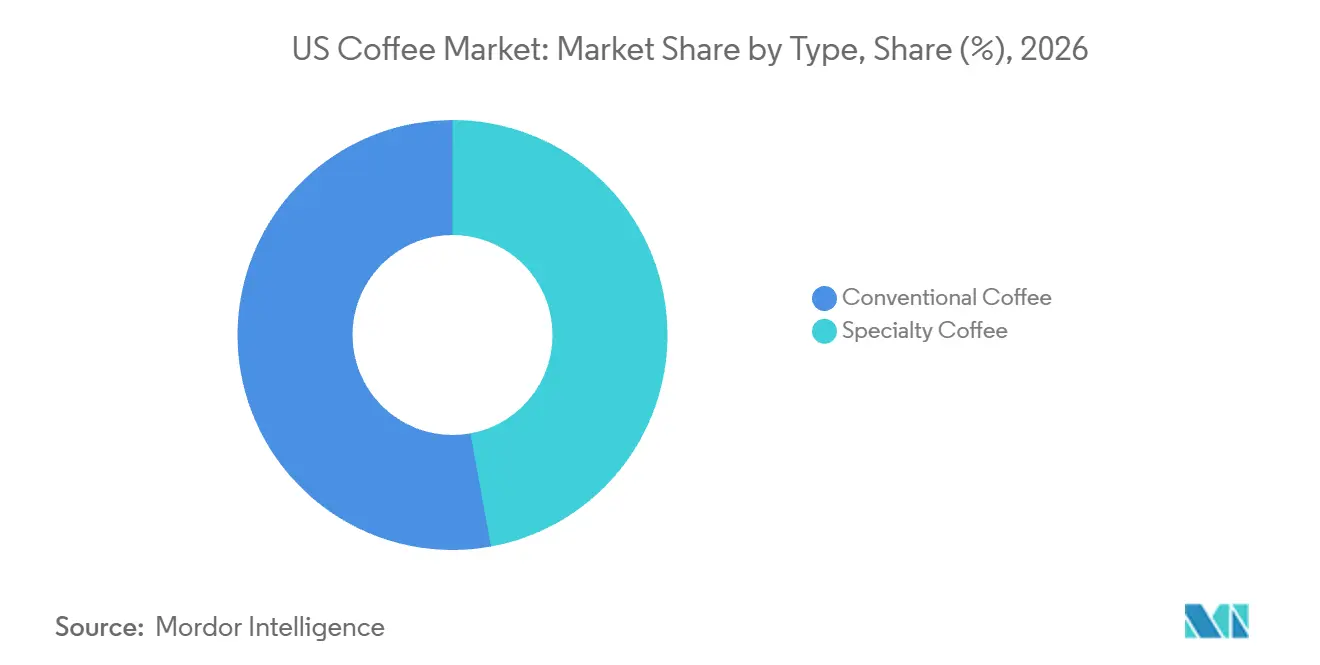
- By coffee type, conventional coffee accounted for a 52.87% share of the US coffee market size in 2026, with specialty coffee projected to grow fastest at a CAGR of 6.78% during 2027-2032.
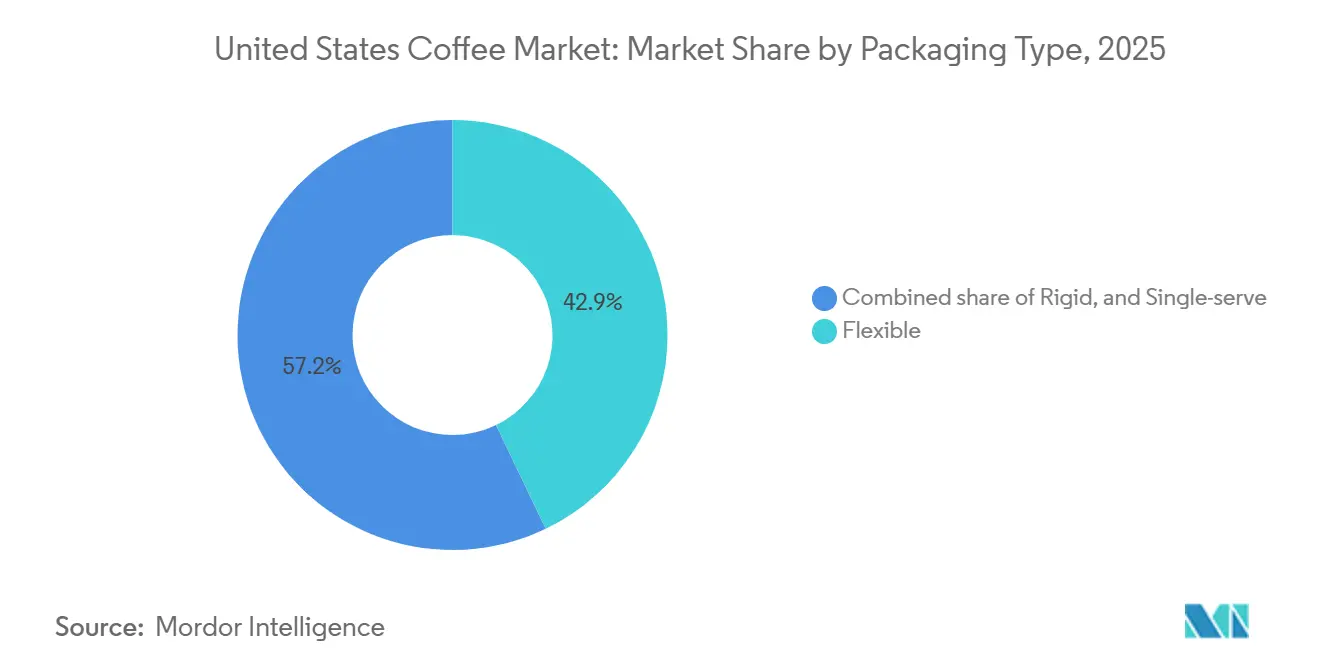
- Within packaging, flexible formats led with 42.76% of consumer coffee spending in 2026, and single-serve is forecast to be the fastest-growing segment at a CAGR of 6.08% during 2027-2032.
- Off-trade distribution held 87.67% of consumer coffee spending in 2026 and is also projected to grow fastest at a CAGR of 4.82% during 2027-2032.
- Among states, California held 24.03% of consumer coffee spending in 2026, whereas Florida is the fastest-growing state at a forecast CAGR of 5.95% during 2027-2032.
Note: Market numbers in this report are based on Mordor Intelligence's proprietary estimation framework, which combines nine months of actuals with Q4 projections for base year 2026.
Market Trends and Insights
Drivers Impact Analysis of US Coffee Market*
| Driver | (~) % Impact on CAGR Forecast | Geographic Relevance | Impact Timeline |
|---|---|---|---|
| Premiumization and third-wave coffee adoption among consumers | +2% | Nationwide | Medium term (2-4 years) |
| Growing demand for a functional and specialty coffee range | +1.1% | Nationwide | Short term (≤ 2 years) |
| Urbanization and a fast-paced lifestyle drive demand in on-trade distribution | +0.95% | Nationwide | Short term (≤ 2 years) |
| State compostable-packaging mandates packaging innovations | +0.45% | California state-connected food-service facilities | Medium term (2-4 years) |
| Growth of home-barista equipment is boosting whole-bean sales | +0.4% | Nationwide | Medium term (2-4 years) |
| Growth in the coffee house stores is fueling market demand | +0.35% | Nationwide | Medium term (2-4 years) |
| Source: Mordor Intelligence | |||
Premiumization and third-wave coffee adoption among consumers
Specialty coffee adoption gives roasters and cafés a broader audience for differentiated preparation and recognizable beverage styles. The National Coffee Association's June 2026 survey of 1,882 US adults aged 18 and over found that 48% had specialty coffee in the past day, a record high.[1] Its consumer-defined specialty category includes traditional coffee perceived as made from premium beans or grounds, espresso-based and other specialty beverages, and ready-to-drink coffee. Past-week espresso-based beverage consumption reached 47%, also a record high and up 17.5% since 2022. For café operators, familiar espresso drinks offer a route to that audience without making specialist brewing knowledge a prerequisite. The breadth of the category also gives packaged-coffee roasters a premiumization route that does not depend on operating a café.
Growing demand for a functional and specialty coffee range
Functional additions can create another reason to choose a prepared coffee when they complement the drink's existing flavor and texture. In Q2 FY2026, Starbucks reported more than 40% growth in cold-foam platform sales across its US company-operated business. The company attributed stronger appeal, especially among Gen Z, to new flavors and the introduction of protein. The platform covers cold foam added to coffee and other beverages. For coffeehouse operators, this supports developing functional options within a familiar beverage platform that can accommodate several variations. A shared modifier lets operators pursue functional demand across several drink types, reducing dependence on coffee-only adoption to sustain the addition.
Urbanization and a fast-paced lifestyle drive demand in on-trade distribution
Convenient access to prepared coffee gives foodservice operators a way to compete for drinking occasions away from home. In June 2026, 38% of US past-day coffee drinkers had coffee out of home, the highest level since January 2020. A record 40% of past-week out-of-home coffee buyers ordered coffee on an app in that survey. These behaviors make the route to a prepared drink part of the commercial offer alongside the coffee itself. Reducing the effort involved in obtaining that drink can help cafés address the substantial audience already consuming coffee outside the home. For a café, lacking app ordering means competing for those drinkers without a channel already used at record rates.
State compostable-packaging mandates packaging innovations
California's SB 1335 requires qualifying state-connected food-service facilities, including state-owned facilities, state-property concessionaires, and state-agency food-service contractors, to choose listed reusable, recyclable, or compostable packaging. Effective January 1, 2026, compostable materials must be regularly collected for composting by at least 75% of statewide organic-waste programs and accepted by at least 75% of in-state mixed-material compost facilities, replacing 50% thresholds. An alternative takeback route requires annual recovery of at least 75% of distributed items and compost-facility acceptance of all recovered items, alongside other listing and lawful compostable-labeling criteria. Cups are a covered packaging category, connecting these specifications directly to coffee service at qualifying facilities. Suppliers offering listed cups can serve those packaging needs, while an unlisted cup cannot qualify for use at covered facilities.
Restraints Impact Analysis of US Coffee Market*
| Restraint | (~) % Impact on CAGR Forecast | Geographic Relevance | Impact Timeline |
|---|---|---|---|
| Climate-induced yield volatility raising costs | -0.6% | Nationwide | Medium term (2-4 years) |
| Detrimental impact of coffee pods and capsules on the environment | -0.3% | Fort Collins and other nonaccepting communities | Medium term (2-4 years) |
| Growing consumer awareness regarding the adverse impacts of caffeine on human health | -0.2% | Nationwide | Short term (≤ 2 years) |
| Competition from alternative beverages | -0.15% | Nationwide | Short term (≤ 2 years) |
| Source: Mordor Intelligence | |||
Climate-induced yield volatility raising costs
Climate-related production losses make affordability harder to protect when coffee suppliers face pressure to recover higher input costs. The Food and Agriculture Organization reported historic international coffee-price highs in early 2025 amid climate-related production losses in Vietnam and Indonesia.[2] The Consumer Price Index showed US coffee prices up 7.1% year over year in September 2026. The Los Angeles Times attributed lower crop yields and higher global prices to climate conditions in Vietnam, Indonesia, and Brazil, alongside pandemic effects and tariffs. For packaged-coffee sellers and café operators, passing through a larger cost burden increases the price consumers must accept for the same drinking occasion. Absorbing that burden instead leaves less revenue after coffee costs, so suppliers must weigh consumer affordability against their own earnings.
Detrimental impact of coffee pods and capsules on the environment
Local recycling acceptance can limit the environmental proposition of single-serve coffee at the household level. Keurig Dr Pepper reported that some US communities' local recycling programs did not accept K-Cup pods in 2025. Fort Collins, Colorado, advises that single-use coffee pods and capsules of all types are not locally recyclable and should go in the trash. For recycling-oriented buyers, this makes acceptance at the disposal destination a practical condition of the format's environmental appeal. In 2025, Keurig Dr Pepper offered a take-back recycling program for US consumers in communities where local programs did not accept K-Cup pods. Households in those communities need a separate route to recycle K-Cup pods, so the format's recycling proposition carries an added disposal step.
*Our forecasts treat driver/restraint impacts as directional, not additive. The impact forecasts reflect baseline growth, mix effects, and variable interactions.
US Coffee Market Segment Analysis
By Product Type:
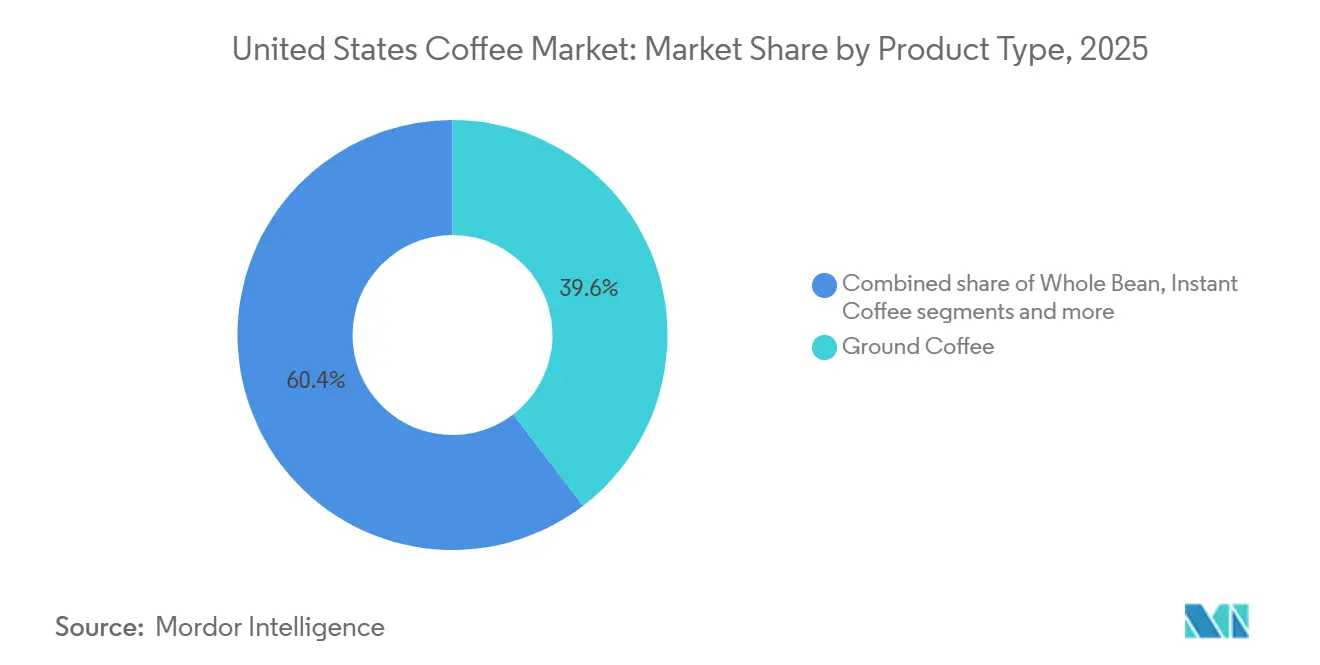
Ground Coffee Anchors Retail AssortmentsGround coffee accounted for a 39.17% share of the US coffee market size in 2026. For the largest segment, Keurig Dr Pepper launched 4 bagged ground-coffee varieties under The Original Donut Shop brand at major retailers nationwide beginning May 2025. The National Coffee Association's January 2026 survey found that 60% of US adults aged 18 and older owned a drip coffee maker at home. That equipment base gives a brand also known for K-Cup pods a route to serve drip-brewer owners through bagged ground coffee.
Coffee pods and capsules are the fastest-growing segment, forecast at a 5.72% CAGR during 2027-2032. Keurig Dr Pepper's U.S. Coffee segment recorded USD 3.21 billion in 2025 K-Cup pod net sales, including owned, licensed, partner-brand, and private-label activity. Increased K-Cup pod sales contributed to revenue growth in that segment in 2025. Keurig Dr Pepper's U.S. Coffee segment K-Cup pod volume fell 4.8% year over year in 2025, reflecting price elasticity impacts. For Keurig Dr Pepper, the 2025 pod volume decline alongside USD 3.21 billion of K-Cup pod net sales shows buyer response setting a limit on further price increases.


By Type:
Mainstream Brands Retain a Broad Spending BaseConventional coffee represented a 52.87% US coffee market share in 2026. Within this largest segment, J.M. Smucker Co. identified Folgers as the US mainstream roast-and-ground leader as of April 30, 2026. At that same reporting date, Smucker identified Café Bustelo alongside Folgers among its principal brands in the mainstream roast-and-ground coffee category, giving the supplier more than one branded coffee proposition. The largest segment is contested between brands owned by one supplier as well as between suppliers.
Specialty coffee is the fastest-growing segment, projected at a 6.78% CAGR during 2027-2032. In April 2026, North Carolina roaster 321 Coffee reported shifting its roasting operations to a larger Raleigh facility, adding equipment that more than triples production capacity. The roastery's scale-up responds to rising demand for 321 Coffee's coffee, and the added equipment lets one site fill larger customer orders.
By Packaging Type:
Pack Formats Link Production and Home BrewingFlexible packaging was the largest segment, representing 42.76% of consumer coffee spending in 2026. Diplomat Coffee, a coffee supplier and co-packer, opened its 70,000-square-foot Groveland, Florida, facility in January 2026. The company reported packaging lines running on September 30, 2026, handling fractional ground packs, retail coffee bags, and bag-in-bag formats, with full commissioning projected for January 2027. This separates a coffee co-packer's available bagging capability from full facility commissioning, giving customers an operating packaging option ahead of the projected final build-out.
Coffee in single-serve packaging is the fastest-growing segment, forecast at a 6.08% CAGR during 2027-2032. In the National Coffee Association's January 2026 consumer survey, 47% of US adults aged 18 and over owned a single-cup coffee machine at home. For suppliers serving those owners, additional coffee purchases can come from more frequent use of existing machines, without requiring another appliance purchase.
By Distribution Channel:
Retail Scale Meets Prepared-Coffee ServiceOff-trade was the largest segment with 87.67% of consumer coffee spending in 2026 and is forecast to be the fastest-growing segment at a 4.82% CAGR during 2027-2032. The National Coffee Association's June 2026 survey identified grocery stores as the leading channel for coffee purchased for in-home preparation. The same consumer survey reported that grocery's channel share for those purchases was lower than in January 2026. Purchases at mass merchandisers for in-home preparation increased to 28% in June 2026 from 23% in January 2026. Packaged-coffee brands seeking that expanding purchase route need access to mass merchandisers alongside grocery, broadening the retail account base relevant to off-trade growth.
Off-trade places brewing after the packaged-coffee purchase, while on-trade sells prepared coffee through a service encounter. For on-trade, an illustration of that service route is the National Coffee Association's June 2026 finding that 55% of past-week out-of-home coffee buyers ordered at a drive-through. Coffeehouse operators compete through fulfillment as well as the drink, while packaged-coffee brands compete for the product selected before home preparation.
Geography Analysis
California US Coffee Market
California accounted for 24.03% of the US coffee market size in 2026, making it the largest state market. Employment at independent coffee shops in Homebase's internal California sample increased 6.6% from 2024 to 2025. Hours worked grew 8.3%, while total payroll rose 13.8% for the same sample and period. These measures point to a growing staffed service base, with payroll expenditure increasing faster than the hours worked. This makes sales per staffed hour commercially important for independent café operators seeking to convert a larger labor base into viable coffee service.
Florida US Coffee Market
Florida is the fastest-growing state, forecast to expand at a 5.95% CAGR during 2027-2032. Buddy Brew Coffee opened a café inside the Riverview Sprouts Farmers Market on September 23, 2026, bringing its full café menu into the host grocer's retail setting. The Riverview café was the sixth of 10 Buddy Brew cafés planned inside Sprouts stores across the region, establishing grocery co-location as a multi-site rollout format. For a specialist café operator, that format places prepared-coffee service in front of shoppers already making a grocery trip.
Caribou Coffee's company-owned Watauga coffeehouse, its first standalone Texas unit, opened in June 2025 with walk-up and drive-through service for on-the-go customers. Homebase's independent New York coffee-shop sample showed payroll up 22% and employment up 9.5% from 2024 to 2025 while hours fell 1%, implying higher payroll per hour. Pennsylvania's Roaming Bean added a Pittsburgh storefront to its beverage-truck business on January 21, 2026, and The Left Hook Coffee held its permanent café's grand opening in Raleigh, North Carolina, on August 1, 2026. In Illinois, Qamaria Coffee's co-owner reported more customers sitting down after midnight at Bridgeview during Ramadan 2026. Outlet format and service timing offer distinct expansion routes, while the New York sample underscores the cost of each labor hour.
Regulatory Framework and Outlook
The comparison covers selected jurisdictions from the perspective of a coffee seller operating a qualifying chain and acting as a producer of covered packaging in California. Federal rules require restaurant chains with 20 or more locations under the same name and offering substantially the same menu items to disclose menu-item calories and provide additional nutrition information on request.[3] California's SB 54 shifts collection, processing, and recycling costs for covered materials from local governments to the companies producing those materials.
Regulatory Table of US Coffee Market
| Decision factor | United States | California |
|---|---|---|
| Primary authority | Food and Drug Administration | CalRecycle |
| Key instruments or direction | 21 CFR 101.11 menu disclosures for qualifying chains and voluntarily registered establishments | SB 54 approved-plan participation requirement for covered-material producers by January 1, 2027 |
| Commercial effect | Menu calories and additional written nutrition information on request | Producer responsibility for collection, processing, and recycling costs |
| Current policy attractiveness | Medium | Low |
| Future direction of policy attractiveness | No change | Hardening |
| Source: Mordor Intelligence | ||
Federal attractiveness is Medium for that seller because menu disclosure is a defined operating requirement. No change reflects continuing 21 CFR 101.11 disclosure duties because FDA's January 2026 priority list describes only a planned menu-labeling investigation, with no proposed or scheduled amendment to those duties. California is Low and Hardening for that seller as a producer of covered packaging because participation in an approved plan becomes a condition of market access on January 1, 2027. CalRecycle's October 13, 2026, receipt of Circular Action Alliance's plan for a 75-day compliance review makes the approval process commercially material to that deadline.
Value Chain Stages
The value chain compares green-coffee supply, manufacturing, and retail-channel distribution serving US coffee offers. Neumann Gruppe USA's Rothfos, InterAmerican Coffee, and Atlas Coffee Importers divisions supply roasters across North America, while Neumann Gruppe USA provides logistics and accounting support. Westrock Coffee's Little Rock, Arkansas, operations include single-serve and retail-bag production. These roles separate the earnings from supplying an upstream commodity, converting it into packaged coffee, and bringing branded products into retail channels.
Value Chain Analysis Table of US Coffee Market
| Primary activity | Key participants | Value capture | Bottleneck | Resilience response |
|---|---|---|---|---|
| Green-coffee import and supply | Green-coffee importers such as Rothfos, InterAmerican Coffee, and Atlas Coffee Importers | Green-coffee sales to roasters | Coordination of import logistics and roaster deliveries | Use shared logistics support across importer divisions |
| Coffee manufacturing and packaging | Coffee manufacturers such as Westrock Coffee | Manufactured-coffee sales and roasting or packaging service earnings | Format-specific capacity for bags and single-serve products | Maintain production routes for the formats served |
| Retail-channel distribution | Packaged-coffee distributors such as Nestlé USA | Packaged-coffee sales through retail supply | Coordination of branded-product and channel responsibilities | Define distribution responsibilities around the brand's retail-channel rights |
| Source: Mordor Intelligence | ||||
Westrock Coffee's service scope spans sourcing, roasting, packaging, and distribution for customer industries around the world. Integration can therefore place several sources of supplier earnings within the same commercial relationship. Format breadth gives an integrated roaster more opportunities to retain packaging and distribution earnings after the green-coffee purchase, while the importer supplies a distinct upstream service.
Competitive Landscape
Market Concentration
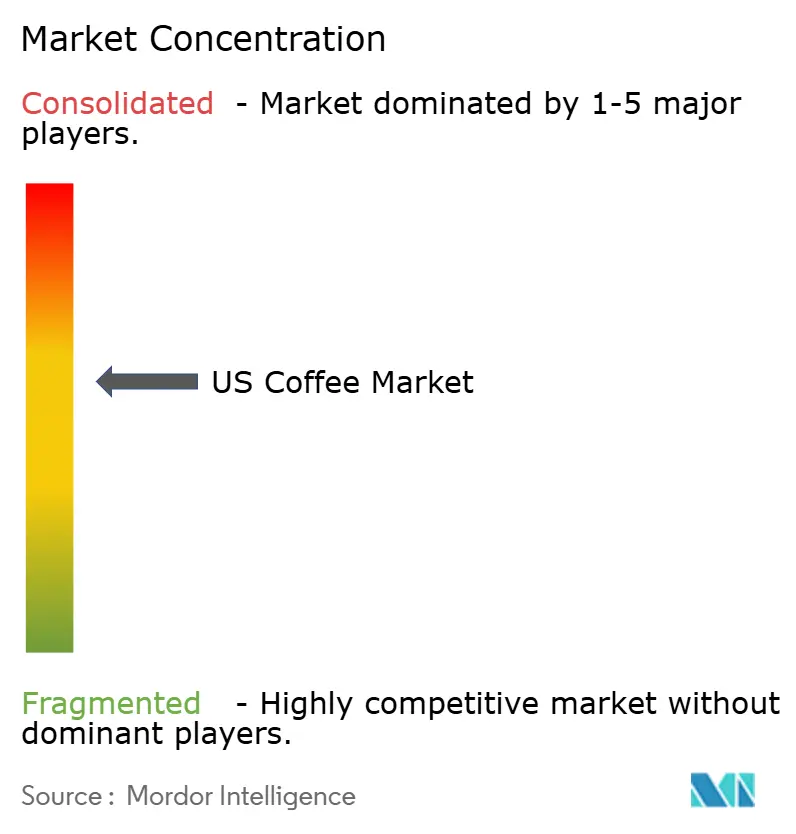
The competitive field combines large branded suppliers with independent café businesses, creating a partly fragmented structure across packaged coffee and prepared drinks. Major participants include Starbucks Corporation, J.M. Smucker Co., Nestlé SA, Keurig Dr Pepper Inc., and Luigi Lavazza S.p.A. Smucker's U.S. Retail Coffee segment reported USD 3.3 billion in net sales for fiscal 2026, up 18% from fiscal 2025. The relevant competitive set changes with the route to the consumer, so a coffeehouse brand and a supermarket coffee supplier can challenge the same drinking occasion through different business models.
On April 21, 2026, Keurig Dr Pepper and Nestlé USA announced an extended agreement covering Starbucks K-Cup pod manufacturing and distribution in the United States and Canada. The companies also announced programs focused on expanded distribution and innovation for Starbucks coffee in the Keurig brewing system. The arrangement ties a branded pod offer to manufacturing and distribution coordination across firms, making the route to consumers part of product competition. The extension keeps an established coffeehouse brand's pods inside the Keurig system, leaving rival pod brands competing against a Starbucks line with manufacturing and distribution arranged.
Retail and e-commerce give coffee producers another basis for differentiation alongside the formats they sell. Lavazza Group reported North American revenue growth of 26.9% in 2025, driven mainly by retail and e-commerce. Its US commercial business, Lavazza North America, offers whole-bean, ground, capsule, and pod coffee. California's SB 54 allows producers with gross annual sales below USD 1 million to apply for exemption from most reporting and fee requirements. Those small producers still need to plan for all packaging they sell to be recyclable or compostable by 2032.
US Coffee Industry Leaders
-
Starbucks Corporation
-
J.M. Smucker Co.
-
Nestlé SA
-
Keurig Dr Pepper Inc.
-
Luigi Lavazza S.p.A.
- *Disclaimer: Major Players sorted in no particular order
US Coffee Market Companies Covered in this Report
- Starbucks Corporation
- J.M. Smucker Co.
- Keurig Dr Pepper Inc.
- Nestlé SA
- Kraft Heinz Co.
- Luigi Lavazza S.p.A.
- Community Coffee Company
- Dunkin' Brands Group, Inc.
- Caribou Coffee Company
- Farmer Brothers Co.
- La Colombe Coffee Roasters
- Death Wish Coffee Co.
- Black Rifle Coffee Company
- High Brew Coffee
- Bulletproof 360 Inc.
- Allegro Coffee Company
- RISE Brewing Co.
- Coffee Bros
- Chilz Coffee
- Counter Culture Coffee
Key Opportunities for Market Participants
The opportunities compare prepared cold-coffee offers with packaging decisions affecting retail coffee and café service. In January 2026, 60% of US specialty coffee drinkers had cold coffee in the past week, up 6.6 percentage points from January 2025. California's permanent SB 54 regulations took effect on May 1, 2026, establishing extended producer responsibility for covered packaging and single-use plastic food-service ware, with primary end-of-life responsibility assigned to producers.
Market Opportunities Table of US Coffee Market
| Opportunity | Why now | Buyer / lead segment | Recommended play | Main barrier | Likely beneficiaries |
|---|---|---|---|---|---|
| Prepared cold specialty coffee | Increased past-week cold-coffee participation among specialty drinkers in January 2026 | US specialty-coffee drinkers | Build café-prepared cold-coffee offers around a distinct drinking occasion | Product differentiation within a widely used cold-coffee category | Specialty café operators and coffee roasters |
| Retail coffee offers designed around covered-package responsibilities | Operative SB 54 framework for covered packaging | Coffee brands placing covered packages in California | Coordinate the coffee pack with its producer's end-of-life responsibility | Producer responsibilities extend beyond selling the filled package | Roasters coordinating coffee and packaging decisions |
| Café coffee offers paired with suitable covered service ware | SB 54 also addresses covered single-use plastic food-service ware | Café operators buying covered service ware in California | Align the prepared-drink offer with the responsible producer's packaging pathway | Coordination of café service and covered-producer duties | Café operators and the coffee suppliers serving them |
| Source: Mordor Intelligence | |||||
Prepared cold specialty coffee offers a product response to increased cold-coffee participation within specialty consumption. Coffee businesses can pursue that occasion through café-prepared drinks while coordinating the serving package with the relevant producer. For covered packages in California, that coordination can make end-of-life responsibility part of the commercial coffee offer.
Recent Industry Developments in US Coffee Market
- Oct 2026: CalRecycle received Circular Action Alliance's producer responsibility plan for California's SB 54 packaging program on October 13, 2026, starting a 75-day compliance review.
- Sep 2026: Starbucks Corporation announced plans to close approximately 1% of its more than 18,000 North American coffeehouses that did not meet its expected customer experience and financial performance standards.
- Apr 2026: Keurig Dr Pepper Inc. and Nestlé USA announced an extended agreement for Starbucks K-Cup pod manufacturing and distribution in the US and Canada, including new programs focused on expanded distribution and innovation.
US Coffee Market Report Scope and Research Methodology
Market Definition and Coverage
The US coffee market measures annual consumer spending on roasted coffee products sold across the US. It covers packaged coffee sold through retail channels and coffee beverages prepared and sold to consumers by foodservice outlets.
Scope exclusions: Intermediate wholesale sales of packaged coffee, unroasted green coffee beans sold to roasters, coffee brewing equipment, noncoffee food and beverage sales at foodservice outlets, and bottled or canned ready-to-drink coffee beverages are excluded.
Segments Covered in This Report
- By Product Type
- Whole Bean
- Ground Coffee
- Instant Coffee
- Coffee Pods and Capsules
- By Type
- Conventional Coffee
- Specialty Coffee
- By Packaging Type
- Flexible
- Rigid
- Single-Serve
- By Distribution Channel
- On-Trade
- Off-Trade
- Supermarkets/Hypermarkets
- Convenience/Grocery Stores
- Online Retail Stores
- Other off-trade Channels
- By Geography
- California
- Texas
- Florida
- New York
- Pennsylvania
- Illinois
- Rest of the United States
Data Sources, Market Sizing, and Validation
Desk Research
Sources such as the National Coffee Association's National Coffee Data Trends surveys, the USDA Foreign Agricultural Service's Coffee: World Markets and Trade circular, US Census Bureau merchandise import records, and USDA Economic Research Service food-import data provide illustrative evidence on US consumption behavior, physical supply, import exposure, and trade values. These sources can help distinguish household and out-of-home occasions, track coffee availability and price pressure, and check whether changes in trade or consumption support a forecast assumption.
Company 10-Ks, investor materials, and reputable press provide supplementary checks on product portfolios, pricing, channel activity, and foodservice exposure, with reported company sales kept distinct from market totals. These named sources are not exhaustive, and further sources inform collection, validation and clarification.
Primary Interviews and Surveys
Primary research covers coffee roasters and packaged-coffee suppliers, grocery and online retail buyers, coffee-shop and foodservice operators, and distribution or procurement specialists, with perspectives from executives, functional leaders, and managers. Structured interviews and a targeted survey test secondary findings on channel mix, product formats, consumer prices, and state differences, while clarifying whether figures refer to final consumer purchases, intermediate sales, or a narrower product pool. Analysts reconcile disagreements against independent consumption, trade, and company evidence, record unresolved gaps, and adjust relevant assumptions rather than filling them with unsupported estimates.
Distribution of primary research fieldwork respondents
| Company type | Respondent position | Region |
|---|---|---|
| Top tier: 30% | CXOs: 20% | |
| Mid tier: 50% | Functional/Unit leaders: 35% | |
| Smaller Players: 20% | Managers: 45% |
Market-Sizing & Forecasting
After separating consumer purchases from intermediate transactions and equipment revenue, the model estimates final US spending on packaged coffee and coffee beverages sold by foodservice through a top-down approach, then checks selected channel and supplier estimates using sampled average selling prices and volumes or supplier roll-ups. It builds separate value and physical-volume series because price and product mix can raise spending faster than the amount of coffee consumed. Core indicators include USDA coffee consumption in 60-kilogram bags for physical demand, NCA measures of at-home and out-of-home use for channel allocation, Census import quantities and values for supply availability, and retail coffee prices for the value bridge. Specialty participation and format adoption help explain mix shifts across the report's product, type, packaging, channel, and state cuts. When demand, trade, and price signals move differently, a multivariate regression relates historical value and volume to those indicators, with scenario analysis testing climate-driven supply and input-cost changes. Segment shares follow the best available consumer and channel evidence and must sum to the corresponding total. Primary respondents check whether forecast drivers and channel assumptions fit observed purchasing and operating conditions, while missing or inconsistent bottom-up inputs are bounded with independent retail, company, and trade evidence and retained as explicit model assumptions.
Data Validation & Update Cycle
Analysts triangulate consumer survey patterns, USDA consumption balances, Census trade records, retail price movements, company disclosures, and selective channel estimates, then investigate anomalies in growth, shares, value-volume relationships, and state or channel totals before sign-off. A second analyst reviews source dates, units, coverage, calculations, and explanations. Material conflicts trigger targeted re-contact of relevant respondent types, the model refreshes annually, material events prompt an interim update, and a fresh source and calculation pass occurs before delivery.
Mordor Intelligence's United States Coffee Market Size Versus Other Published Estimates
Published estimates can differ in the transactions and products they count and the inputs used to model demand. The US coffee market measures annual consumer spending on roasted coffee products sold across the US.
Key Gap Drivers include the study's defined coverage and market-specific modeling choices. Primary respondents check whether forecast drivers and channel assumptions fit observed purchasing and operating conditions, while missing or inconsistent bottom-up inputs are bounded with independent retail, company, and trade evidence and retained as explicit model assumptions.
Benchmark comparison
| Source | Market Size | Gaps in Research Methodology |
|---|---|---|
| Mordor Intelligence | Value: USD 26.09 B (2027) / Volume: 1.32 million tons (2027) | |
| Global Consultancy A | USD 90.97 B (2025) | The published total includes ready-to-drink coffee and consumer coffee spending through both retail and foodservice, extending beyond the report's roasted packaged and prepared foodservice coffee boundary. |
| Regional Consultancy B | USD 27.95 B (2025) | The estimate includes ready-to-drink beverages, adding a product category excluded from the report's measured coffee pool. |
Mordor Intelligence's analysts triangulate consumer survey patterns, USDA consumption balances, Census trade records, retail price movements, company disclosures, and selective channel estimates, then investigate anomalies in growth, shares, value-volume relationships, and state or channel totals before sign-off.
Key Questions Answered in the Report
What is the US coffee market size and projected growth?
Value is estimated at USD 26.09 billion in 2027 and forecast to reach USD 32.23 billion by 2032, at a 4.32% CAGR during 2027-2032.
What is supporting demand for prepared coffee in the United States?
Specialty-coffee adoption and convenient ordering are key demand forces. In June 2026, a record 40% of US past-week out-of-home coffee buyers ordered coffee on an app.
Which product type leads US coffee spending?
Ground coffee led product types with 39.17% of consumer coffee spending in 2026. Coffee pods and capsules are forecast to grow fastest at a 5.72% CAGR during 2027-2032.
Which companies are major competitors in the US coffee sector?
Major participants include Starbucks Corporation, J.M. Smucker Co., Nestlé SA, Keurig Dr Pepper Inc., and Luigi Lavazza S.p.A.
What could constrain the outlook for US coffee suppliers?
Affordability is a key challenge, with the Consumer Price Index showing US coffee prices up 7.1% year over year in September 2026. Suppliers face a trade-off between recovering costs and maintaining consumer appeal.
Which US states lead coffee spending and projected growth?
California held 24.03% of consumer coffee spending in 2026. Florida is forecast to grow fastest at a 5.95% CAGR during 2027-2032.