
Market Overview
| Study Period | 2020 - 2031 |
|---|---|
| Forecast Data Period | 2026 - 2031 |
| Base Year Market Size (2025) | USD 66.44 Billion |
| Market Size (2026) | USD 70.37 Billion |
| Market Size (2031) | USD 93.75 Billion |
| Growth Rate (2026 - 2031) | 5.91 % |
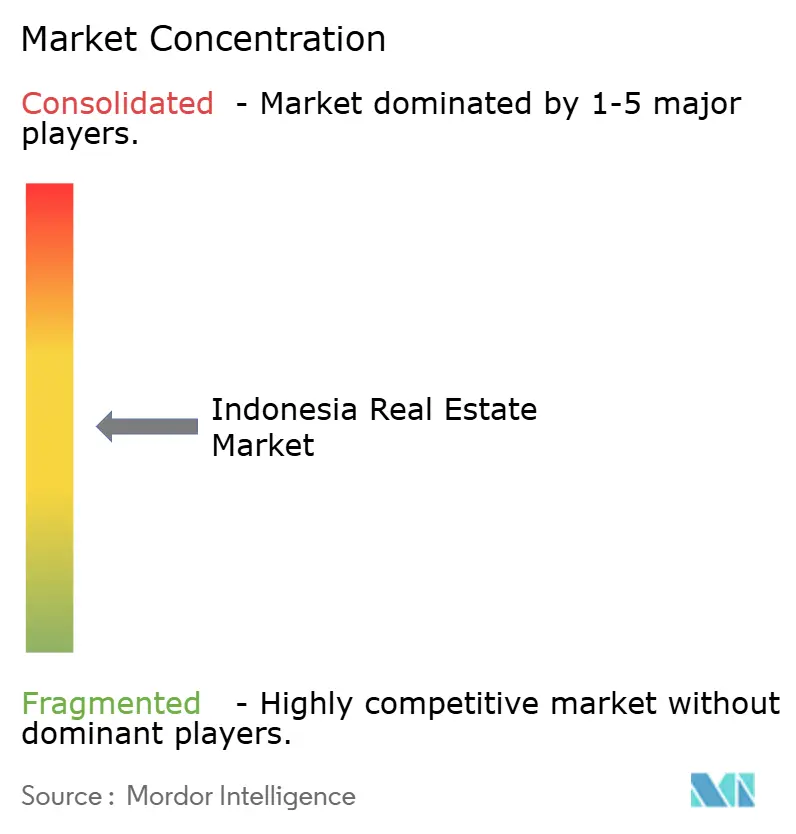
| Market Concentration | Medium |
Major Players *Disclaimer: Major Players sorted in no particular order Image © Mordor Intelligence. Reuse requires attribution under CC BY 4.0. | |
Indonesia Real Estate Market Analysis by Mordor Intelligence
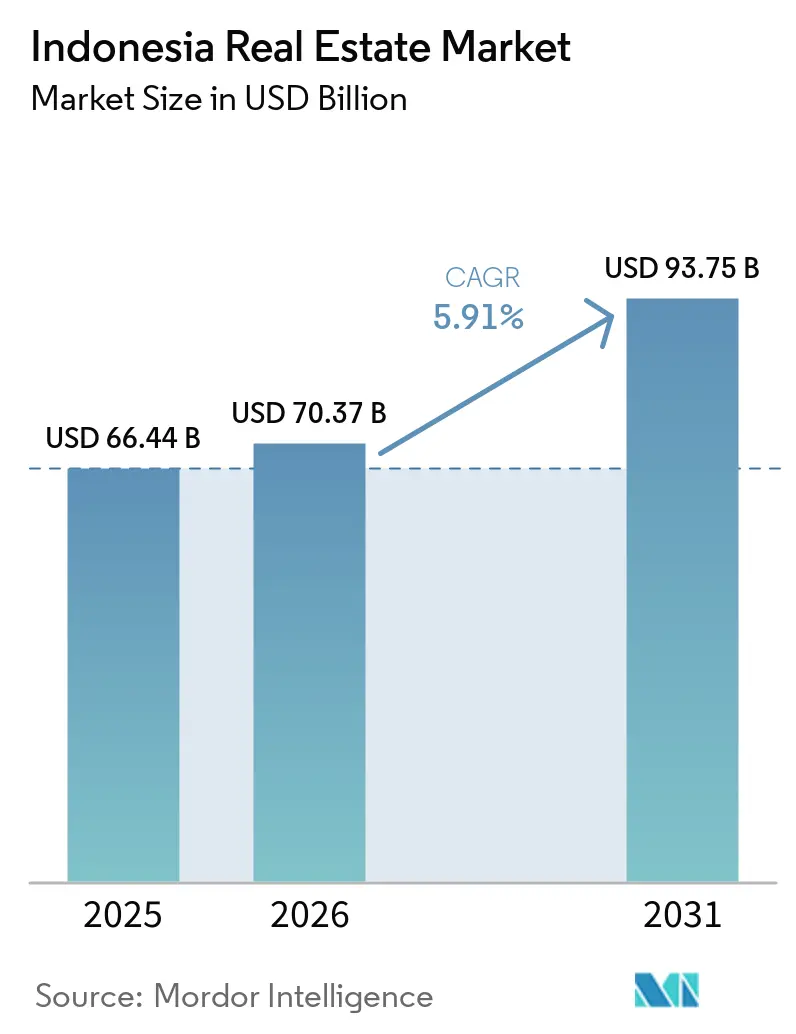
The Indonesia Real Estate Market size is projected to expand from USD 66.44 billion in 2025 and USD 70.37 billion in 2026 to USD 93.75 billion by 2031, registering a CAGR of 5.91% between 2026 to 2031.
Strong demographic momentum, rapid urbanization, and a government-backed infrastructure spree are enlarging the nation’s housing, logistics, and mixed-use footprints. Investors are shifting capital from Jakarta to second-tier hubs in West and East Java, chasing lower land costs and port connectivity. Manufacturers relocating under “China + 1” strategies are underpinning long-lease demand for modern warehouses, while households continue to dominate residential take-up despite interest-rate volatility. Developers, meanwhile, are embedding recurring-revenue amenities—co-working hubs, data-center shells, and flexible living units—into master-planned townships to hedge against cyclical sales swings.
Key Report Takeaways
- By property type, residential led the Indonesian real estate market with 55.1% of the market share in 2025; logistics properties are forecast to grow at a 6.49% CAGR through 2031.
- By business model, the sales channel held 72.2% of the Indonesian real estate market share in 2025, while rental is projected to grow at a 6.84% CAGR through 2031.
- By end-user, individuals and households accounted for 73.7% of the Indonesian real estate market share in 2025, whereas the corporate and SME segment is poised to grow at a 6.71% CAGR through 2031.
- By region, DKI Jakarta captured 39.4% revenue share in 2025, but East Java is forecast to expand at a 7.11% CAGR through 2031.
Note: Market size and forecast figures in this report are generated using Mordor Intelligence’s proprietary estimation framework, updated with the latest available data and insights as of January 2026.
Indonesia Real Estate Market Trends and Insights
Drivers Impact Analysis*
| Drivers | ( ~ ) % Impact on CAGR Forecast | Geographic Relevance | Impact Timeline |
|---|---|---|---|
| Strong demographics, urbanization, and rising middle class | +1.8% | Java’s major provinces plus emerging Sumatra & Sulawesi cities | Long term (≥ 4 years) |
| Infrastructure push and IKN Nusantara | +1.5% | East Kalimantan core, spillover to West Java corridors | Medium term (2-4 years) |
| “China + 1” FDI and manufacturing growth | +1.4% | West & East Java, Central Java | Short term (≤ 2 years) |
| Tourism rebound and MICE activity | +0.9% | Bali, Yogyakarta, Lombok, Jakarta | Medium term (2-4 years) |
| REITs and proptech adoption | +0.8% | Nationwide with early traction in Jakarta, Surabaya, Bandung | Long term (≥ 4 years) |
| Expansion of e-commerce and retail networks boosting demand for warehousing and retail spaces | +0.5% | Java industrial corridor, major port cities | Short term (≤ 2 years) |
| Source: Mordor Intelligence | |||
Strong Demographics, Urbanization, and Rising Middle Class Boosting Housing, Retail, and Services Demand
Indonesia’s urban cohort passed 59% of the total population in 2024, adding nearly 3 million new city dwellers each year[1]. Household sizes are shrinking, so the absolute need for separate dwelling units is rising even when headcount growth moderates. Developers have responded by offering sub-USD 67,000 two-bedroom apartments that qualify for VAT exemptions, stabilizing primary residential sales as shown by Bank Indonesia’s Q3 2025 data. Consumption habits are also shifting toward experiential retail—food halls and co-working cafés—leading builders to fuse commercial podiums into residential towers. This blending of uses allows landlords to monetize common areas through rental income, cushioning them against slower condo sales cycles. Consequently, urban-core projects that mix living, working, and leisure spaces are absorbing capital ahead of single-use schemes, supporting the broader growth of the Indonesia Real Estate Market.
Infrastructure Push and IKN Nusantara Unlocking Development Corridors and Mixed-Use Pipelines
The USD 15.3 billion state budget for IKN signals more than a new capital; it is catalyzing land grabs along the Balikpapan-Samarinda axis and the Jakarta–Bandung high-speed rail corridor. The real estate market in Indonesia includes private developers that prefer adjacent municipalities to the restricted IKN core, where they partner with government agencies on pre-sold civil-servant housing. The rail link slashes Jakarta–Bandung travel to 40 minutes, inflating land values near Tegalluar station by up to 20% and spawning transit-oriented townships. Yet timelines remain sensitive to fiscal allocations, urging firms to hedge by also banking plots in West Java’s Cikarang-Karawang belt. Projects able to align with both corridors diversify geographic risk while tapping synchronized demand for residences, retail, and logistics hubs.
“China + 1” FDI and Manufacturing Growth Driving Industrial Parks, Warehousing, and Worker Housing
Chinese investment topped USD 8.1 billion in 2024, with over half linked to facilities that bundle light assembly and warehousing. ESR Indonesia and Mitsubishi’s INA-backed joint venture delivered 216,864 m² of space in early 2025, pre-leasing 90% to EV-battery suppliers on 10- to 15-year terms. Such agreements lock in yields of 7-7.5%, compressing cap rates and drawing institutional buyers. LG Energy Solution’s USD 6 billion Karawang complex triggered demand for 12,000 worker-housing units, forcing local developers to trial modular dormitories. Long leases with expansion clauses tie up contiguous land, so spec build-to-suit warehouses now launch even before zoning finalization. Net absorption pushed Greater Jakarta vacancy down to 5.9% by mid-2025, confirming logistics as the market’s most liquid asset class.
Tourism Rebound and MICE Activity Supporting Hotel, Resort, and Lifestyle Mixed-Use Projects
International arrivals rebounded to 11.5 million in 2024, but Bali’s late-2024 moratorium on new hotels in saturated districts has diverted capital to Lombok, Raja Ampat, and Labuan Bajo. Developers, therefore, package resorts with branded residences and wellness centers, monetizing inventory through strata titles rather than room-nights alone. Jakarta’s new PIK 2 convention center pre-booked 18 international events for 2025-2026, boosting serviced-apartment demand within a 3 km catchment. Still, austerity cuts to public travel budgets momentarily drove hotel occupancy down to 20% in some provinces. Successful players in the Indonesia real estate market now view hospitality as an amenity within integrated townships, smoothing income streams across volatile tourism cycles.
Restraints Impact Analysis*
| Restraints | ( ~ ) % Impact on CAGR Forecast | Geographic Relevance | Impact Timeline |
|---|---|---|---|
| Land/title complexity and policy variability | −1.2% | Outer islands, coastal zones, and nationwide permitting | Long term (≥ 4 years) |
| High funding costs and construction inflation | −0.9% | Nationwide, hardest on mid-tier builders in secondary cities | Short term (≤ 2 years) |
| Segment-specific oversupply and uneven recovery | −0.7% | Jakarta offices, Bali resorts, Surabaya retail corridors | Medium term (2-4 years) |
| High construction and financing costs impacting developer margins and end-user pricing | −0.3% | National, with acute impact in remote areas | Short term (≤ 2 years) |
| Source: Mordor Intelligence | |||
Land/Title Complexity, Zoning/Permitting Delays, and Regional Policy Variability Slowing Execution
The national land-registration drive certified 76% of 126 million plots by 2025, yet unresolved customary claims in Kalimantan, Sulawesi, and Papua slow projects by 12-18 months and lift acquisition costs by up to 30%[2]. A USD 653 million World Bank loan targets an extra 4.8 million hectares by 2028, but district-level capacity remains the bottleneck. Regulation No. 5/2025 decentralizes title issuance, allowing Java districts to clear permits in 60 days while some Kalimantan offices take 180 days. Coastal zoning overlaps among forestry, fisheries, and tourism agencies have delayed Lombok resort schemes, forcing developers to add sizable legal contingencies. Consequently, many firms pivot to brownfield joint ventures with state enterprises that own certified land, trading higher costs for execution certainty.
High Funding Costs and Construction Inflation Tightening Feasibility for New Starts
Bank Indonesia trimmed its policy rate to 5.75% in late 2024, yet bank lending to developers still stands near 9-11% after risk spreads. Steel remains 35% pricier than pre-pandemic levels, and cement inflation adds roughly 8% to hard costs. Skilled laborers are migrating to mega-projects such as IKN, pushing wages up 8-10% annually. With 78% of builders relying on internal or non-bank funding in Q3 2025, pre-sales quotas have risen above 60% before ground-breaking, elongating cash-conversion cycles[3]. Modular construction trims on-site labor by 30% and reduces build time by 20%, yet adoption sits below 10% because of high tooling expenses and shallow supply chains.
*Our forecasts treat driver/restraint impacts as directional, not additive. The impact forecasts reflect baseline growth, mix effects, and variable interactions.
Segment Analysis
By Property Type: Commercial Segment Accelerates Despite Residential Dominance
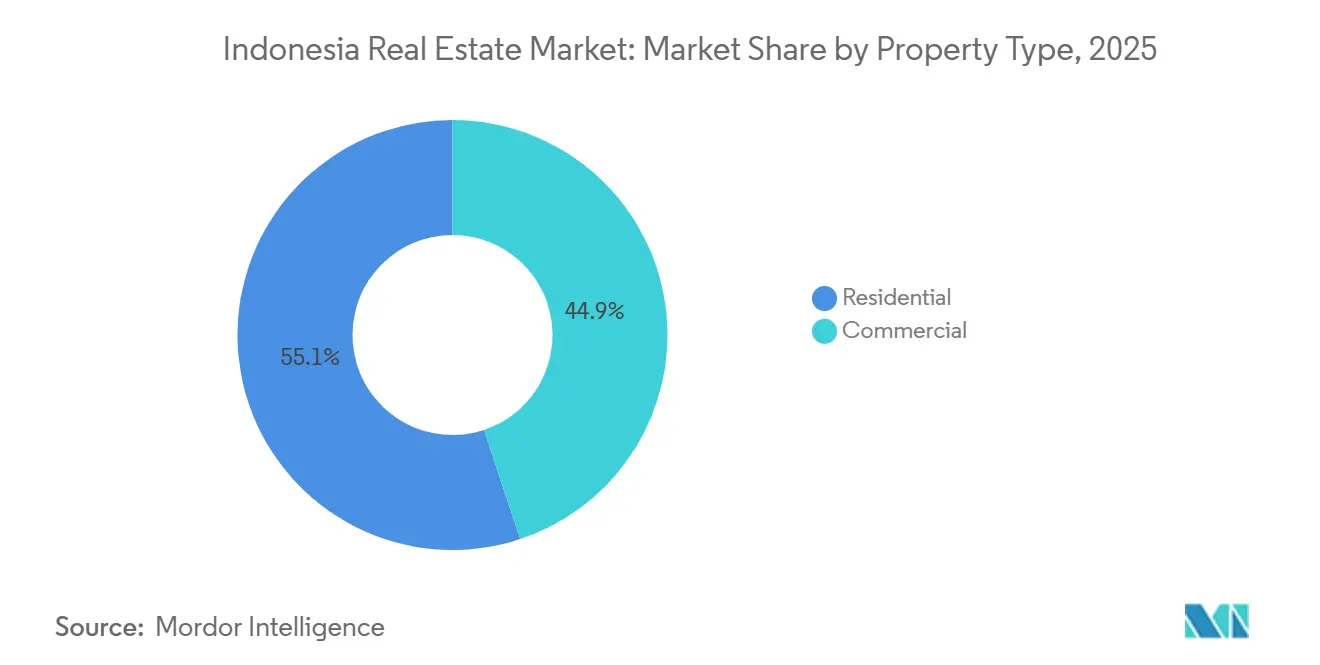
Residential assets commanded 55.1% of the Indonesian real estate market size in 2025, underpinned by a structural housing shortfall and state subsidies for first-time buyers. Yet the segment’s 5.2% forecast CAGR trails the overall Indonesian real estate market because price caps and mortgage-rate swings squeeze margins. Logistics buildings, though on a smaller base, are racing ahead at a 6.49% CAGR as EV-battery supply chains pre-lease large-format warehouses near Cikarang and Karawang. Institutional appetite for bond-like cash flows has driven yields to 7-7.5%, narrowing the premium over sovereign bonds.
Developers are now integrating mini-logistics hubs—parcel lockers and cold-storage rooms—into new residential townships, monetizing ground-floor areas once reserved for parking. Meanwhile, Jakarta’s CBD offices remain subdued under a 34% vacancy cloud, growing only 4.8% through 2031. Retail properties sit in between, with a 5% trajectory contingent on experiential upgrades. Data-center shells and industrial parks, grouped in “Other,” carry a 5.7% growth outlook thanks to the IKN build-out and data-sovereignty rules that favor onshore hosting. ESR Indonesia’s USD 148 million pickup of three LOGOS assets in 2024 shows blue-chip capital chasing stabilized logistics clusters.
By Business Model: Rental Push Gains Traction Amid Balance-Sheet Discipline
The sales model still comprised 72.2% of the Indonesian real estate market in 2025, reflecting an entrenched home-ownership culture reinforced by VAT exemptions. However, rental income streams are forecast to clock a 6.84% CAGR, the fastest among business models, as corporates value flexibility over heavy capex. Triple-net industrial leases now stretch to 15 years, offering inflation protection and attracting pension-fund money.
Build-to-rent towers in Jakarta and Surabaya cater to millennials who resist 15-year mortgages, while Pakuwon Jati’s digital platform lowered tenant-acquisition friction by 30%, proving technology’s leverage. Developers increasingly structure hybrid projects—selling strata apartments up front yet retaining retail podiums and serviced units—to balance immediate cash with steady lease yields. The sales pathway still grows 5.5% annually but faces margin compression from capped price bands.
By End-User: Corporate and SME Segment Accelerates on Pre-Leasing Demand
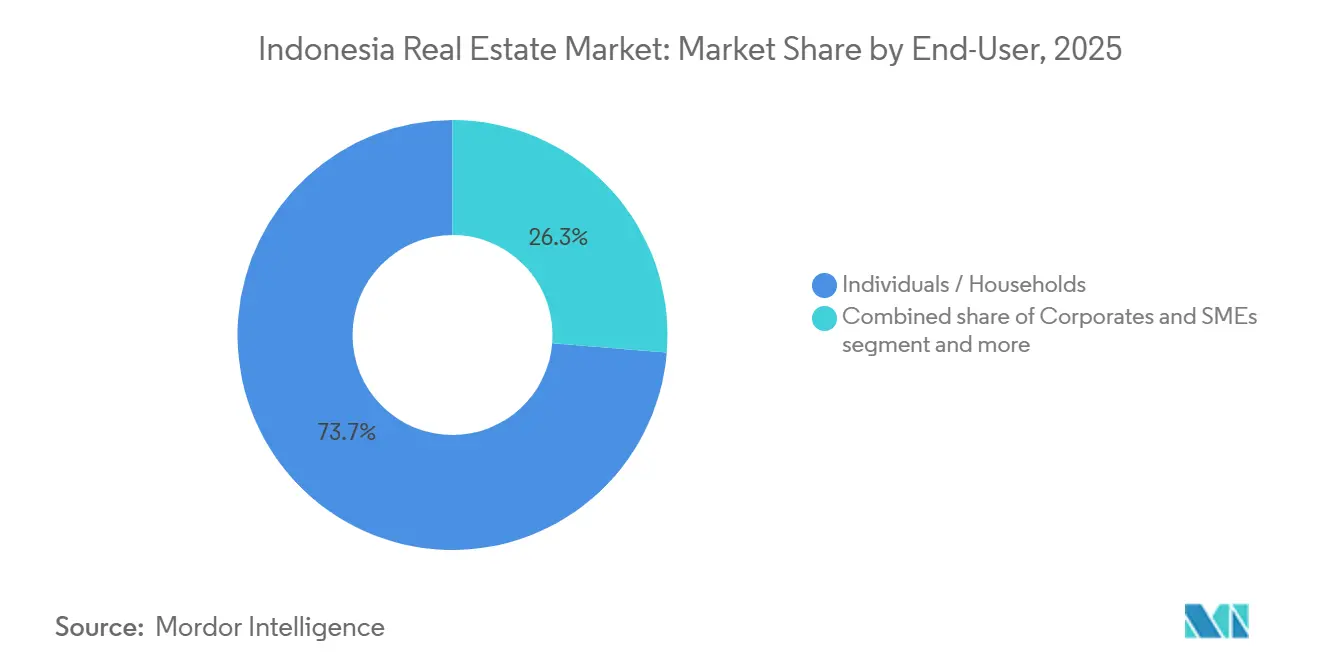
Individuals and households delivered 73.7% of Indonesia's real estate industry demand in 2025, yet their 5.4% CAGR lags the market. Corporates and SMEs, though a smaller slice, are positioned for a 6.71% CAGR as manufacturers bulk-lease factories and office floors ahead of relocation timelines.
Average logistics lease sizes halved from 5,000 m² in 2022 to 2,500 m² in 2025, illustrating SMEs’ quest for agility. LG Energy Solution negotiated master leases for thousands of worker-housing units, providing developers with early cash flow and off-take certainty. Government entities under “Other” will keep expanding at 5.8% as the IKN relocation rolls forward.

Geography Analysis
DKI Jakarta commands 39.4% of Indonesia's real estate market share in 2025, yet its 5.3% CAGR to 2031 shows the city is maturing rather than expanding. A 34% office‐vacancy rate and chronic congestion weigh on fresh supply, even as premium CBD towers sustain 80% occupancy and co-living conversions yield 8-10% unlevered returns. Bank Indonesia reported that primary home sales fell only 1.29% year over year in Q3 2025 after VAT subsidies steadied affordability. Logistics remains Jakarta’s bright spot: net absorption above 100,000 m² per quarter pushed warehouse vacancy to 5.9% and compressed yields to 7-7.5%. As a result, investors now treat Jakarta as a cash-flow center rather than a high-growth bet.
West Java is a major contributor to Indonesia's real estate market in 2025 and is expanding at a 6.2% CAGR through 2031, leveraging the Jakarta-Bandung high-speed rail and “China + 1” manufacturing inflows. ESR Indonesia’s 216,864 m² parks in Cikarang and Karawang were 90% pre-leased to EV-component suppliers on 10- to 15-year terms, illustrating how long leases underpin bond-like cash flows. Land within a 5 km radius of Bandung’s Tegalluar station rose 20% after rail launch, while sub-USD 67,000 townhouses in Bekasi and Tangerang absorb commuter demand despite 60-90-minute travel times. East Java is another key market in 2025 and leads growth at a 7.11% CAGR through 2031 on port access, lower land costs, and 82% land-title certification that cuts due diligence cycles. Surabaya’s average buy price of USD 160,685 and 6.47% rental yields continue to draw investors priced out of Jakarta’s sub-5% cap rates.
The Rest of Indonesia is projected to grow at a 6% CAGR through 2031, driven by IKN Nusantara and tourism hotspots. Kalimantan’s new capital budget has unlocked plots around Balikpapan and Samarinda, where Sinar Mas Land secured a 1,500-unit civil servant housing contract. Bali’s hotel-permit freeze redirected capital to Lombok and Labuan Bajo, yet only 60% of coastal plots in Kalimantan and 50% in Papua are certified, adding 18-24 months to project timelines. Developers with patient capital and strong local partners can still capture double-digit returns, but they must budget higher legal and infrastructure contingencies to navigate title complexity and policy variability.
Regulatory Landscape
Indonesia real estate activity is shaped by central housing and public-works regulations, alongside land-administration reforms led by the Ministry of Agrarian Affairs and Spatial Planning/National Land Agency (ATR/BPN). In April 2026, the Ministry of Housing and Settlements (Kementerian Perumahan dan Kawasan Permukiman, PKP) issued Permen PKP 2/2026, amending Permen PKP 9/2025 on financing facilitation for low-income communities, including a processing cost subsidy (Subsidi Biaya Proses) for low-income vertical housing (sarusun umum). The same month, Permen PKP 4/2026 amended the implementation rules for housing construction assistance and special housing provision, tightening administrative requirements and shifting program processing toward centralized digital systems.
On the infrastructure delivery side, the Ministry of Public Works (Kementerian Pekerjaan Umum, PU) socialized Permen PU 1/2026 in April 2026. The update changed procedures for KPBU (government-business cooperation/PPP) in public-works infrastructure and replaced the prior framework under Permen PUPR 2/2021. In parallel, ATR/BPN has been expanding electronic land services, including electronic certificates and electronic transfers, with a stated target of fully digital land services by 2028. For developers operating across provinces with uneven local permitting capacity, that modernization links directly to execution risk and due diligence timelines.
Value Chain Analysis
The Indonesia real estate value chain begins with land sourcing and due diligence (ATR/BPN registration, certification, and local spatial/zoning clearances), then moves to project financing (bank lending, presales for sales-led housing, and long leases for income assets). Development and construction follow, involving developers, EPC contractors, and subcontractors, before projects are commercialized through sales and leasing channels (brokers, in-house sales teams, and increasingly digital leasing platforms). Government programs influence both demand and supply, with low-income housing support and incentives stimulating absorption, while public-works pipelines such as roads and bridges create new development corridors that concentrate contractor capacity and labor.
Inputs and execution also depend on construction materials and equipment availability, where public projects drive standardization and domestic sourcing through national databases for materials and equipment used in government works, including IKN-related projects. The midstream is increasingly shaped by institutional partnerships in logistics and industrial real estate, as reflected in the July 2026 ESR and MC Urban Development Indonesia (MCUDI) joint development agreement for two institutional-grade logistics and industrial facilities in Karawang and Cikarang, with total asset value exceeding USD 80 million. This reinforces how pre-leasing and investment-grade specifications affect underwriting for new supply. Downstream, connectivity-led development models are becoming more visible in urban corridors, including transit-oriented residential and mixed-use projects such as Summarecon Agung's July 2026 Ivora Grande launch in Summarecon Bandung tied to the Whoosh high-speed rail station, supporting faster absorption through access-driven site selection.
Competitive Landscape
Indonesia's real estate market competition is moderate, with the top 10 developers capturing roughly 35-40% of national sales. Conglomerates like Sinar Mas Land, Ciputra, and Lippo integrate land banking, construction, and finance to retain scale advantages. Specialist players—ESR for logistics, Perumnas for affordable housing—leverage joint-venture capital to raid niche pockets. The strategic race centers on securing certified land in growth corridors, harnessing digital platforms to cut leasing costs, and retaining income-yielding assets for future REIT spin-offs.
Recent high-profile moves illustrate these themes. ESR Indonesia pre-leased nearly its entire 2025 pipeline before completion by mining tenant data analytics, while Agung Podomoro’s USD 16 billion PIK 2 township fuses residences with a convention center and potential Formula 1 circuit. Sinar Mas Land and K2 Data Centres plan a 58.8 MW campus in Kota Deltamas, signaling a tilt toward digital infrastructure. Meanwhile, PT Bumi Serpong Damai’s The Zora BSD City illustrates the pivot from price-capped affordable units to lifestyle-rich mid-market condos.
Competition is fiercest in low-income housing where government price caps leave single-digit margins, prompting volume plays and rigid cost control. In logistics, access to investment-grade tenants determines financing terms; long leases unlock cheaper debt and smoother REIT exits, leaving land-rich but tenant-poor owners at a disadvantage. Adaptive-reuse specialists are emerging to repurpose surplus office floors into co-living suites, exploiting 500- to 700-basis-point yield spreads within central Jakarta. Technology thus acts as the key differentiator, rewarding data-driven site selection and digital tenant onboarding over traditional relationship brokering.
Indonesia Real Estate Industry Leaders
-
PT Intiland Development Tbk
-
Tokyu Land Indonesia
-
Agung Podomoro Land
-
Ciputra Group
-
Sinar Mas Land
- *Disclaimer: Major Players sorted in no particular order
Market Opportunities and Future Outlook
Policy-backed affordability levers and program funding create a clear whitespace for developers and financiers focused on mass-market and first-home demand. In 2026, the government increased the Housing Credit Program ceiling from Rp 36 trillion to Rp 50 trillion. The Ministry of Finance also set out a VAT incentive framework, including a 100% VAT borne by the government for eligible housing transactions up to Rp 2 billion (for houses priced up to Rp 5 billion) across the 2026 fiscal year. Together, these measures support opportunities for standardized, fast-delivery product formats, including vertical low-income housing supported by Permen PKP 2/2026, while also emphasizing supply-chain readiness to handle construction-cost pressure.
A second opportunity set is in location-led, infrastructure-adjacent formats where public-works delivery improves access and expands investable micro-markets beyond core Jakarta. Connectivity projects such as the stated 5,000-bridge target by end-2026 and the Inpres Regional Road program handling 1,151 km of roads support land development in secondary nodes that previously faced access constraints. Digitization of permitting and land administration also creates an opening for proptech-enabled transaction and project monitoring workflows. With ATR/BPN working toward fully digital land services by 2028 and 2026 PKP regulations formalizing digital processing for housing assistance, developers and solution providers have a clearer path to scaling compliance-ready digital documentation, verification, and project reporting.
Recent Industry Developments
- July 2026: ESR and MC Urban Development Indonesia (MCUDI) announced a joint development agreement for two institutional-grade logistics and industrial facilities in Karawang and Cikarang, West Java, with a total asset value exceeding USD 80 million. The move adds scale to modern warehouse supply in the core manufacturing corridor and reinforces the market shift toward pre-leased, investment-grade logistics formats backed by institutional capital.
- June 2026: The Government of Indonesia increased the 2026 Housing Credit Program ceiling from Rp 36 trillion to Rp 50 trillion. The higher program envelope strengthens the financing channel for mass-market housing and supports developers and lenders targeting first-home and affordability-linked segments.
- February 2025: ESR Indonesia and Mitsubishi-INA handed over three West Java logistics parks totaling 216,864 sq m with around 90% pre-leases. High pre-commitment at completion highlighted tenant-led underwriting and helped tighten vacancy in the Greater Jakarta industrial belt, supporting additional build-to-suit and long-lease development pipelines.
Research Methodology Framework and Report Scope
Market Definition and Coverage
For this report, the market is defined as the yearly gross value generated in Indonesia from completed properties that are either sold or formally leased, converted into USD using average annual exchange rates.
Scope exclusions: Land only transactions without standing structures, and informal rental arrangements that are not captured through formal leasing, are excluded from the sizing.
Segmentation Overview
- By Business Model
- Sales
- Rental
- By Property Type
- Residential
- Apartments & Condominiums
- Villas & Landed Houses
- Commercial
- Office
- Retail
- Logistics
- Others (industrial, hospitality, etc.)
- Residential
- By End-user
- Individuals / Households
- Corporates & SMEs
- Others
- By Region
- DKI Jakarta
- West Java (Jawa Barat)
- East Java (Jawa Timur)
- Rest of Indonesia
Data Sources, Market Sizing, and Validation
Desk Research
Desk research was used to set the factual base for the model and to keep assumptions anchored to Indonesia specific signals. We referenced public sources such as Statistics Indonesia (BPS) for construction and housing related series, Bank Indonesia for macro indicators and lending conditions, the Ministry of Public Works and Housing for housing program direction, and the Financial Services Authority (OJK) for mortgage and banking disclosures.
We also reviewed listed developer disclosures, annual reports, investor presentations, and reputable press coverage to understand project completions, occupancy trends, and pricing commentary across major cities. Where it was helpful, we used paid subscriptions for company financials and intelligence, news and financials, and shipment level import and export context for select building inputs to sanity check construction activity. These desk research sources are illustrative only, and many other public materials were used during data collection and validation.
Primary Interviews and Surveys
Primary work was used to validate how transactions and leases are recorded in practice, and to close gaps that public datasets do not explain well. We spoke with a mix of developers, brokers, property managers, lenders, and institutional buyers, and the discussion covered demand conditions across key islands with a practical lens on Jakarta and other high activity urban areas.
Distribution of primary research fieldwork respondents
| Company type | Respondent position |
|---|---|
| Top tier: 26% | CXOs: 12% |
| Mid tier: 58% | Functional/Unit leaders: 32% |
| Smaller Players: 16% | Managers: 56% |
Market-Sizing & Forecasting
Sizing started with a top-down build that reconstructs annual market value from Indonesia real estate activity, where the demand pool is tied to completed property supply and the value realized through sales or formal leases. The totals were then cross-checked through selective bottom-up approximations, like sampled price per square meter times transacted area for key cities, plus channel checks on absorption and typical lease terms, which helped adjust for over or under statements.
Inputs used in the model included indicators such as residential and commercial price movements in major metros, construction completions and permits as a proxy for delivered stock, mortgage rate direction and housing credit growth, occupancy and vacancy signals for income producing assets, and rupiah to USD average annual conversion to keep year to year values comparable. When data was thin for a sub-market, a gap was handled through ranges agreed in interviews, and then narrowed using observable macro and construction signals.
For forecasting, scenario analysis was applied around interest rates, credit availability, and completion pipelines, and then a regression based view was used to relate market value to urban demand and financing conditions. Assumptions were reviewed with primary respondents so the slope of recovery or slowdown matched what was being seen in active deals.
Data Validation & Update Cycle
Outputs were validated through triangulation across independent signals, including property price direction, delivered supply trends, mortgage growth, and developer booking commentary, and then checked for year to year jumps that did not match the real economy. If a variance looked high, we rechecked inputs, revisited currency timing, and in some cases re-contacted experts to confirm whether a one-off event or reporting change was involved.
A multi step internal review is followed before sign-off, where assumptions, math, and year mapping are independently checked. Reports are refreshed annually, and interim updates are made when material events occur that can shift demand or supply. Before delivery, a final update pass is completed so clients receive the latest view available at that time.
Mordor Intelligence's Indonesia Real Estate Market Size Compared Against Other Published Estimates
Published market values for Indonesia real estate do not always match because different studies count different things, and they also time currency conversion and completion recognition in their own ways. Some estimates are closer to an economic sector view, while others behave more like an asset value pool, which makes the numbers look far apart.
The benchmark table shows a wide spread mainly because some sources mix in land value, future pipeline value, or broader real estate activities beyond completed properties, and they may not explain whether figures are based on sales, leases, or sector gross value added. In Mordor Intelligence's model, the value is tied to completed residential, commercial, retail, hospitality, and light-industrial properties that are sold or formally leased, and land only speculation is left out, which keeps the series aligned to realized transactions.
Benchmark comparison
| Source | Market Size | Gaps in Research Methodology |
|---|---|---|
| Mordor Intelligence | USD 66.44 B (2025) | |
| Global Consultancy A | USD 169.90 B (2025) | The estimate appears to use a broader value pool that can include land, ownership related value measures, and wider real estate business activities, and the scope notes do not clearly isolate completed properties sold or formally leased. |
| Trade Publisher B | USD 33.81 B (2023) | This figure is closer to an economic contribution measure (sector gross value added), which is not the same as transaction and lease value, and it typically excludes parts of real estate value captured in sales and formal leasing totals. |
Across the three figures, the main takeaway is that scope and what gets counted as value drive most of the difference, not simple math errors. By keeping inclusions tied to completed property sales and formal leases, and by applying consistent annual currency conversion and interview led checks, our result remains traceable to clear inputs that can be reviewed and repeated over time.
Key Questions Answered in the Report
What is the current value of the Indonesia real estate market?
The Indonesia real estate market size is USD 70.37 billion in 2026 and is projected to reach USD 93.75 billion by 2031.
Which property type is growing fastest in Indonesia?
Logistics property is the fastest-growing category, forecast to expand at a 6.49% CAGR through 2031 as manufacturers and e-commerce firms pre-lease modern warehouses.
Why is East Java attracting real estate investors?
East Java combines lower land prices, port access, and tax incentives, giving it the highest regional CAGR at 7.11% and rental yields around 6.5%, which outperform Jakarta.
How are interest rates affecting Indonesian developers?
Lending rates near 9-11% and construction-cost inflation are pushing developers to rely on pre-sales, modular construction, and long-term rentals to protect margins.
What role do REITs play in Indonesian property financing?
REITs provide a lower-cost capital exit for developers, and recent regulation plus proptech integration have opened fractional ownership to retail investors, widening the funding pool.
How is the “China + 1” strategy influencing Indonesian real estate?
Chinese manufacturers shifting production to Indonesia are signing 10- to 15-year leases for factories and worker housing, tightening warehouse supply and lifting yields to 7-7.5%.