
Market Overview
| Study Period | 2021 - 2031 |
|---|---|
| Forecast Data Period | 2026 - 2031 |
| Base Year Market Size (2025) | USD 7.21 Billion |
| Market Size (2026) | USD 7.64 Billion |
| Market Size (2031) | USD 10.2 Billion |
| Growth Rate (2026 - 2031) | 5.92 % |
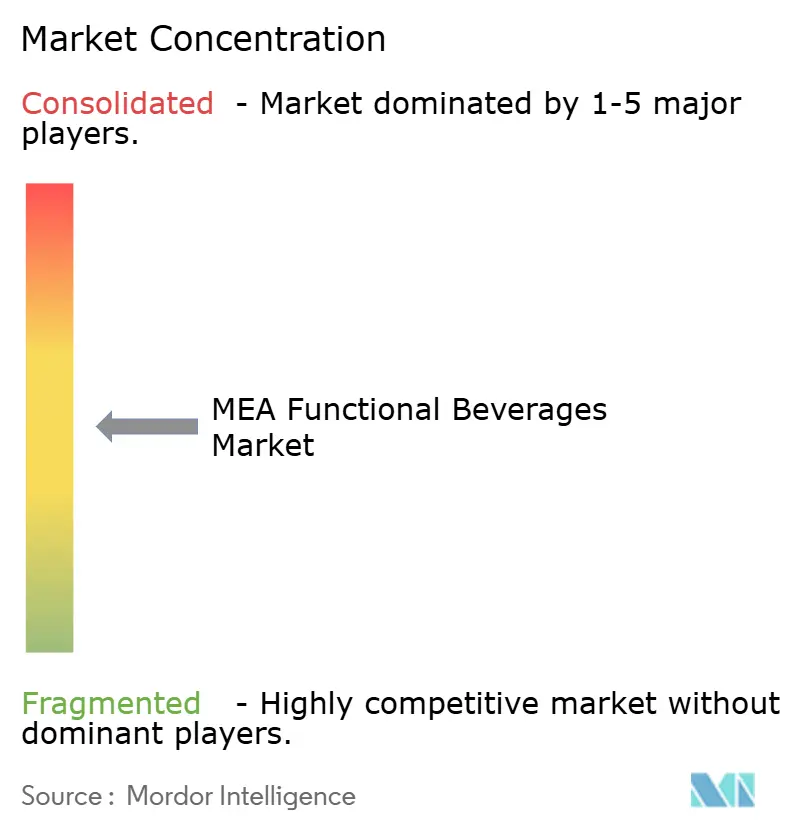
| Market Concentration | Medium |
Major Players
*Disclaimer: Major Players sorted in no particular order Image © Mordor Intelligence. Reuse requires attribution under CC BY 4.0. |
|
MEA Functional Beverages Market Analysis by Mordor Intelligence
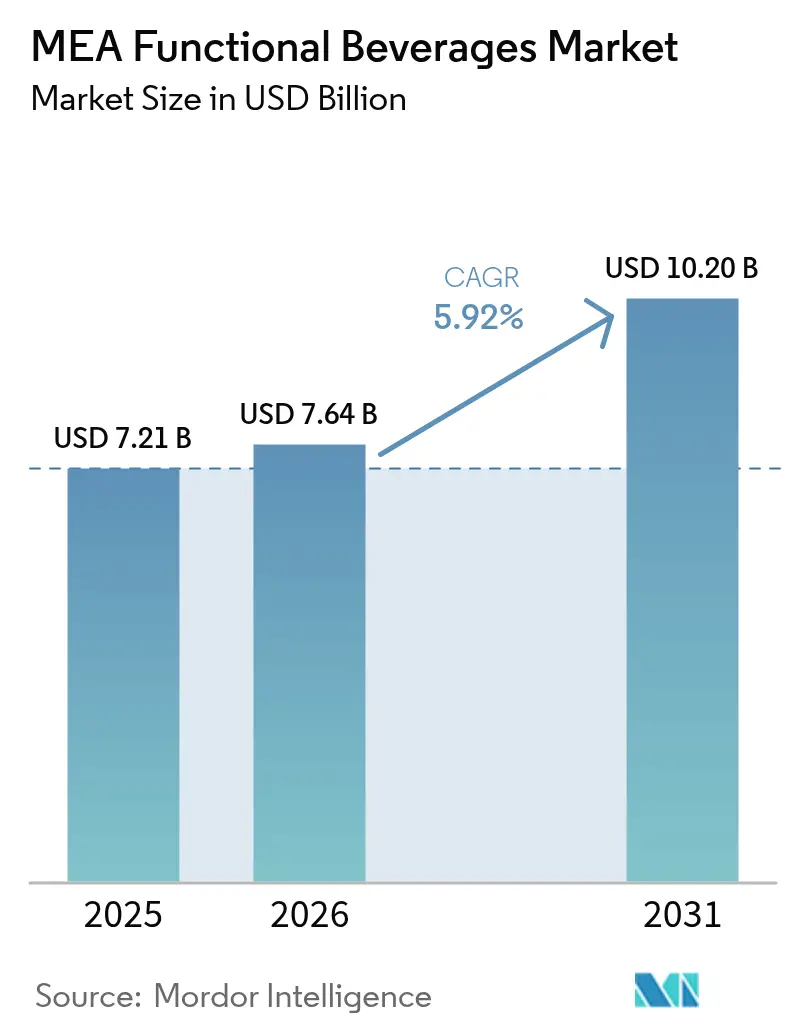
The Middle East and Africa functional beverages market size was valued at USD 7.21 billion in 2025 and estimated to grow from USD 7.64 billion in 2026 to reach USD 10.2 billion by 2031, at a CAGR of 5.92% during the forecast period (2026-2031). Multiple factors drive this market growth, including increased consumer demand for beverages that provide health benefits beyond basic nutrition. The region's rising health consciousness, influenced by the prevalence of lifestyle diseases like obesity and diabetes, has led consumers to choose beverages that support immunity, weight management, fitness, and wellness. The market expansion is also supported by demographic changes, including urbanization, a growing middle class, and a young population. The market's development is further enhanced by packaging advancements in cans and PET/glass bottles, alongside improved distribution through online retail channels. Government initiatives promoting healthy lifestyles and economic diversification in various countries provide additional support for the functional beverages market growth.
Key Report Takeaways
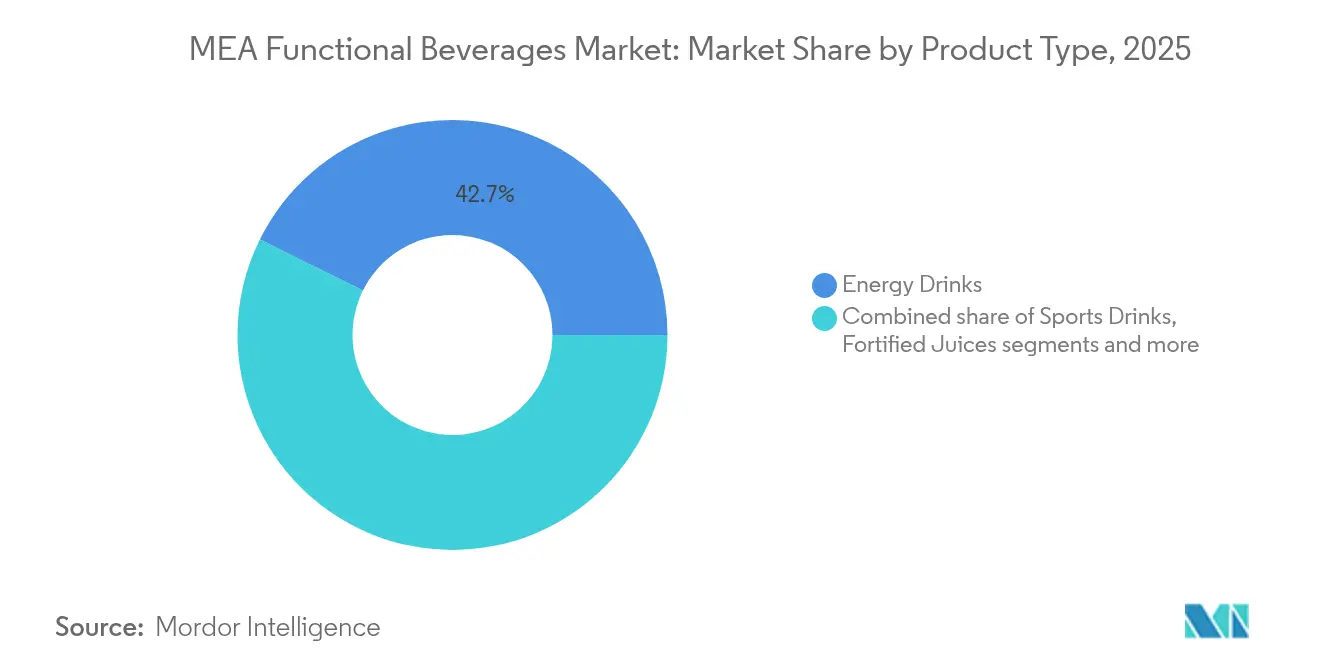
- By product type, energy drinks held 42.68% of the Middle East and Africa functional beverages market share in 2025, whereas protein-based drinks are projected to expand at a 6.58% CAGR through 2031.
- By packaging type, PET/Glass bottles accounted for 51.02% of the Middle East and Africa functional beverages market size in 2025, while cans are set to record the fastest 6.74% CAGR through 2031.
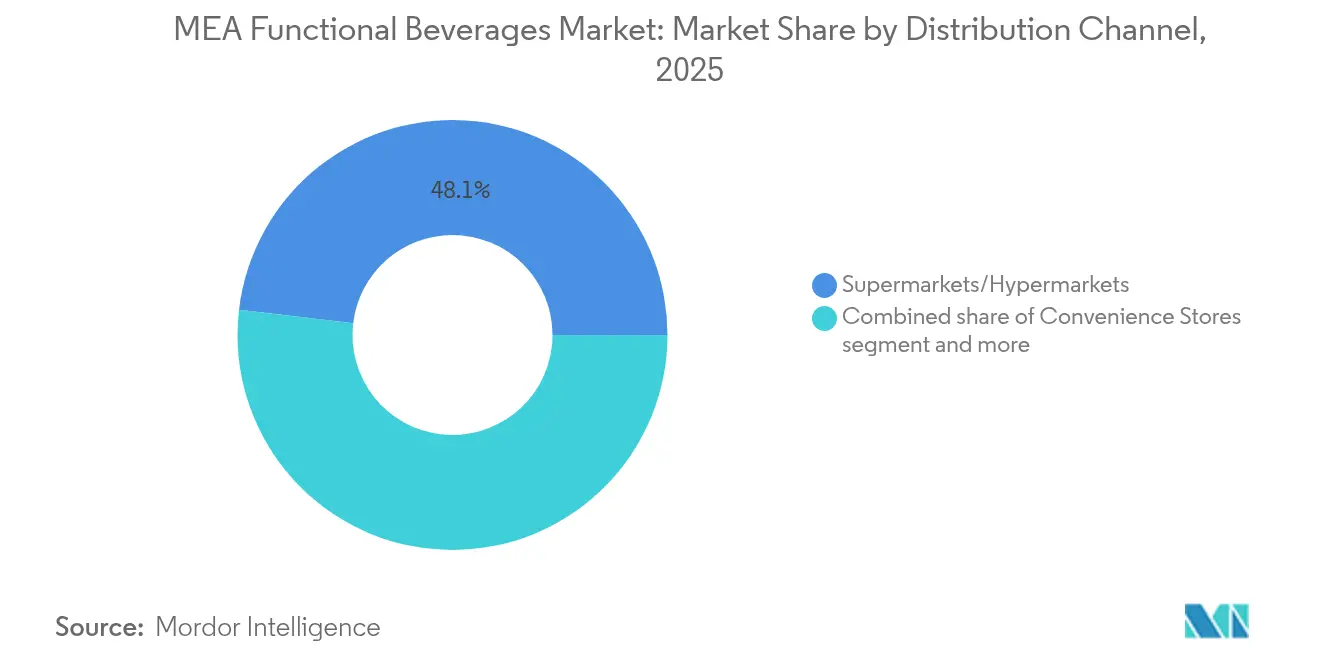
- By distribution channel, supermarkets/hypermarkets secured 48.12% revenue share in 2025, yet online retailers are advancing at an 7.62% CAGR to 2031.
- By geography, Saudi Arabia commanded 23.05% of the Middle East and Africa functional beverages market share in 2025; Nigeria leads growth with a 6.93% CAGR between 2026-2031.
Note: Market size and forecast figures in this report are generated using Mordor Intelligence’s proprietary estimation framework, updated with the latest available data and insights as of 2026.
Market Trends and Insights
Drivers Impact Analysis of MEA Functional Beverages Market*
| Driver | (~) % Impact on CAGR Forecast | Geographic Relevance | Impact Timeline |
|---|---|---|---|
| Growing health awareness and rising obesity rate | +1.8% | Global, strongest in Saudi Arabia and the United Arab Emirates | Medium term (2-4 years) |
| Halal-certified functional formulations gaining traction | +1.2% | Global, particularly Egypt and Nigeria | Long term (≥ 4 years) |
| Sports and fitness culture expansion | +1.0% | Saudi Arabia, the United Arab Emirates, and Turkey | Medium term (2-4 years) |
| Convenience and on-the-go demand | +0.9% | Urban centers across all markets | Short term (≤ 2 years) |
| Technological advancements in formulation and packaging | +0.7% | Global, led by developed markets | Long term (≥ 4 years) |
| Cultural openness to wellness and global trends | +0.6% | GCC countries, urban Nigeria | Medium term (2-4 years) |
| Source: Mordor Intelligence | |||
Growing Health Awareness and Rising Obesity Rate
The Middle East and Africa functional beverages market is primarily driven by increasing health awareness and rising obesity rates across the region. Consumers are seeking products that offer both refreshment and functional benefits, including weight management, improved metabolism, and disease prevention. This health consciousness is increasing the demand for beverages fortified with vitamins, minerals, proteins, and other beneficial ingredients that address specific nutritional requirements and support healthy lifestyles. According to the World Obesity Federation, as of 2024, over two-thirds of South African women, 30% of men, and a significant proportion of children are experiencing obesity or overweight conditions, presenting a major public health challenge [1]Source: World Obesity Federation, "WOD 2024: Uniting to address obesity in South Africa", www.worldobesity.org. This high prevalence of obesity has increased consumer awareness about nutrition and lifestyle choices, driving a shift from traditional sugary beverages to healthier functional alternatives.
Halal-certified functional formulations gaining traction
Halal certification has become a significant growth driver in the Middle East and Africa functional beverages market. The certification ensures functional beverages comply with religious dietary requirements, building consumer trust and acceptance. Beyond religious compliance, halal certification indicates quality, safety, and ethical sourcing practices, meeting consumer demands for transparent and authentic health products. Companies increasingly use halal certification as a market differentiator to align with regional cultural and religious preferences. For example, iPRO entered the Saudi Arabian market in February 2025 through a partnership with Al Rabie, a trusted regional brand. The iPRO Hydrate products display the Al Rabie logo and carry halal certification, demonstrating religious compliance and strengthening consumer confidence. This strategic approach shows how companies use localized, culturally aligned formulations to expand their presence in the Middle East and Africa functional beverages market.
Sports and Fitness Culture Expansion
The growth of sports and fitness culture significantly drives the Middle East and Africa functional beverages market. The increasing adoption of active and health-conscious lifestyles has elevated the demand for functional beverages that support athletic performance, hydration, recovery, and wellness. The rising gym memberships, fitness activities, and sports participation in the region boost the consumption of sports drinks, protein-based beverages, and electrolyte-infused formulations that meet athletes' and fitness enthusiasts' nutritional requirements. The Department of Community Development reported that Abu Dhabi hosted 145 sports and community events in 2024, attracting participants from 122 nationalities [2]Source: Department of Community Development, "53% of Abu Dhabi residents now meet WHO’s recommended activity levels", https://addcd.gov.ae. The number of participants in these events increased by 33% compared to 2023, demonstrating substantial growth in community engagement and fitness activities. This expansion in sports and recreational activities presents opportunities for functional beverage manufacturers to serve consumers seeking hydration, performance enhancement, and recovery solutions.
Convenience and on-the-go demand
The expansion of the Middle East and Africa functional beverages market is primarily attributed to convenience requirements and mobile consumption patterns. The region's progressive urbanization and contemporary lifestyle dynamics have generated increased consumer demand for functional beverages that seamlessly integrate into established daily protocols. Ready-to-drink (RTD) formulations, transportable packaging configurations, and efficient consumption mechanisms deliver nutritional advantages while addressing mobility prerequisites. Professional demographics, academic populations, and metropolitan consumers demonstrate particular affinity for these expedient health-optimization solutions. The availability of functional beverages in single-serve formats such as bottles, cans, and small tetra packs enhances portability and consumption ease, making them ideal for consumption during commutes, workouts, or work breaks. Manufacturing entities are implementing strategic initiatives to develop packaging solutions that optimize product longevity and functional utility while maintaining the integrity of beverage formulations.
Restraints Impact Analysis of MEA Functional Beverages Market*
| Restraint | (~) % Impact on CAGR Forecast | Geographic Relevance | Impact Timeline |
|---|---|---|---|
| Intense market competition | -1.1% | Global, particularly Saudi Arabia and the United Arab Emirates | Short term (≤ 2 years) |
| Stringent regulatory compliance | -0.8% | Egypt, Nigeria, the United Arab Emirates | Medium term (2-4 years) |
| High production and distribution costs | -0.7% | Nigeria, Morocco, emerging markets | Long term (≥ 4 years) |
| Awareness gaps and educational barriers | -0.5% | Rural areas, lower-income segments | Medium term (2-4 years) |
| Source: Mordor Intelligence | |||
Intense Market Competition
The Middle East and Africa functional beverages market faces growth constraints due to intense competition among diverse market participants. The market comprises global corporations competing with local and regional companies. This competitive environment creates downward pressure on prices, accelerates innovation requirements, and demands significant marketing investments, making market entry and growth difficult for smaller companies. Established companies leverage their advantages in brand recognition, distribution networks, and financial resources to maintain market position through promotional activities and frequent product launches. The market's saturation with similar products challenges differentiation efforts, requiring companies to increase research and development investments for creating distinctive formulations that meet changing consumer needs. This competitive environment affects profit margins and market expansion, particularly for companies without sufficient scale or resources.
Stringent Regulatory Compliance
Regulatory compliance presents a significant challenge for the market, as manufacturers and distributors must meet strict standards across different countries. Government agencies enforce detailed requirements for product registration, safety assessments, ingredient approvals, and labeling to protect consumers. The varying regulations between countries create a complex compliance environment that affects market entry and expansion. For instance, Nigeria's National Agency for Food and Drug Administration and Control (NAFDAC) requires extensive documentation, facility inspections, and specific labeling protocols that often differ from international standards. These requirements increase operational costs, cause delays, and add administrative work for companies launching functional beverage products in Nigeria. Companies must invest considerable resources and expertise to navigate these diverse regulatory requirements, which impact product launches and innovation timelines.
*Our forecasts treat driver/restraint impacts as directional, not additive. The impact forecasts reflect baseline growth, mix effects, and variable interactions.
MEA Functional Beverages Market Segment Analysis
By Product Type:
Energy Drinks Lead Despite Protein SurgeIn 2025, energy drinks maintained a firm hold on the Middle East and Africa functional beverages market, commanding a 42.68% market share, establishing their position as the leading product type in the region. This dominance stems from a strong appeal among diverse consumers, particularly younger demographics seeking immediate energy boosts and enhanced mental and physical performance. The rapid lifestyle changes in the region have increased demand for convenient, ready-to-consume energy beverages that provide quick revitalization during busy routines. Energy drinks also benefit from their association with improved focus, stamina, and alertness, aligning with consumer demands for enhanced productivity and active lifestyles.
Protein-based drinks are emerging as the fastest-growing segment in the Middle East and Africa functional beverages market, with a projected CAGR of 6.58% through 2031. This growth is driven by health, lifestyle, and demographic trends. The increasing consumer focus on fitness and body aesthetics has generated strong demand for convenient, high-protein nutrition formats, including ready-to-drink (RTD) protein shakes and fortified beverages. The growing adoption of plant-based and alternative protein sources within protein drinks reflects consumer preferences for clean-label, natural, and sustainable products. Formulation innovations using whey, pea protein, soy, and collagen have expanded the appeal of protein-based drinks to a broader demographic, including vegetarians, elderly consumers, and wellness-focused individuals.



By Packaging Type:
Sustainability Drives Can AdoptionPET and glass bottles dominate the market with a 51.02% share in 2025, driven by established consumer acceptance and proven performance. PET bottles are preferred for their durability, light weight, and cost-effectiveness, particularly in mass-market functional beverages. These containers offer practical benefits, including easy handling, resealability, and broad retail distribution compatibility. Glass bottles maintain their position in premium segments, benefiting from quality perception, chemical inertness for product preservation, and recyclability. The transparent nature of glass enhances consumer confidence by allowing product visibility. Both PET and glass bottles demonstrate versatility across the functional beverage spectrum, from fortified juices to protein drinks and fermented beverages.
Cans represent the fastest-growing packaging format in the Middle East and Africa functional beverages market, with a projected CAGR of 6.74% through 2031. This growth stems from their preservation capabilities, which ensure extended shelf life and maintain the efficacy of active ingredients in functional beverages. Metal cans provide convenience through their lightweight design and portability, making them suitable for on-the-go consumption. Their high recyclability and reduced carbon footprint compared to alternative packaging materials appeal to environmentally conscious consumers and support global plastic waste reduction initiatives.
By Distribution Channel:
E-commerce Disrupts Traditional RetailIn 2025, supermarkets and hypermarkets dominated the distribution landscape of the Middle East and Africa functional beverages market, holding 48.12% market share. These retail channels maintain their leading position through extensive reach and accessibility across urban and semi-urban areas. Supermarkets and hypermarkets offer consumers a one-stop shopping experience with diverse functional beverage options under one roof. Their organized shelving, promotional activities, and in-store marketing increase product visibility and consumer engagement. These outlets also maintain strong relationships with manufacturers and distributors, ensuring efficient supply chain management and product availability.
Online retailers are becoming the fastest-growing distribution channel for functional beverages in the Middle East and Africa, with a projected CAGR of 7.62% through 2031. This growth stems from increased internet penetration, smartphone usage, and consumer preference for digital shopping platforms that offer convenience, variety, and competitive pricing. Enhanced logistics infrastructure and e-commerce platforms have expanded the accessibility of online retail. According to the Communications, Space and Technology Commission, Saudi Arabia achieved 99% internet penetration in 2024, with 93.1% of online shopping occurring on local websites, indicating strong consumer trust in regional e-commerce platforms .
Geography Analysis
Saudi Arabia Functional Beverages Market
Saudi Arabia holds a 23.05% market share in the Middle East and Africa functional beverages market in 2025, driven by Vision 2030's economic diversification strategy. The strategy supports increased consumer spending, innovation, and modernization, contributing to the demand for health-focused products. Government health initiatives focusing on wellness and disease prevention have created a framework supporting functional nutrition adoption. The implementation of a 50% tax on sugar-sweetened beverages has accelerated consumer transition toward healthier, premium alternatives. Functional beverages, offering specific health benefits, command premium prices that match regional consumers' increased focus on wellness and nutrition.
Nigeria Functional Beverages Market
Nigeria's functional beverages market is expected to grow at a 6.93% CAGR through 2031. This growth stems from urban development, expanding middle-class populations, and health sector reforms emphasizing nutrition and wellness. The combination of urbanization and increased health awareness among Nigeria's young population drives functional beverage demand. Enhanced healthcare infrastructure and public education initiatives strengthen consumer confidence in specialized nutrition products, positioning Nigeria as a significant market for functional beverage manufacturers.
MEA and Turkey Functional Beverages Market
The United Arab Emirates, Egypt, Morocco, and Turkey represent established functional beverage markets with distinct characteristics. The United Arab Emirates' diverse consumer base and robust retail infrastructure support growth through premium products and innovation. Egypt offers scale opportunities through its large population base, despite regulatory complexities. Morocco's market reflects a blend of traditional preferences and health awareness, while Turkey demonstrates demand for diverse and advanced products. Success in these markets requires strategies aligned with local regulations, cultural preferences, and market competition.
Regulatory Landscape
Regulatory oversight for MEA functional beverages is driven by national food safety authorities, with the GCC Standardization Organization (GSO) harmonizing technical requirements across member states. GSO standards, including GSO 18:2022 for non-alcoholic carbonated beverages, shape formulation and labeling expectations throughout the GCC, while the UAE Federal Law No. 10 of 2015 sets the food safety framework and reinforces compliance obligations around safe ingredients, labeling, and traceability.
Energy drinks face additional scrutiny in key markets. In Saudi Arabia, the SFDA applies mandatory pre-registration and sets caffeine ranges of 14.5 mg/100 ml to 32 mg/100 ml, supported by labeling controls for stimulant content. In Africa, South Africa updated Regulations relating to the use of Food Additives in Foodstuffs (Government Gazette 51499), effective November 2024, tightening the compliance checklist for manufactured beverages and affecting ingredient selection and claims substantiation for functional formulations.
Competitive Landscape
The Middle East and Africa functional beverages market shows moderate fragmentation, with competition intensifying between global industry leaders and local specialists. Major multinational companies, including Nestlé S.A., PepsiCo Inc., The Coca-Cola Company, Monster Beverage Corporation, and Danone S.A., maintain significant market presence through their established distribution networks and brand recognition. Local players are gaining ground by targeting specific market segments with customized products that address regional consumer preferences.
Companies prioritize localization strategies to align with the region's cultural and religious requirements. Obtaining halal certification is essential for building consumer trust, while product development focuses on incorporating regional flavors and ingredients. Companies design marketing initiatives that align with local cultural values to strengthen brand connections and differentiate their products in the market.
Companies are expanding their digital presence through e-commerce platforms and omnichannel retail strategies to adapt to changing consumer shopping behaviors and provide seamless purchasing experiences. They use mobile apps, social media marketing, influencer partnerships, and virtual events to increase brand awareness and develop consumer communities across the region. In supply chain operations, blockchain technology enables product traceability, quality assurance, and halal certification compliance, addressing consumer demands for transparency and safety.
MEA Functional Beverages Industry Leaders
-
Nestlé S.A.
-
PepsiCo Inc.
-
The Coca-Cola Company
-
Danone S.A.
-
Monster Beverage Corporation
- *Disclaimer: Major Players sorted in no particular order
MEA Functional Beverages Market Companies Covered in this Report
- Nestle S.A.
- PepsiCo Inc.
- The Coca-Cola Company
- Monster Beverage Corporation
- Danone S.A.
- Red Bull GmbH
- Aujan Coca-Cola Beverages Company
- Lucozade Ribena Suntory
- Celsius Holdings Inc.
- Herbalife International of America Inc.
- Mutalo Group
- Kingsley Beverages
- Hell Energy
- Gorilla Energy
- Almarai Co.
- Yakult Honsha
- Viju Industries Nigeria Ltd.
- Sapporo Holdings
- Keurig Dr Pepper
- iPRO Sport Distribution Ltd.

Market Opportunities and Future Outlook
Localized manufacturing and capacity investments create room for brands to reduce lead times, manage cost-to-serve, and align formulations with local tastes and regulatory requirements. In May 2026, Abu Dhabi Refreshment Company signed a long-term land lease in Khalifa Economic Zones Abu Dhabi (KEZAD) to develop a beverage production facility with an investment of about AED 300 million, which indicates continued regional build-out that can support faster rollout of functional SKUs and packaging formats.
Manufacturing digitalization and automation also help maintain quality and traceability in functional beverages where active-ingredient dosing and labeling accuracy are tightly managed. In July 2026, UAE-based dairy manufacturer Hadaf Foods selected Rockwell Automation’s Plex Smart Manufacturing Platform to digitize production monitoring and operations, reflecting a broader shift toward connected factories that can strengthen batch control and reduce waste. Together, these moves support premiumization and faster omnichannel replenishment as online retail takes a larger share of route-to-market across urban MEA.
Recent Industry Developments in MEA Functional Beverages Market
- May 2026: Abu Dhabi Refreshment Company signed a long-term land lease in Khalifa Economic Zones Abu Dhabi KEZAD to develop a beverage production facility with an investment of about AED 300 million. The project indicates a strategic push to accelerate regional rollout of new SKUs and packaging formats.
- May 2025: The Coca-Cola Company introduced Charged, a strawberry-flavoured caffeinated energy drink, in South Africa in 500 ml cans with national distribution. The rollout expands Coca-Cola’s energy portfolio in a major African market and supports on-the-go consumption.
- November 2024: South Africa's Department of Health implemented updated Regulations relating to the use of Food Additives in Foodstuffs (Government Gazette 51499). The update tightened permissible additives and usage limits for beverages, influencing reformulation timelines and documentation requirements for functional beverage suppliers.


MEA Functional Beverages Market Report Scope and Research Methodology
Market Definition and Coverage
For this study, the market covers non-alcoholic beverages sold in the Middle East and Africa that are positioned with added health or performance benefits. We track these products in value terms at the point of sale to the trade.
Scope exclusions: Alcoholic drinks, plain bottled water, and standard soft drinks with no added functional claim are excluded from this sizing.
Segments Covered in This Report
-
By Product Type
- Energy Drinks
- Sports Drinks
- Fortified Juices
- Electrolyte Drinks
- Fermented Drinks
- Protein-Based Drinks
- Others
-
By Packaging Type
- PET/Glass Bottles
- Cans
- Tetra Packs
- Others
-
By Distribution Channel
- Supermarkets/Hypermarkets
- Convenience Stores
- Specialty Health Stores
- Online Retailers
- Other Distribution Channel
-
By Geography
- South Africa
- Saudi Arabia
- United Arab Emirates
- Nigeria
- Egypt
- Morocco
- Turkey
- Rest of Middle East and Africa
Data Sources, Market Sizing, and Validation
Desk Research
Desk work was used to map the demand pool and to set realistic guardrails around consumption, pricing, and channel reach across the region. Public sources such as national statistics offices, central bank inflation releases, customs and trade portals, and food standard regulators (label and fortification rules) helped us align the model with what is actually sold and how it is counted. We also used FAO food balance style data, industry association pages, and peer reviewed nutrition and public health journals to understand category definitions and adoption patterns.
On top of that, we reviewed company annual reports, investor decks, and trusted press coverage to capture route to market shifts, pack size trends, and recent product positioning. Where needed, we used paid subscriptions for company financials and news, plus an import and export shipment level database, to cross check trade flows and to avoid double counting when brands are produced outside the end market. The desk research sources listed here are only examples, and many other sources were also referred to for data collection, validation, and clarification during the study.
Primary Interviews and Surveys
Primary work focused on validating what qualifies as functional in local retail and on narrowing down price bands by pack format and channel. We spoke with manufacturers, distributors, retailers, and category specialists across key Middle East and African markets, so gaps from desk inputs could be closed and assumptions could be stress tested before finalizing the totals.
Distribution of primary research fieldwork respondents
| Company type | Respondent position |
|---|---|
| Top tier: 38% | CXOs: 19% |
| Mid tier: 42% | Functional/Unit leaders: 30% |
| Smaller Players: 20% | Managers: 51% |
Market-Sizing & Forecasting
Sizing starts from a top-down build where beverage spending and category splits are reconstructed using country level consumption indicators, retail structure, and trade signals that indicate how much functional product is likely to be absorbed. We then corroborate using selective bottom-up approximations, such as sampled brand and format price points multiplied by plausible volumes, along with distributor and retailer checks on mix by channel, before we adjust the totals.
Key inputs used for this market include functional subcategory mix shifts (energy, sports, fortified, and similar claims), urban retail penetration versus traditional trade, import dependence for finished drinks and key ingredients, price and pack size inflation, and consumer health trend intensity reflected through product launches and label focus. For forecasting, we mainly used scenario analysis supported by short ARIMA based trend lines on the strongest time series inputs. We then pressure tested the path with what industry contacts expect on pricing, promotions, and regulation tightening. Where country level gaps exist, we applied proxy indicators from similar markets and normalized using income levels and modern trade share, so outliers do not distort the regional roll up.
Data Validation & Update Cycle
Outputs are checked against independent signals such as import patterns, reported category growth commentary, and realistic price bands by channel. We investigate large variances until the driver is understood. A second analyst reviews assumptions and formulas, after which the story and numbers are aligned so the final view is consistent across countries and time. Reports are refreshed annually, and interim updates are done when material events happen, such as sudden tax changes, major regulation shifts, or sharp currency moves that can change value sizing. Right before delivery, we run a final pass to reflect the latest public releases and to confirm whether any new anomaly is corrected or clearly explained.
Mordor Intelligence's Middle East and Africa Functional Beverage Market Estimate Compared With Other Published Estimates
Published market values for functional beverages in the Middle East and Africa can vary even when the topic name looks the same. Differences usually come from what is counted as functional, whether the value is taken at retail or trade level, and how pricing and currency timing are treated across countries.
The main gap drivers in this market tend to be whether energy shots and nutraceutical style drinks are grouped together, whether informal and traditional trade is modeled or ignored, and whether the estimate uses an aggressive growth path that assumes rapid premiumization. Currency conversion choices also matter in this region, since sharp moves can inflate or deflate a USD value if the averaging period is not clearly stated.
Benchmark comparison
| Source | Market Size | Gaps in Research Methodology |
|---|---|---|
| Mordor Intelligence | USD 7.21 B (2025) | |
| Global Research Publisher A | USD 7.28 B (2025) | Uses a narrower functional drinks split that emphasizes energy and sports formats, which can under-represent fortified dairy style beverages and some wellness positioned juices in parts of Africa. |
| Syndicated Research Publisher B | USD 8.22 B (2024) | Relies on a different base year and a slower growth curve, and the scope is not fully transparent on whether value is retail-led or trade-led, which can shift totals in high margin modern retail markets. |
The table shows a tight cluster around 2025 for some sources but a higher 2024 figure for another. In Mordor Intelligence's model, the market is kept at a consistent trade value boundary across MEA, with country FX timing aligned to the same base year window. When scope and value point are made explicit, the remaining spread is usually explained by which functional formats are included and how informal trade and pricing uplift are treated, which also makes the estimate easier to replicate.


Key Questions Answered in the Report
What is the current value of the Middle East and Africa functional beverages market?
The market is valued at USD 7.64 billion in 2026.
Which product type sells the most across the region?
Energy drinks lead with 42.68% revenue share in 2025.
Which packaging format is growing fastest?
Aluminum cans are expanding at a 6.74% CAGR to 2031.
Which country shows the highest growth potential?
Nigeria is forecast to rise at a 6.93% CAGR through 2031.
Page last updated on:





