
Oman Agriculture Market Analysis by Mordor Intelligence
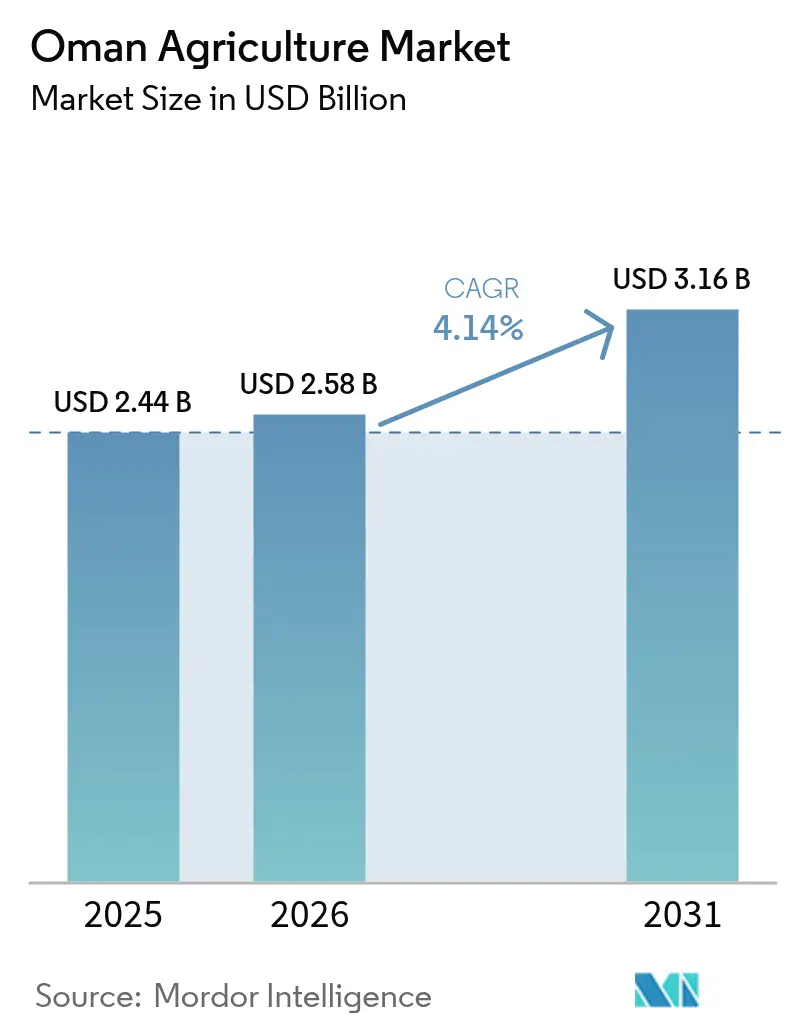
The Oman agriculture market size is projected to be USD 2.44 billion in 2025, USD 2.58 billion in 2026, and reach USD 3.16 billion by 2031, growing at a CAGR of 4.14% from 2026 to 2031. Capital deployed under Vision 2040, pilot greenhouse clusters in Batinah and Najd, and drip-irrigation mandates are lifting yields per cubic meter of water and anchoring Oman's agricultural market to the nation’s broader food security agenda. In 2023, the Sultanate of Oman achieved 100% self-sufficiency in cucumber production. In comparison, the self-sufficiency rate for pepper production was 95%, while that for tomato production was 83%, yet grains remain import-heavy, exposing the sultanate to external price swings[1]. Livestock expansion fuels incremental fodder acreage, while agriculture technology from hydroponics to artificial-intelligence crop-monitoring compresses water use by up to 90% inside commercial operations. Vertical integration by public-sector holding firms and dairy majors is tightening control over value-chain margins and raising entry barriers in the Oman agriculture market.
Key Report Takeaways
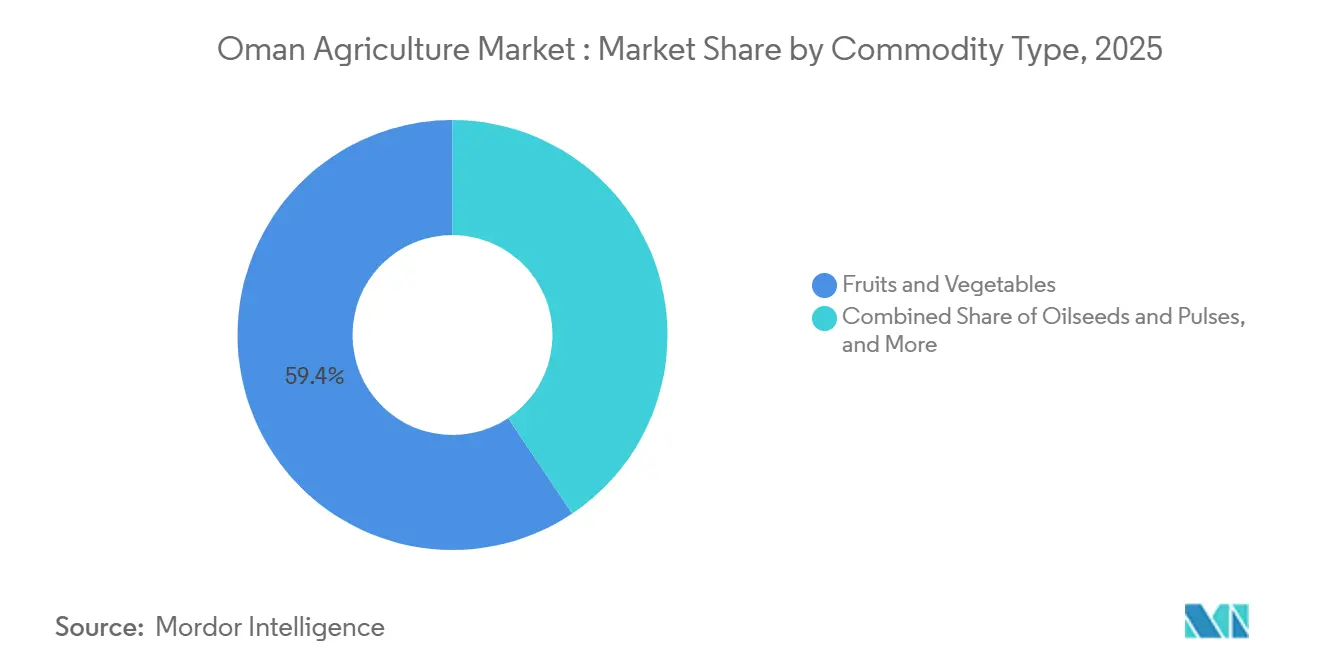
- By commodity type, fruits and vegetables represented 59.4% of the Oman agriculture market share in 2025, whereas forage and fodder crops are on track for the fastest CAGR of 4.7% through 2031.
Note: Market size and forecast figures in this report are generated using Mordor Intelligence’s proprietary estimation framework, updated with the latest available data and insights as of 2026.
Market Trends and Insights
Drivers Impact Analysis of Oman Agriculture Market *
| Driver | (~)% Impact on CAGR Forecast | Geographic Relevance | Impact Timeline |
|---|---|---|---|
| Government food-security investments and Vision 2040 initiatives | +0.9% | National focus, concentrated in Batinah, Dhofar and Najd | Medium term (2-4 years) |
| Technology adoption in precision farming, vertical agriculture and hydroponics | +0.7% | Early uptake in Muscat, Salalah and Sohar | Short term (≤2 years) |
| Livestock sector expansion driving forage demand | +0.5% | Strongest in Batinah coastal plain and Dhofar interior | Medium term (2-4 years) |
| Export diversification and trade-corridor build-out | +0.6% | Export hubs in Muscat, Sohar and Salalah ports | Long term (≥4 years) |
| Protected-agriculture and greenhouse infrastructure build-out | +0.5% | Clustered in Batinah and Najd | Medium term (2-4 years) |
| Water-management innovations including desalination and drip irrigation | +0.4% | Pilots in Najd and Dhofar | Long term (≥4 years) |
| Source: Mordor Intelligence | |||
Government Food-Security Investments and Vision 2040 Initiatives
Policy aligns capital with technologies that raise yield per drop, trim groundwater extraction, and upgrade food-quality certifications. In 2025, Oman allocated USD 97 million to food security initiatives to increase domestic production, improve self-sufficiency, and enhance resilience in key agricultural sectors. This funding, announced at the conclusion of the Food Security Lab, aligns with Oman's broader Oman Vision 2040 strategy to establish sustainable food and water systems and reduce reliance on imports. Launched in early 2024 by the Oman Investment Authority, the USD 5.2 billion (OMR 2 billion) Future Fund Oman aims to accelerate economic diversification by focusing on strategic sectors such as green energy, agriculture, and manufacturing. Performance-linked grants now reward greenhouses that pass audits, embedding quality metrics into subsidy flows. Collectively, these instruments translate policy intent into bankable projects that elevate the Oman agriculture market.
Technology Adoption in Precision Farming, Vertical Agriculture and Hydroponics
Commercial farms are increasingly using soil moisture sensors, drone scouting, and artificial intelligence for irrigation scheduling. Jenaan Oman’s hydroponic program produces a significant quantity of vegetables annually while using substantially less water compared to open-field cultivation. Oman Flour Mills has implemented predictive analytics, reducing inventory holding costs and boosting export volumes. Vertical farms in Muscat achieve multiple lettuce harvests each year, compared to fewer cycles in conventional farming, enabling faster payback despite higher initial capital expenditure. Government-facilitated partnerships established numerous weather stations in recent years, mitigating the risk of crop loss from heat spikes. These advancements are particularly notable in Dhofar, where monsoon variability previously impacted grower margins.
Protected-Agriculture and Greenhouse Infrastructure Build-Out
Greenhouse acreage is climbing in Batinah and Najd to counter summer highs that often top 48 degrees Celsius. Climate-controlled structures now cover sizable tracts, stabilizing tomato and cucumber output. Precision fans and evaporative cooling maintain 25 degrees Celsius inside houses, allowing year-round harvests that feed Muscat retailers and the Oman agriculture market export channel. Financing is supported by performance-linked subsidies that cover a significant portion of the cost of photovoltaic roofs. Growers using greenhouse modules report significantly higher yields of tomatoes than with traditional open-field cultivation methods. Project pipelines indicate that protected environments are projected to dominate vegetable supply within the next several years.
Export Diversification and Trade-Corridor Build-Out
Oman plays a significant role in the global date market, with an annual production nearing 400,000 metric tons from over 8.5 million palm trees in 2024. According to the ITC Trade Map, Oman exported 3,273 metric tons of dates in 2023, with key destinations including the United Arab Emirates, India, Qatar, Somalia, and Saudi Arabia[2]. As a member of the Gulf Cooperation Council (GCC), Oman benefits from unified trade standards and regulations, facilitating regional trade. The rise of premium Omani date brands, such as Meshan, is helping promote high-quality dates to international markets. Salalah Port’s 60,000-square-meter cold-chain park and Sohar Port’s two-hundred-million-metric-ton throughput capacity reduce transit times to less than 48 hours for shipments to East Africa and India.
Restraints Impact Analysis of Oman Agriculture Market *
| Restraint | (~)% Impact on CAGR Forecast | Geographic Relevance | Impact Timeline |
|---|---|---|---|
| Water scarcity and aquifer depletion | -0.8% | Nation-wide, most acute in Batinah, Najd and Sharqiyah | Long term (≥4 years) |
| High import dependency for cereals and oilseeds | -0.5% | Wheat and barley supply chains | Medium term (2-4 years) |
| Limited arable land and soil salinity | -0.4% | Coastal Batinah and interior Najd | Long term (≥4 years) |
| Input cost inflation for fertilizers and animal feed | -0.3% | Spill-over from global urea and soybean prices | Short term (≤2 years) |
| Source: Mordor Intelligence | |||
Water Scarcity and Aquifer Depletion
Oman is experiencing significant aquifer depletion due to its arid climate, high agricultural water demand, and population growth, leading to an annual water deficit of approximately 365 million cubic meters[3]. Over-extraction of groundwater has resulted in severe seawater intrusion, particularly in the Al Batinah coastal region, causing the abandonment of wells and farmland. However, desalinated water remains costly and is economically viable only for high-value greenhouse crops. New tariff brackets impose higher charges when commercial farms exceed specified thresholds, encouraging the adoption of drip irrigation systems. Climate models predict a 1.5 degrees Celsius increase in temperature by 2030, which is projected to intensify evapotranspiration and heat stress on open-field vegetables. In response, policymakers are prioritizing the development of closed agricultural systems, though scaling these systems for staple crops like wheat is unlikely within the forecast period.
High Import Dependency for Cereals and Oilseeds
Grains account for a significant share of cereal demand, making Oman susceptible to global market disruptions. The Ukraine crisis led to increased wheat import costs, prompting the release of strategic reserves and the establishment of new supply agreements with India and Australia. Increasing local wheat self-sufficiency by 2030 would require a five-fold expansion of irrigated farmland, which conflicts with existing water conservation regulations. Oilseed crushing operations depend on imported soybeans, meaning domestic processors bear the impact of global oilseed price fluctuations. While reserve buffers currently cover six months of consumption, long-term resilience will depend on either substantial yield improvements or continued reliance on imports.
*Our forecasts treat driver/restraint impacts as directional, not additive. The impact forecasts reflect baseline growth, mix effects, and variable interactions.
Oman Agriculture Market Segment Analysis
By Commodity Type:
Fruits and Vegetables Dominate the MarketFruits and vegetables were the largest commodity type, accounting for 59.4% of the Oman agriculture market share in 2025, underscoring how greenhouse tomatoes, cucumbers, and peppers exploit protected environments to maintain volumes despite external temperatures exceeding 48 degrees Celsius. According to the Food and Agriculture Organization of the United Nations (FAO), tomato production exceeded 236,965 metric tons in 2024, with greenhouse methods representing the majority of Batinah output, aided by quick access to Muscat consumers and export ports. Date output neared 400,655 metric tons in 2024, from over 9 million palms, while Khalas and Fard varieties fetch premiums in Gulf retail channels owing to improved traceability. The Oman agriculture market share for fruits and vegetables remains dominant because capital recovery periods shorten when year-round cycles capture double-digit yields.
Forage and fodder crops post the highest forecast CAGR of 4.7%, an outcome tied to dairy and poultry expansion. The Oman agriculture market size for these feed crops is projected to climb as integrated dairy complexes like Mazoon triple herd counts. New seed genetics and pivot irrigation rigs improve stand longevity, reducing per-metric ton costs. Smallholder herders also latch on, switching from low-margin cereals to premium hay lines that slot directly into feed-mill contracts.

Geography Analysis
The Batinah coastal plain supplies a significant portion of the national vegetable and date tonnage, leveraging short-hauls to Muscat supermarkets and container terminals. Greenhouses dominate winter schedules, while summer internal temperatures are tamed through evaporative cooling, keeping chambers near 25 degrees Celsius. Groundwater decline of 2 to 3 meters per year prompted authorities to restrict well permits and mandate drip irrigation on new acreage, yet logistics advantages and port proximity ensure Batinah remains the cornerstone of Oman's agricultural market.
Dhofar benefits from the Khareef monsoon, receiving up to 400 millimeters of rainfall between June and September. This rainfall supports the cultivation of crops such as coconut, banana, and papaya, which face challenges in other regions of the country. Frankincense tapping remains a key export activity, now regulated by sustainable protocols that limit the number of cuts per tree. Rhodes grass thrives in saline soils, providing feed for growing cattle herds and supporting Dhofar Cattle Feed's operations. Salalah Port, with its cold storage facilities and a capacity of 5 million containers, facilitates exports to East Africa and South Asia, solidifying Dhofar’s position as a gateway for perishable goods.
Interior governorates such as Najd, Al Dakhliyah, and Sharqiyah rely on date groves, fodder plots, and niche wheat crops, mainly grown for strategic buffering rather than commerce. Najd’s central farm showcases precision irrigation that trims water use by one-third without yield sacrifice. Wheat harvests jumped sixfold to over ten thousand metric tons in 2024, but water economics curb further scale-up. Musandam’s rugged topography shifts focus toward fisheries rather than farming. Investments under the Food Security Lab target Batinah, Najd, and Dhofar, aiming to double output per cubic meter within three seasons.
Regulatory Landscape
Agriculture in Oman is governed primarily by the Ministry of Agriculture, Fisheries and Water Resources (MoAFWR), whose mandate for agricultural policy, food security, and water management is set out under Royal Decree 92/2020. Market participants operate under import, inspection, and phytosanitary controls anchored by the Agricultural Quarantine Law (Royal Decree 47/2004) and food safety requirements under the Food Safety Law (Royal Decree 84/2008), with compliance also aligned to GCC-wide food safety standards for cross-border trade.
Regulatory enforcement is increasingly reflected in quality and traceability requirements for export-facing facilities, including alignment with GCC Standardization Organization protocols and ISO 22000 in food-chain operations. In February 2026, Oman and the FAO signed a 2026-2030 Country Programming Framework (CPF) focused on food security and natural resource sustainability, reinforcing the direction of policy toward climate-resilient production systems and tighter controls over inputs, on-farm practices, and post-harvest handling.
Value Chain Analysis
Oman's agriculture value chain spans input supply (seeds, fertilizers, crop protection, greenhouse structures, irrigation equipment, and digital tools), primary production (open-field, protected cultivation, and hydroponics), aggregation and post-harvest services (grading, sorting, packing, and cold storage), processing (dates, flour milling, animal feed, and emerging protein processing), and distribution through wholesale markets, modern retail, and export channels via Muscat, Sohar, and Salalah logistics corridors. Public-sector programs and financing platforms also support project origination and scaling, including the Food Security Lab investment pipeline and capital mobilization through vehicles such as the Oman Investment Authority-backed Future Fund Oman.
Recent infrastructure and program additions are tightening the connection between farms and offtake. The July 2025 launch of a RO 300,000 agricultural products collection centre in Masroon (Ibra) expanded last-mile aggregation for small and mid-sized growers, while Khazaen Food City is positioned as a processing and distribution node with multiple food-sector projects. In Dhofar, contract-farming structures such as the commercial sesame initiative in Al Najd and the development of integrated agricultural centers add structured offtake and processing adjacency, reducing post-harvest losses and improving quality consistency for domestic and export buyers.
Competitive Landscape
The Oman agriculture market is benefiting from the expansion into cold-chain logistics, which plays a crucial role in enhancing the vertical integration of inputs and ensuring better control over the supply chain. This development also significantly broadens the market's reach, enabling access to new regions and improving the distribution of agricultural products. This mirrors a broader trend of processors securing upstream control to dilute commodity-price volatility. Technology adoption is emerging as a competitive differentiator. Jenaan Oman LLC’s hydroponic systems produce vegetables annually in climate-controlled greenhouses, eliminating the risk of soil-borne diseases and reducing water use by 90%. This positions the company to cater to premium retail and HORECA channels.
Opportunities remain in areas such as organic certification and oilseed crushing, where infrastructure and regulatory frameworks are less developed than those of regional counterparts. Smaller players, including Salalah Greenhouses LLC and Gulf Mushroom Products Company SAOG, are establishing niche positions in specialty crops by utilizing Dhofar's monsoon climate and Muscat's proximity to urban markets. These companies face challenges scaling operations due to limited capital, which necessitates external financing or strategic partnerships. Regulatory compliance is becoming more stringent, with the Oman Food Safety Authority requiring traceability systems in line with GCC Standardization Organization protocols and ISO 22000 certification for export-focused facilities. These measures increase entry barriers but enhance Oman's reputation in quality-sensitive markets.
Market consolidation is accelerating as companies face increasing challenges. Increased regulatory requirements related to GCC Standardization Organization traceability and ISO 22000 certification are raising compliance costs, prompting under-capitalized companies to consider exiting the market or pursuing mergers. These regulations demand significant investments in infrastructure and processes to ensure compliance, creating barriers for smaller players. Ag-tech startups are providing weather-station networks and drone-mapping solutions that enhance precision farming and operational efficiency, but they continue to depend on large farms for revenue due to limited scalability and high initial costs. Competition is most intense in the vegetables and dates segments, driven by high demand and concentrated production, while it is less pronounced in fodder due to the geographic dispersion of producers, which reduces direct rivalry.
Market Opportunities and Future Outlook
Investment gaps are most visible where Oman combines food-security funding with capacity-building programs for controlled-environment horticulture, post-harvest logistics, and protein value chains linked to domestic processing. In 2025, Oman allocated USD 97 million to food security initiatives, and the 11th Five-Year Plan (2026-2030) investment slate includes an announced pipeline of 400 projects in 2026 valued at OMR 400 million, including 200 projects in plant and animal agriculture. These programs point to near-term demand for turnkey greenhouse modules, hydroponic systems, drip-irrigation retrofits, and farm services that improve yield per cubic meter under binding water constraints.
Downstream processing and integrated agri-industrial hubs provide a second opportunity layer, with assets and agreements linking production to higher-value conversion and more predictable offtake. The February 2026 USD 150 million strategic partnership involving JBS and Oman Food Capital targets poultry and red meat processing platforms (including A'Namaa Poultry in Ibri and Al Bashayer beef and lamb facilities in Thumrait), signaling momentum for locally anchored animal protein supply chains and feed-to-processing integration. Parallel initiatives such as the Solar Energy Sustainable Harvest program (loan support for solar integration on farms) and agricultural city developments in Saham and Al Najd broaden the addressable market for energy-efficient irrigation, cold chain, and packhouse services that reduce operating costs and stabilize year-round output.
Recent Industry Developments in Oman Agriculture Market
- May 2026: Khazaen Economic City signed an expansion agreement with Sohar Food and Beverages to enlarge its Food City manufacturing facility by 10,000 square meters, lifting total project investment to about RO 10 million. The added footprint expands domestic processing capacity and supports higher-throughput handling of locally sourced agricultural inputs routed through Khazaen's food-industrial cluster.
- February 2026: JBS and Oman Food Capital finalized a USD 150 million strategic partnership, with JBS taking an 80% stake in a new food holding company covering A'Namaa Poultry in Ibri and Al Bashayer beef and lamb facilities in Thumrait. The deal strengthens a multiprotein processing platform inside Oman, tightening farm-to-processing integration and raising competitive standards for scaled producers and suppliers.
- September 2025: Oman and the Japan International Cooperation Agency (JICA) signed a technical cooperation agreement to develop a master plan for the Al Najd area in Dhofar Governorate. The planning scope supports long-cycle investments in water resources, land development, and logistics that underpin Najd's role as a strategic agricultural and food security zone.
Oman Agriculture Market Report Scope and Research Methodology
Market Definition and Coverage
For this report, the market covers the value of agricultural output in Oman across major crop groups, measured in USD at the farm and primary wholesale level, and aligned to domestic production plus net trade and local consumption.
Scope exclusions: It does not count seafood, forestry, or downstream food processing, and it also excludes non-agricultural services such as logistics and retailing beyond primary trade.
Segments Covered in This Report
- By Commodity Type
- Cereals and Grains
- Production Analysis
- Overview
- Area Harvested and Yield
- Consumption Analysis (Value and Volume)
- Trade Analysis (Value and Volume)
- Import Market Analysis
- Overview
- Key Supplying Markets
- Export Market Analysis
- Overview
- Key Destination Markets
- Import Market Analysis
- Wholesale Price Trend Analysis and Forecast
- Seasonality Analysis
- Production Analysis
- Oilseeds and Pulses
- Production Analysis
- Overview
- Area Harvested and Yield
- Consumption Analysis (Value and Volume)
- Trade Analysis (Value and Volume)
- Import Market Analysis
- Overview
- Key Supplying Markets
- Export Market Analysis
- Overview
- Key Destination Markets
- Import Market Analysis
- Wholesale Price Trend Analysis and Forecast
- Seasonality Analysis
- Production Analysis
- Fruits and Vegetables
- Production Analysis
- Overview
- Area Harvested and Yield
- Consumption Analysis (Value and Volume)
- Trade Analysis (Value and Volume)
- Import Market Analysis
- Overview
- Key Supplying Markets
- Export Market Analysis
- Overview
- Key Destination Markets
- Import Market Analysis
- Wholesale Price Trend Analysis and Forecast
- Seasonality Analysis
- Production Analysis
- Forage and Fodder Crops
- Production Analysis
- Overview
- Area Harvested and Yield
- Consumption Analysis (Value and Volume)
- Trade Analysis (Value and Volume)
- Import Market Analysis
- Overview
- Key Supplying Markets
- Export Market Analysis
- Overview
- Key Destination Markets
- Import Market Analysis
- Wholesale Price Trend Analysis and Forecast
- Seasonality Analysis
- Production Analysis
- Cash Crops
- Production Analysis
- Overview
- Area Harvested and Yield
- Consumption Analysis (Value and Volume)
- Trade Analysis (Value and Volume)
- Import Market Analysis
- Overview
- Key Supplying Markets
- Export Market Analysis
- Overview
- Key Destination Markets
- Import Market Analysis
- Wholesale Price Trend Analysis and Forecast
- Seasonality Analysis
- Production Analysis
- Cereals and Grains
Data Sources, Market Sizing, and Validation
Desk Research
Desk research was used to set the base structure of the Oman agriculture model and to lock consistent definitions for production, consumption, prices, and trade. We referenced public sources such as FAOSTAT, UN Comtrade, the World Bank data portal, and the Oman National Centre for Statistics and Information for time series on agriculture output and macro indicators.
To make the model more practical, additional context was taken from ministry and regulator releases, customs and port updates, peer-reviewed agronomy papers on water use and yields, and reputable press reporting on local farming projects. Company annual reports and investor presentations were used to sanity check crop mix signals and stated capacity or expansion plans, and a paid subscription for shipment-level import and export records was used selectively to validate trade direction by category. This list is illustrative only, and many other public sources were also reviewed for data collection, cross-checks, and clarification.
Primary Interviews and Surveys
Primary work focused on validating demand and supply realities that public datasets do not explain well, like effective farmgate price movements, seasonality patterns, and practical constraints from water availability. We spoke with a mix of growers, packers, distributors, importers, and institutional buyers across Oman, then used cross-functional roles to confirm assumptions on yields, cropped area changes, and how imports bridge local supply gaps.
Distribution of primary research fieldwork respondents
| Company type | Respondent position |
|---|---|
| Top tier: 38% | CXOs: 14% |
| Mid tier: 45% | Functional/Unit leaders: 40% |
| Smaller Players: 17% | Managers: 46% |
Market-Sizing & Forecasting
Sizing starts with a top-down build that reconstructs the country demand pool using crop-wise production volumes, net imports and exports, and observed wholesale price trends, then converts this into a consistent USD value series. To keep the totals realistic, we corroborated results with selective bottom-up checks, such as sampled price times volume checks for key crops, discussions on import dependence by channel, and a light supplier and buyer roll up where information is available.
Inputs used in the model include planted area and yield direction, greenhouse and protected cultivation additions, irrigation adoption and water constraints, wholesale price seasonality, and net trade intensity for categories that are still structurally import dependent. Forecasting relies mainly on scenario analysis, where yield and area paths are stress-tested against water policy, technology uptake, and the pace of investment, then aligned to what interviewees see as feasible over the next few seasons. Where bottom-up visibility is limited for smaller crop lines, gaps are handled by applying conservative price bands and volume shares anchored to official category totals before final aggregation.
Data Validation & Update Cycle
Validation is handled through repeated checks that compare the model outputs with independent signals, such as agriculture value added trends, import and export movements, and observed price swings during peak and off-peak months. If a category shows an unusual jump, we reviewed the drivers again and re-checked the relevant assumptions through follow-up calls or fresh desk reads before the model was signed off.
Each report is refreshed on an annual cycle, and interim updates are made when material events occur, such as major policy changes on water and farming support, sharp commodity price changes, or notable shifts in trade flows. Before delivery, a final analyst pass is completed so the numbers reflect the latest available datasets and the most recent market signals.
Mordor Intelligence's Oman Agriculture Market Size Versus Other Published Estimates
Published market values for Oman agriculture can look far apart because groups do not always count the same boundary, and they also use different price references and years. In practice, the choice between value added style measures and commodity output and trade based measures can change the total by a lot.
By tracking crop-wise production, net trade, and wholesale price seasonality, Mordor Intelligence keeps the estimate tied to primary agriculture flows in Oman, whereas some sources lean on narrower sector value-added snapshots or mixed definitions that are not reconciled to crop category totals.
Benchmark comparison
| Source | Market Size | Gaps in Research Methodology |
|---|---|---|
| Mordor Intelligence | USD 2.44 B (2025) | |
| Market Marketplace A | USD 2.24 B (2024) | Uses a different base year and a faster growth path, and the scope is not clearly tied to a production plus net trade reconciliation, which can inflate or compress totals depending on price and category mapping. |
| Investment Portal B | USD 0.96 B (2023) | Appears closer to a sector value-added style headline with limited scope notes, which can undercount commodity throughput, traded volumes, and price seasonality that are typically needed to represent the full agriculture flow. |
Taken together, the spread is mainly explained by scope boundaries, the year and price reference used, and whether trade and commodity volumes are explicitly reconciled. Our approach stays traceable to repeatable inputs like volumes, net trade, and observable price series, which makes it easier for clients to update assumptions as new official statistics get released.
Key Questions Answered in the Report
How large is the Oman agriculture market in 2026?
The sector is valued at USD 2.58 billion in 2026 and is projected to reach USD 3.16 billion by 2031.
Which commodity group leads production value?
Fruits and vegetables account for 59.4% of output value, anchored by greenhouse tomatoes, cucumbers and peppers.
What is the fastest-growing segment through 2031?
Forage and fodder crops, led by alfalfa and Rhodes grass, are forecast to grow at 4.7% CAGR.
How is Oman addressing water scarcity in agriculture?
Strategies include drip irrigation mandates, Food Security Lab pilot funding, and closed-loop hydroponic systems that recycle up to 95% of water.
Which ports support Oman’s farm-export ambitions?
Salalah Port houses 60,000 square meters of cold storage, while Sohar Port handles two-hundred-million metric-tons of throughput, enabling rapid links to East Africa and South Asia.