Market Overview
| Study Period | 2019 - 2030 |
|---|---|
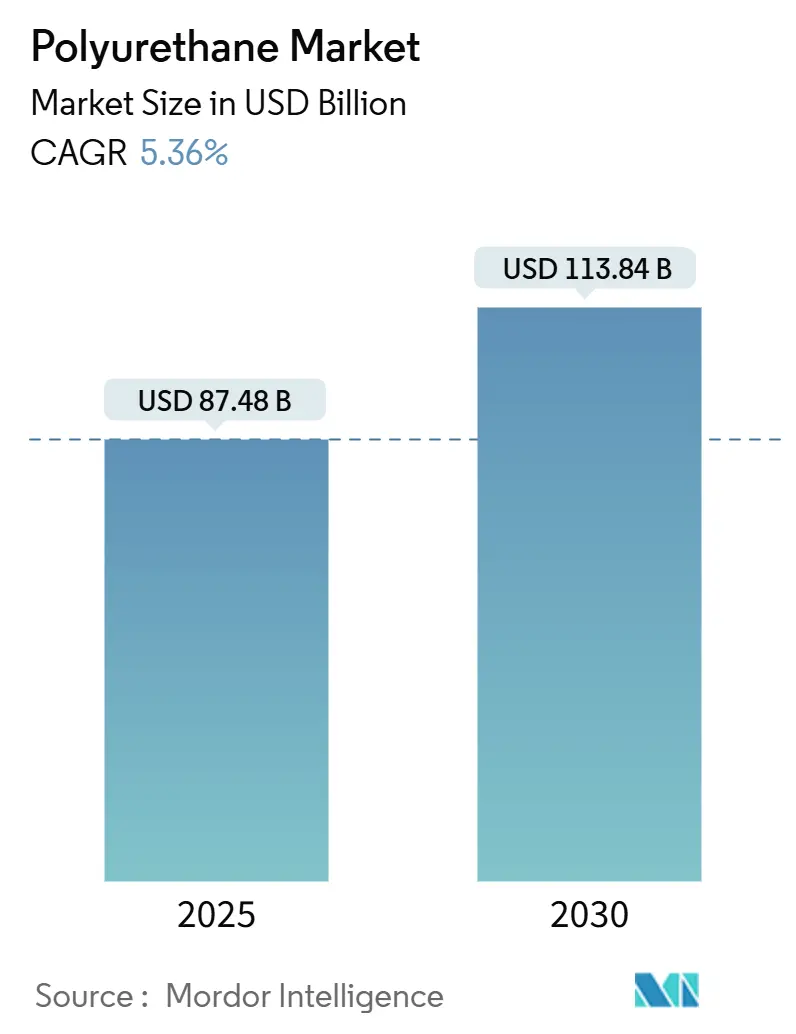
| Market Size (2025) | USD 87.48 Billion |
| Market Size (2030) | USD 113.84 Billion |
| Growth Rate (2025 - 2030) | 5.36% CAGR |
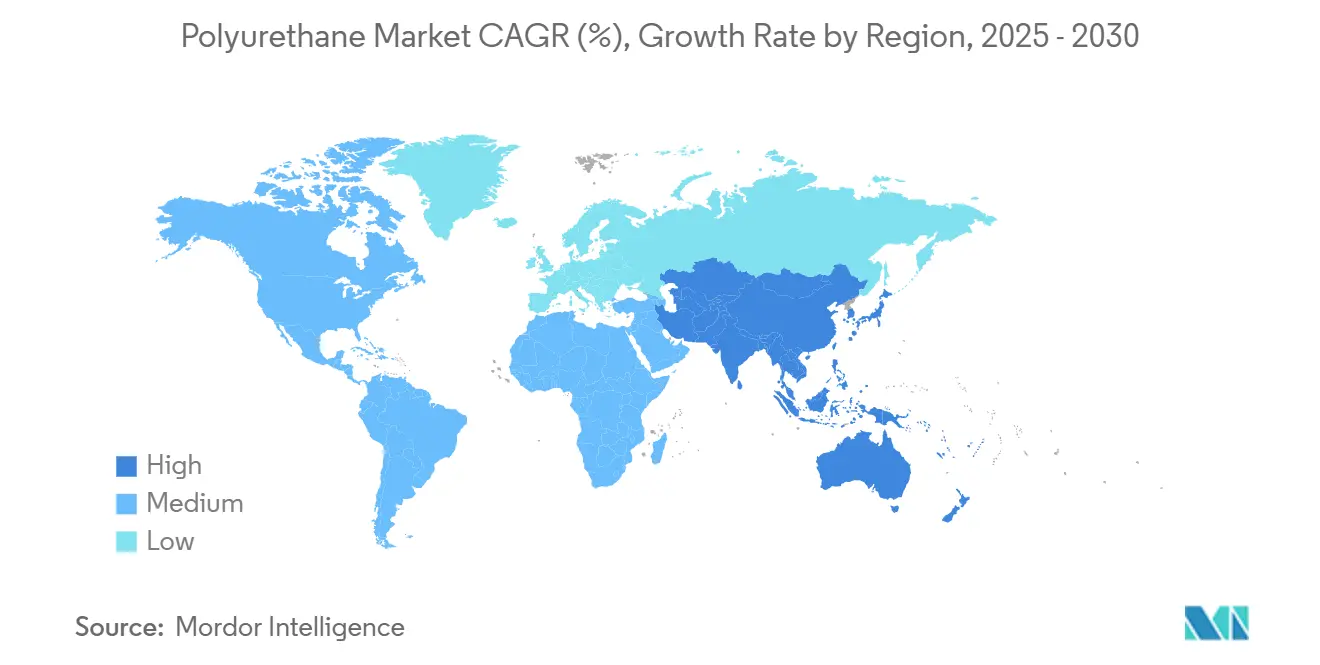
| Fastest Growing Market | Asia-Pacific |
| Largest Market | Asia-Pacific |
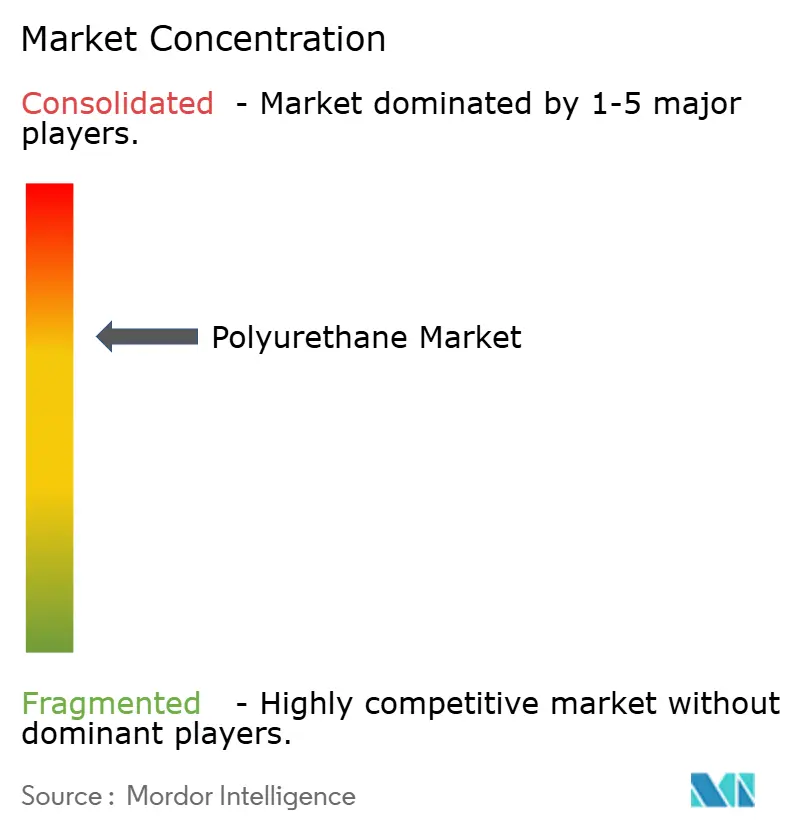
| Market Concentration | Medium |
Major Players
*Disclaimer: Major Players sorted in no particular order Image © Mordor Intelligence. Reuse requires attribution under CC BY 4.0. |
|
Polyurethane Market Analysis by Mordor Intelligence
The polyurethane market size is estimated at USD 87.48 billion in 2025 and is projected to reach USD 113.84 billion by 2030, expanding at a 5.36% CAGR during 2025-2030. This solid growth is anchored in the material’s broad adoption across construction, automotive, furniture, and electronics, each valuing polyurethane’s insulation, lightweighting, and durability advantages. Asia-Pacific’s 46% revenue lead—supported by large-scale capacity additions in China and robust petrochemical investments in India—continues to tilt global supply toward the region. The building sector sustains baseline volume through stricter energy codes, while automotive producers accelerate demand for advanced polyurethane composites to lower vehicle weight and boost fuel efficiency. Innovation momentum is reinforced by investments in bio-based polyols, closed-loop recycling technologies, and low-VOC coatings that reduce lifecycle emissions and regulatory exposure. Even amid MDI/TDI price swings and upcoming trade investigations, the polyurethane benefits from entrenched value-chain integration and a growing roster of sustainability-driven applications.
Key Report Takeaways
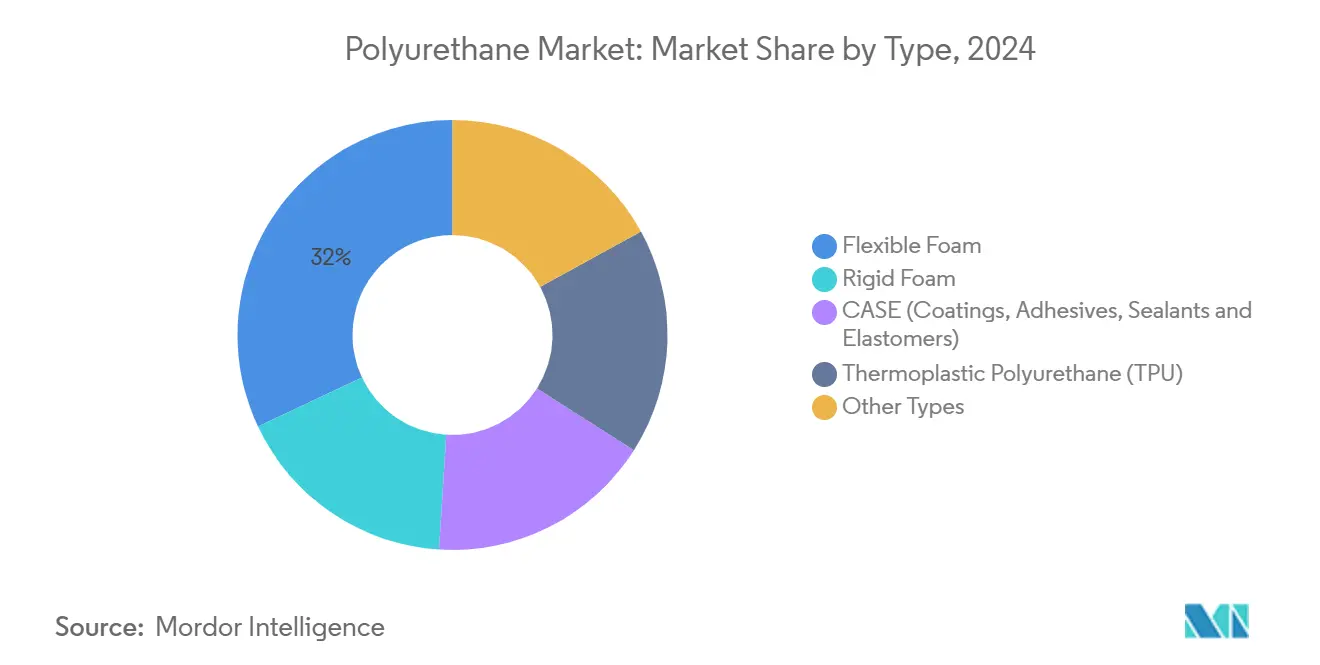
- By type, flexible foam led with 32% revenue share of the polyurethane market in 2024, and is projected to expand at a 6.07% CAGR through 2030.
- By raw material, MDI held 41.20% of the polyurethane market share in 2024, while bio-based polyols are forecast to grow at 6.90% CAGR to 2030.
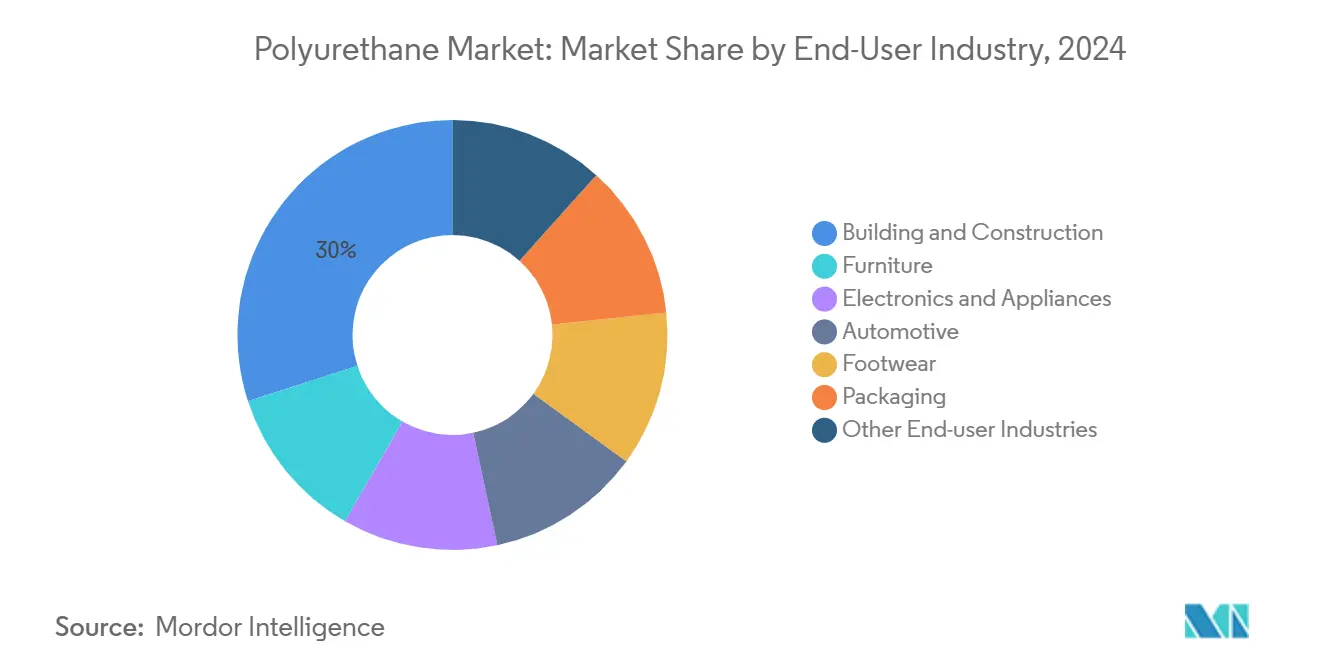
- By end-user industry, building and construction commanded 30% of the polyurethane market in 2024; automotive is poised for the fastest 6.17% CAGR through 2030.
- By geography, Asia-Pacific accounted for 46% share of the polyurethane market size in 2024 and is advancing at a 6.01% CAGR through 2030.
Global Polyurethane Market Trends and Insights
Drivers Impact Analysis
| Driver | (~) % Impact on CAGR Forecast | Geographic Relevance | Impact Timeline |
|---|---|---|---|
| Increasing Demand for Lightweight and High-performance Composites from the Automotive Industry | +1.20% | Global (notably North America, Europe, Asia-Pacific) | Medium term (2-4 years) |
| Increasing Demand from the Building and Construction Industry | +1.50% | Global, emphasis on Asia-Pacific and North America | Long term (≥ 4 years) |
| Increasing Demand from the Bedding, Carpet, and Cushioning Industries | +0.80% | Global, concentration in Asia-Pacific and North America | Short term (≤ 2 years) |
| Growing Demand for Energy-Efficient Materials | +0.70% | Global, emphasis on Europe and North America | Medium term (2-4 years) |
| Shift Towards Low-VOC (Volatile Organic Compounds) and Waterborne Polyurethanes | +0.60% | Global, emphasis on Europe and North America | Medium term (2-4 years) |
| Source: Mordor Intelligence | |||
Understand The Key Trends Shaping This Market
Download PDF
Lightweight Materials in Automotive
Automakers are swapping metal components for fiber-reinforced polyurethane to trim curb weight, meet fuel-economy mandates, and curb tailpipe CO₂. Dow’s molded PU seats slash the embodied footprint by 50% per seat while preserving comfort, proving the readiness of circular-grade foams for mass production. Acoustically optimized headliners and interior trim from Covestro cut noise and volatile organic compound (VOC) release, raising cabin-air quality with minimal redesign effort[1]Covestro, “Baynat® headliners,” solutions.covestro.com . Tier-1 suppliers integrating these composites report assembly-line compatibility without new capital outlays, reinforcing adoption prospects through 2030.
Building & Construction Growth
Global energy codes now specify higher R-values and tighter air-sealing, which play directly to rigid polyurethane’s thermal and vapor control strengths. Asia-Pacific’s construction boom, coupled with North American retrofit incentives, keeps architects reliant on thin-but-high-performing spray and boardstock insulation. Manufacturers respond by widening capacity and launching CO₂-modified rigid foams that substitute 20% of fossil polyol, lowering cradle-to-gate emissions without shifting processing parameters. The policy-led momentum supports steady demand expansion across new-build and retrofit markets.
Bedding & Furniture Demand
Direct-to-consumer mattress brands favor compressible flexible polyurethane foams that rebound quickly after shipping, reducing logistics cost and showroom floorspace. Viscoelastic upgrades increase pressure distribution, pushing premium bedding sales, while acidolysis–hydrolysis recycling recovers up to 82% of end-of-life mattress foam for new production runs. Furniture makers share similar material needs and, by 2030, will leverage emerging bio-based polyols to deliver carbon-labeled products that address eco-conscious buyers.
Energy-Efficiency Requirements
Regulators in Europe and North America mandate continuous insulation layers and airtight envelopes. Polyurethane’s dual role as thermal and air barrier allows fewer layers and faster installation, cutting site labor and embodied energy. Industrial cold-chain operators apply similar thinking, selecting sprayed PU systems to reduce refrigeration load and defrost cycles, which lowers energy bills and equipment wear.
Restraints Impact Analysis
| Restraint | (~) % Impact on CAGR Forecast | Geographic Relevance | Impact Timeline |
|---|---|---|---|
| Volatility in MDI/TDI Feedstock Linked to Meta-Xylene and Crude Oil Price Swings | -1.00% | Global, higher impact in Asia-Pacific | Short term (≤ 2 years) |
| EU REACH and China RoHS Limits on PFAS-Based PU Additives | -0.70% | Europe and China with global spillover | Medium term (2-4 years) |
| Environmental Concerns | -0.60% | Global, emphasis on Europe and North America | Long term (≥ 4 years) |
| Source: Mordor Intelligence | |||
MDI/TDI Feedstock Volatility
MDI’s 41.20% raw-material share ties polyurethane producers to benzene and crude-oil swings. Scheduled turnarounds, such as Wanhua’s Ningbo outage, and antidumping actions on Chinese MDI entering the United States in 2025 inject price spikes and allocation cuts. Processors hedge with longer contracts, yet margin compression persists, delaying downstream investment in expansion lines until supply stabilizes.
Regulatory Restrictions on Additives
Europe’s proposed PFAS umbrella ban and China’s phthalate caps force formulators to identify new surfactants and plasticizers, triggering re-qualification cycles that stretch into 2027. Short-term cost escalation arises from dual inventories—legacy and compliant grades—while performance-matching challenges may limit polyurethane use in niche applications where additive functionality is critical, further influencing dynamics.
Segment Analysis
By Type: Flexible Foam Retains Leadership
Flexible foam captured 32% of polyurethane market share in 2024, maintaining a comfort-driven edge across bedding, furniture, and automotive seating. The polyurethane market size for flexible foam is projected to rise at 6.07% CAGR through 2030, aided by viscoelastic upgrades that improve pressure redistribution and by “bed-in-a-box” fulfillment models that hinge on compressed, quick-recovery foams. Producers enhance resilience and airflow, enabling thinner mattress builds that match premium ergonomic expectations. Recyclers refine acidolysis processes that reclaim polyol streams at 82% yield, moving the segment closer to circular supply loops[2]Phys.org, “Researchers discover smarter way to recycle polyurethane,” phys.org .
Rigid foam takes second position, favored in construction insulation for its high R-value per inch and ability to deliver air-sealing in a single pass. Adoption accelerates in retrofit projects where wall cavities constrain thickness, reinforcing sustained volume demand in temperate as well as extreme-climate markets. CASE sub-segments (coatings, adhesives, sealants, elastomers) extend polyurethane’s utility to vibration damping, industrial flooring, and corrosion-resistant linings. Thermoplastic polyurethane (TPU) wins share in footwear and electronics enclosures, buoyed by Lubrizol’s biomass-balanced ESTANE RNW grade that cuts manufacturing carbon by up to 59%.
Note: Segment shares of all individual segments available upon report purchase
Get Detailed Market Forecasts at the Most Granular Levels
Download PDF
By Raw Material: MDI Dominance and Bio-Based Polyol Upside
MDI commanded 41.2% of raw-material demand in the polyurethane market in 2024, underlining its pivotal role in both flexible and rigid foams. The polyurethane tied to MDI is expected to track overall market CAGR, though price spikes associated with maintenance outages and trade probes remain a disruptive variable. Producers counter volatility with regional sourcing diversity and incremental capacity debottlenecking.
Bio-based polyols represent the fastest-rising feedstock, set to log a 6.90% CAGR to 2030. Changhua Chemical’s CO₂-to-polyol plant, initially rated at 80,000 t pa, exemplifies scale-up momentum that also displaces petroleum inputs and sequesters greenhouse gases[3]Chemical & Engineering News, “Changhua building CO₂-to-polyols,” cen.acs.org . TDI retains relevance in flexible foam and coatings but cedes share where supply risk and regulatory scrutiny favor alternatives. Future raw-material mix will hinge on end-user willingness to pay green premiums and on the maturity of large-volume biomass or CO₂ routes.
By End-User Industry: Construction Anchors, Automotive Accelerates
The construction sector held 30% of polyurethane revenue in 2024, benefitting from strict building codes that prioritize high-performance insulation and air barriers. The polyurethane market size allocated to construction is projected to grow at a steady clip as urban densification and renovation incentives stoke demand for thinner, more efficient thermal solutions.
Automotive applications, rising at a 6.17% CAGR, extend beyond seating cushions to include composite body panels, under-hood acoustic shields, and thermal barriers that support battery-electric vehicle range. Lightweight polyurethane composites contribute to structural stiffness and occupant comfort without adding mass, aligning with aggressive fleet-average CO₂ targets in Europe, China, and the United States. Furniture, footwear, electronics, and emerging photovoltaic module frames round out a diversified demand profile that cushions segment-specific slowdowns, shaping trends in the polyurethane industry.
Note: Segment shares of all individual segments available upon report purchase
Get Detailed Market Forecasts at the Most Granular Levels
Download PDF
Geography Analysis
Asia-Pacific generated 46% of polyurethane market revenue in 2024, with China acting as both production nucleus and consumption powerhouse. Local leaders such as Wanhua aggressively scale MDI and polyol capacity, while India’s USD 87 billion petrochemical pipeline amplifies regional feedstock security and derivative growth. Public and private construction booms, paired with rapid motorization, ensure the region retains the highest 6.01% CAGR through 2030.
North America follows with a mature yet innovative market. The United States leans on high R-value insulation for residential retrofits and pursues circular-grade automotive seating foams to meet corporate environmental targets. Policy moves—such as the 2025 antidumping investigation on Chinese MDI—reshape sourcing strategies and encourage domestic capacity investments. Canada’s net-zero building agenda further anchors steady regional demand, reinforcing the momentum in polyurethane industry.
Europe’s polyurethane market is shaped by stringent chemical regulations. The looming PFAS restriction compels wide-ranging formulation revisions, favoring suppliers with advanced additive R&D and rapid regulatory compliance processes. At the same time, green public-procurement criteria reward low-VOC and low-carbon products, nudging manufacturers toward biomass-balanced and CO₂-modified grades.
South America, the Middle East, and Africa represent smaller slices of the polyurethane yet grow from infrastructure, furniture, and packaging demand. Brazil promotes domestic petrochemicals expansion to reduce import dependence, while Saudi Arabia leverages feedstock advantage to explore polyurethane exports. Technology and best-practice diffusion from larger markets help emerging regions fast-track compliance with international sustainability benchmarks.
Get Analysis on Important Geographic Markets
Download PDF
Competitive Landscape
The top five suppliers—BASF SE, Covestro AG, Dow Inc., Huntsman Corporation, and Wanhua Chemical Group—collectively controlled roughly 50% of polyurethane industry revenue in 2024. Their scale secures upstream integration into MDI, TDI, and polyols, enabling margin defense against feedstock gyrations and funding large R&D budgets that mid-tier rivals cannot easily match. Covestro’s rigid foam, synthesized with up to 20% CO₂ in place of oil, illustrates how incumbents wield process know-how to lower product carbon intensity and win specification in green-building projects.
Strategic activity centers on circular solutions. BASF’s chemical-recycling pilot retrieves virgin-quality polyol from post-consumer foam, facilitating like-for-like substitution in new flexible products. Dow collaborates with Jaguar Land Rover and Adient to commercialize closed-loop automotive seating that halves per-seat CO₂e. Lubrizol’s biomass-balanced TPU line signals how specialty formulators secure niche profits by pairing performance with verifiable carbon reduction.
New entrants emphasize bio-feedstocks, degradability, and additive-free processing. They target applications where incumbents face cost-of-change barriers, such as footwear midsoles and consumer electronics casings. Mergers and capacity rationalizations occasionally rebalance regional supply; Dow’s review of European assets points to strategic pruning in response to energy costs and regulatory burdens.
Polyurethane Industry Leaders
-
BASF SE
-
Covestro AG
-
Huntsman International LLC
-
Wanhua
-
Dow
- *Disclaimer: Major Players sorted in no particular order
Need More Details on Market Players and Competitors?
Download PDF
Recent Industry Developments
- October 2024: Lubrizol introduced four biomass-balance ESTANE RNW thermoplastic polyurethane grades that deliver up to 59% lower cradle-to-gate carbon footprint compared with conventional TPUs. The launch underlines growing brand-owner preference for quantified climate benefits.
- March 2024: BASF and Jiangsu Worldlight unveiled a polyurethane photovoltaic module frame at CHINAPLAS 2024 that claims an 85% footprint reduction versus aluminum. This signals polyurethane’s progress into non-traditional clean-energy hardware.
Research Methodology Framework and Report Scope
Market Definitions and Key Coverage
Our study sizes the global polyurethane market as revenue and volume from freshly produced flexible foams, rigid foams, CASE products (coatings, adhesives, sealants, elastomers), thermoplastic polyurethane, and smaller specialty grades created by reacting polyols with di-isocyanates and sold up to the first converter.
Scope exclusion: recycled or re-bonded scrap and downstream finished articles such as mattresses, footwear, or molded car seats are not included.
Segmentation Overview
- By Type
- Rigid Foam
- Flexible Foam
- CASE (Coatings, Adhesives, Sealants and Elastomers)
- Thermoplastic Polyurethane (TPU)
- Other Types
- By Raw Material
- Methylene Diphenyl Di-isocyanate (MDI)
- Toluene Di-isocyanate (TDI)
- Polyether Polyols
- Polyester Polyols
- Others (Bio-based Polyols)
- By End-user Industry
- Furniture
- Building and Construction
- Electronics and Appliances
- Automotive
- Footwear
- Packaging
- Other End-user Industries
- By Geography
- Asia-Pacific
- China
- India
- Japan
- South Korea
- ASEAN
- Rest of Asia-Pacific
- North America
- United States
- Canada
- Mexico
- Europe
- Germany
- United Kingdom
- France
- Italy
- Spain
- Nordics
- Russia
- Rest of Europe
- South America
- Brazil
- Argentina
- Rest of South America
- Middle East and Africa
- Saudi Arabia
- United Arab Emirates
- South Africa
- Nigeria
- Rest of Middle East and Africa
- Asia-Pacific
Detailed Research Methodology and Data Validation
Primary Research
Mordor analysts supplement desk work with interviews and short surveys of resin formulators, foam fabricators, and procurement leads across Asia-Pacific, North America, Europe, and the Middle East. These interactions validate regional price spreads, substitution trends, and near-term order books that statistics alone cannot reveal.
Desk Research
We begin with open, tier-1 datasets, including UN Comtrade trade codes for MDI, TDI, and polyols, Eurostat PRODCOM output tables, US EIA feedstock curves, OECD and China NBS construction indices, and OICA vehicle assembly counts. Annual reports, 10-Ks, and investor decks from leading producers, plus news captured through Dow Jones Factiva, clarify capacity shifts. Patent searches via Questel and dashboards from PlasticsEurope and the American Chemistry Council anchor technology uptake and demand pools. These examples illustrate, yet do not exhaust, the secondary sources consulted.
Market-Sizing & Forecasting
We rebuild demand through a top-down model that reconciles regional resin production and net trade, then balances them with end-use intensity ratios refined via primary calls. Targeted bottom-up checks, such as average selling price multiplied by sampled foam volumes, calibrate totals. Key variables feeding our multivariate regression include MDI/TDI operating rates, housing starts, light-vehicle assemblies, furniture exports, and insulation thickness mandates. Scenario analysis frames upside and downside paths, while any data gaps are bridged with weighted geographic analogs.
Data Validation & Update Cycle
Outputs pass variance screens, peer cross-checks, and a two-step internal review. We refresh each model annually, with interim updates after material events such as major plant shutdowns.
Why Mordor's Polyurethane Baseline Earns Dependability
Published estimates often diverge because firms vary product boundaries, price assumptions, and refresh cadence.
Our disciplined scope setting and yearly update keep Mordor's 2025 baseline of USD 87.48 billion grounded in observable trade and production signals.
Benchmark comparison
| Market Size | Anonymized source | Primary gap driver |
|---|---|---|
| USD 87.48 B (2025) | Mordor Intelligence | - |
| USD 78.07 B (2024) | Global Consultancy A | CASE omitted; historic five-year average prices applied |
| USD 91.49 B (2024) | Industry Journal B | Recycled foam and seat imports counted |
| USD 89.82 B (2025) | Regional Consultancy C | Constant 2020 FX; GDP-only forecasting |
Taken together, while other publishers provide useful signals, Mordor's balanced mix of open statistics, expert validation, and transparent variable tracking yields a baseline decision-makers can retrace with confidence.
Need A Different Region or Segment?
Customize Now
Key Questions Answered in the Report
What is the current size of the polyurethane market?
The polyurethane market was valued at USD 87.48 billion in 2025 and is forecast to reach USD 113.84 billion by 2030.
Which region leads polyurethane consumption?
Asia-Pacific leads with 46% revenue share in 2024 and is growing fastest at 6.01% CAGR through 2030.
Why is flexible polyurethane foam so dominant?
Flexible foam owns 32% of polyurethane market share due to its comfort, compressibility, and rapid innovation in bedding, furniture, and automotive seating applications.
How are regulations influencing polyurethane formulations?
Proposed PFAS restrictions in Europe and new phthalate limits in China are driving reformulation toward additive-free or bio-based systems, affecting supply chains over the next four years.
What role do bio-based polyols play in future growth?
Bio-based polyols represent the fastest-growing raw-material segment at 6.90% CAGR, spurred by large-scale CO₂ conversion plants and rising demand for low-carbon products.
Page last updated on:


