Market Overview
| Study Period | 2017 - 2030 |
|---|---|
| Base Year For Estimation | 2024 |
| Forecast Data Period | 2025 - 2030 |
| Market Size (2025) | USD 37.12 Billion |
| Market Size (2030) | USD 58.19 Billion |
| Growth Rate (2025 - 2030) | 9.41% CAGR |
| Market Concentration | Low |
Major Players*Disclaimer: Major Players sorted in no particular order Image © Mordor Intelligence. Reuse requires attribution under CC BY 4.0. |
|

Asia-Pacific Pet Food Market Analysis by Mordor Intelligence
The Asia-Pacific Pet Food Market size is estimated at 37.12 billion USD in 2025, and is expected to reach 58.19 billion USD by 2030, growing at a CAGR of 9.41% during the forecast period (2025-2030).
The Asia-Pacific pet food industry is experiencing a fundamental shift in consumer behavior, driven by the growing trend of pet humanization, where pets are increasingly considered integral family members. This transformation is particularly evident in the region's substantial pet population, which reached 511.1 million in 2022, reflecting changing social dynamics and lifestyle preferences. The rise of nuclear families, increasing urbanization, and growing disposable incomes have contributed to this trend, with younger generations, particularly millennials and Gen Z, emerging as primary pet parents. Pet owners are increasingly seeking premium and specialized nutrition options, moving away from traditional home-cooked meals towards commercially prepared pet food products that offer complete and balanced nutrition.
The market is witnessing significant product innovation and premiumization trends, with manufacturers focusing on developing specialized nutrition solutions. In 2023, several major companies launched innovative products, including Hill's Pet Food Nutrition's introduction of MSC-certified pollock and insect protein products for pets with sensitive stomachs, and Wellness Pet Food Company's launch of new supplement lines designed for dogs' overall well-being. These developments reflect the growing consumer demand for high-quality, sustainable, and functionally enhanced pet food products. The industry is also seeing increased interest in natural ingredients, grain-free options, and products addressing specific health conditions.
The distribution landscape is evolving rapidly, with e-commerce emerging as a crucial channel for pet food sales. Online platforms are gaining prominence due to their convenience, wider product selection, and competitive pricing. Specialty stores continue to play a vital role, particularly in premium product segments, offering expert guidance and customized solutions for pet owners. The market is also witnessing the emergence of pet-specific retail concepts, including pet cafes and specialized pet stores that combine product sales with services, creating comprehensive pet care ecosystems.
Major industry players are strengthening their regional presence through strategic investments in manufacturing and research capabilities. Mars Incorporated's establishment of its first pet food research and development center in Asia-Pacific in 2023 exemplifies this trend, while Nestlé Purina's expansion of its wet cat food manufacturing facility in Thailand with an investment of approximately USD 144.2 million demonstrates the industry's commitment to regional growth. These investments are accompanied by efforts to develop locally relevant products that cater to specific regional preferences and nutritional requirements, while maintaining international quality standards and incorporating global best practices in pet food nutrition.
Asia-Pacific Pet Food Market Trends and Insights
A new purchase ecosystem is evolving in the region, such as pet cafes and pet stores, providing assistance from purchasing to taking care of the animals through a wide variety of cat food products and services driving population of cats
- In Asia-Pacific, cats have a lower share compared to dogs, and they accounted for 26.1% of the pet population in 2022. Countries such as China, India, and Australia have witnessed an increase in pet ownership due to health benefits such as feeling relaxed and less stressed and considering them as their companions. Therefore, the cat population as a pet increased by 0.28% between 2017 and 2022.
- Cat parents are higher than dog parents in countries such as Indonesia and Malaysia. In Indonesia and Malaysia, it accounted for 47% and 34%, respectively, in 2021 because of the religious culture of these countries, and they prefer to adopt cats as pets than dogs. This will help the companies to invest more in cat food in these countries than dog food. In China, there has been an increase in the number of pets, including cats, in urban areas, and the pet population, including cats, increased by 10.2% between 2018 and 2020 to reach a pet population of 100.8 million in urban areas in 2020. Moreover, the cat population increased from 74.4 million in 2020 to 82.5 million in 2022 because of a rise in companionship during the pandemic. Also, it will have long-term effects as the life span of cats is more than 20 years.
- A new pet adoption and purchase ecosystem is evolving in the region as there are pet cafes and pet stores providing assistance from purchasing to taking care of the animals through a wide variety of pet food products and services. For instance, in Vietnam, The Meow House by R House is a cat cafe that serves vegetarian and vegan food and is a home for cats. Factors such as the rise in the adoption of cats due to health benefits, the culture of the Asia-Pacific, and changes in the pet ecosystem help in enhancing cat adoption in the region.

Understand The Key Trends Shaping This Market
Download PDF
Increased demand for premium products for dogs, such as grain-free and natural products, is increasing pet expenditure
- In Asia-Pacific, there has been a rise in pet expenditure because of factors such as an increase in pet humanization leading to the feeding of pets with commercial pet food, availability of different types of pet food, and pet parents preferring good quality premium pet food as they are willing to pay premium prices. Moreover, pet dogs have a higher expenditure share as they accounted for 38.1% of the pet expenditure in 2022 because dog owners feed them high-quality pet food and higher consumption of food by dogs compared to other pets. For instance, in Australia, dog food accounted for 40% of the country's pet expenditure in 2022 as dogs are most popular in Australia, and about 40% of the households had a pet dog in 2022, which increased the demand for premium products for dogs such as grain-free products and natural products.
- China, India, and South Korea are the major pet markets in the region, as there has been growth in pet expenditure. These countries have witnessed a high number of pets being fed good quality premium pet food, especially after the pandemic, as they are more aware of the nutritional requirement for their pet's good health. For instance, in the Hong Kong cat food market, the premium pet food segment accounted for 75% of the pet food sales in 2022. There are high online sales of pet food, especially in China, due to the vast number of products available on the website and easy to order. For instance, in 2022, China's pet sales from online channels were 58.3% compared to the pet stores channel's contribution of 28.1%.
- The rising demand for pet food and growing awareness about good quality food for their pets has increased the pet expenditure by pet parents in the region during the study period.

Understand The Key Trends Shaping This Market
Download PDF
OTHER KEY INDUSTRY TRENDS COVERED IN THE REPORT
- The higher life span and the evolution of the pet ecosystem are helping in the growth of the dog population as pets in the region
- Fish is one of the most adopted other pets in the region
Segment Analysis: PET FOOD PRODUCT
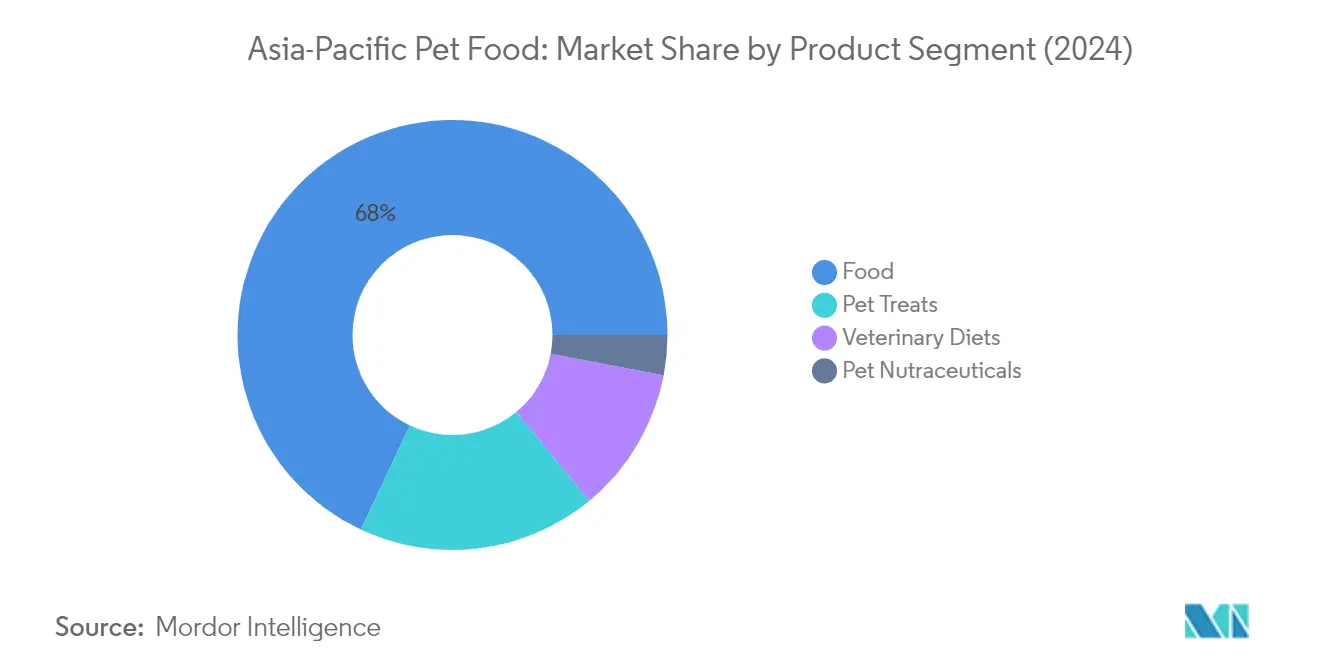
Food Segment in Asia-Pacific Pet Food Market
The pet food segment maintains its dominant position in the Asia-Pacific pet food market, commanding approximately 68% market share in 2024. This substantial market presence is primarily driven by the segment's role in providing daily dietary requirements for pets, as the majority of pet parents have shifted toward commercial pet food products. The segment's strength is particularly evident in dry pet food, which accounts for nearly 67% of the food texture market segment, owing to its convenience, longer shelf life, and cost-effectiveness. The segment's growth is further supported by increasing pet humanization trends across the region, where pets are increasingly considered integral family members, leading to higher demand for premium and quality pet food products.
Pet Treats Segment in Asia-Pacific Pet Food Market
The pet treats segment is emerging as the most dynamic category in the Asia-Pacific pet food market, projected to grow at approximately 11% during 2024-2029. This remarkable growth trajectory is driven by multiple factors, including the increasing use of treats for training purposes, dental health maintenance, and strengthening the bond between pets and their owners. The segment's expansion is particularly notable in emerging markets like China and India, where pet owners are increasingly recognizing the importance of treats in pet care routines. The growth is further supported by innovations in treat formulations, including dental treats, functional treats with added health benefits, and premium treats made with natural ingredients.
Remaining Segments in Pet Food Product Market
The pet food market's landscape is further shaped by pet veterinary diets and pet nutraceuticals/supplements segments, each serving distinct market needs. Pet veterinary diets play a crucial role in managing various medical conditions in pets, offering specialized nutrition for specific health requirements such as digestive sensitivity, diabetes, and urinary tract health. Meanwhile, the pet nutraceuticals segment focuses on preventive health care, offering products like omega-3 fatty acids, probiotics, and vitamins that support overall pet wellness. Both segments are gaining increasing importance as pet owners become more health-conscious and seek specialized nutrition solutions for their pets' specific needs.
Segment Analysis: PETS
Dogs Segment in Asia-Pacific Pet Food Market
Dogs represent the dominant segment in the Asia-Pacific pet food market, accounting for approximately 48% of the total market value in 2024. This significant market share is primarily attributed to the larger dog population compared to other pets in the region, with dogs making up about 34% of the total pet population. The segment's dominance is further strengthened by dogs' higher consumption rate of pet food compared to other pets, along with their specific dietary requirements and nutritional needs. The increasing trend of pet humanization, particularly in countries like China, Japan, and Australia, has led to growing demand for premium dog food products, including specialized formulations for different life stages, breeds, and health conditions.
Cats Segment in Asia-Pacific Pet Food Market
The cats segment is emerging as the fastest-growing category in the Asia-Pacific pet food market, projected to expand at approximately 10% CAGR from 2024 to 2029. This robust growth is driven by several factors, including the increasing preference for cats as pets in urban areas due to their adaptability to smaller living spaces. The segment's growth is particularly notable in countries like Indonesia and Malaysia, where cultural factors favor cat ownership. The rising awareness about specialized nutrition for cats, particularly the importance of wet food due to their lower water intake, is driving product innovation and market expansion. Additionally, the growing trend of premium and specialized cat food products, including those addressing specific health concerns and life stages, is contributing to the segment's accelerated growth trajectory.
Remaining Segments in PETS
The other pets segment, which includes fish, birds, and small animals, plays a significant role in shaping the Asia-Pacific pet food market dynamics. This segment is particularly strong in countries like Australia, where fish ownership significantly exceeds both cat and dog populations. The segment benefits from the growing trend of keeping exotic pets and the increasing preference for low-maintenance pets in urban settings. These pets often require specialized nutrition, driving innovation in food formulations specific to different species. The segment is characterized by diverse dietary requirements and feeding patterns, leading to a wide range of specialized food products catering to various species' unique nutritional needs.
Segment Analysis: DISTRIBUTION CHANNEL
Specialty Stores Segment in Asia-Pacific Pet Food Market
Specialty stores represent the dominant distribution channel in the Asia-Pacific pet food market, accounting for approximately 18% of the total market value in 2024. These stores have established themselves as preferred destinations for pet owners due to their comprehensive product offerings and specialized expertise. The success of specialty stores can be attributed to their ability to provide diverse varieties of pet food formulations that meet specific needs and requirements of pets, along with expert guidance on food purchases and feeding instructions. Additionally, these stores offer customized products based on customer needs and maintain strong relationships with premium pet food brands, ensuring access to high-quality products. The presence of knowledgeable staff who can provide detailed product information and recommendations has also contributed significantly to their market leadership.
Online Channel Segment in Asia-Pacific Pet Food Market
The online channel is experiencing remarkable growth in the Asia-Pacific pet food market, projected to expand at approximately 12% CAGR from 2024 to 2029. This substantial growth is driven by several factors, including the increasing digitalization of retail, growing e-commerce penetration, and changing consumer preferences toward convenient shopping options. The channel's success is further bolstered by features such as competitive pricing, extensive product selection, easy comparison capabilities, and doorstep delivery services. The presence of well-established e-commerce platforms like Amazon, Doggyhouse, and Vivapets has strengthened the online distribution network. Additionally, the subscription model offered by many online platforms, which enables automatic deduction of subscription fees, particularly appeals to urban pet parents with busy lifestyles.
Remaining Segments in Distribution Channel
The other significant distribution channels in the Asia-Pacific pet food market include supermarkets/hypermarkets, convenience stores, and other channels such as veterinary clinics and pet shelters. Supermarkets and hypermarkets maintain a strong presence due to their ability to offer pet food products alongside regular household items, making shopping more convenient for consumers. Convenience stores, while having a smaller market share, serve an important role in providing easy access to pet food products with extended operating hours and quick checkout services. The other channels segment, comprising veterinary clinics, pet shelters, and feed stores, plays a crucial role in serving specific customer segments and providing specialized products and services to pet owners.
Asia-Pacific Pet Food Market Geography Segment Analysis
Pet Food Market in China
China dominates the Asia-Pacific pet food market, holding approximately 33% market share in 2024. The country's pet food market is characterized by a strong shift towards premium and high-quality products, particularly in urban areas where pet humanization is most prevalent. The market is witnessing significant transformation with increasing demand for both dry and wet pet food options, with dry food maintaining dominance due to its convenience and longer shelf life. E-commerce platforms have become crucial distribution channels, offering a wide range of products and contributing to market accessibility. The country's pet food industry is also seeing growing demand for specialized products, including veterinary diets and nutraceuticals, reflecting increased awareness of pet health and wellness. Local manufacturers are expanding their production capabilities while international brands are strengthening their presence through various market strategies. The trend towards natural and organic ingredients is gaining momentum, particularly among younger pet owners who prioritize their pets' health and nutrition.
Pet Food Market in the Philippines
The Philippines represents one of the most dynamic markets in the Asia-Pacific region, projected to grow at approximately 19% annually from 2024 to 2029. The market is experiencing a remarkable transformation driven by changing consumer preferences and increasing pet ownership among urban households. Pet humanization is becoming increasingly prevalent, with pet owners treating their animals as family members and investing more in their nutrition and well-being. The country's pet food market is witnessing significant developments in product innovation, particularly in premium segments and specialized nutrition categories. Local retailers are expanding their pet food sections, while international brands are increasing their presence through various distribution channels. The market shows strong potential in both dry and wet food segments, with growing interest in treats and supplements. Urban areas are leading this growth trajectory, with Manila and other major cities showing particularly strong demand for premium pet food products. The rise of pet-focused social media influence is also playing a crucial role in shaping consumer preferences and driving market growth.
Pet Food Market in Japan
Japan's pet food market exemplifies sophistication and premium quality, characterized by highly discerning consumers who prioritize their pets' health and wellness. The market demonstrates a strong preference for premium and super-premium products, reflecting the country's overall approach to pet care. Japanese pet owners are particularly interested in functional foods and specialized nutrition, driving innovation in areas such as age-specific formulations and health-targeted products. The country's aging pet population has created unique market opportunities, with increased demand for senior pet nutrition and specialized dietary requirements. Urban pet owners in Japan show strong interest in natural and organic ingredients, leading to the development of numerous premium product lines. The market features a robust distribution network, with both traditional retail channels and e-commerce platforms playing significant roles. Japanese consumers' attention to product safety and quality has resulted in stringent standards for pet food manufacturers, contributing to the market's premium positioning.
Pet Food Market in Australia
Australia's pet food market is characterized by sophisticated consumer preferences and a strong emphasis on natural and premium products. The market shows significant maturity in terms of product diversity and consumer awareness, with pet owners increasingly focusing on health-conscious choices for their companions. Australian pet food manufacturers are responding to growing demand for locally sourced ingredients and environmentally sustainable packaging options. The market features a strong presence of both domestic and international brands, creating a competitive environment that drives innovation and quality improvements. Pet specialty stores play a crucial role in the market, offering expert advice and premium product selections. The trend towards customized nutrition solutions is gaining momentum, with an increasing focus on breed-specific and lifestyle-based formulations. Urban areas demonstrate particularly strong demand for premium and super-premium pet food products, while rural regions show growing adoption of commercial pet food options.
Pet Food Market in Other Countries
The pet food markets in other Asia-Pacific countries, including South Korea, Taiwan, Vietnam, Thailand, Malaysia, Indonesia, and Singapore, each present unique characteristics and growth opportunities. These markets are at various stages of development, with some showing rapid modernization in pet food preferences while others are still in the early stages of transitioning from traditional feeding practices to commercial pet food. Urban areas in these countries are leading the adoption of premium pet food products, while rural regions show growing awareness and a gradual shift towards commercial options. The pet humanization trend is increasingly evident across these markets, though to varying degrees. International brands are expanding their presence in these countries, while local manufacturers are developing products tailored to regional preferences. The rise of e-commerce is particularly significant in these markets, providing improved access to a wider range of pet food products. These countries also show growing interest in specialized nutrition and premium products, though price sensitivity remains a significant factor in purchasing decisions.
Get Analysis on Important Geographic Markets
Download PDF
Competitive Landscape
Top Companies in Asia-Pacific Pet Food Market
The competitive landscape is characterized by major players like Mars Incorporated, Nestlé (Purina), Colgate-Palmolive Company, ADM, and General Mills Inc. actively shaping market dynamics through various strategic initiatives. Companies are heavily investing in product innovation, particularly focusing on developing premium, natural, and specialized pet food products to meet evolving consumer preferences and health requirements. Operational agility is demonstrated through the expansion of manufacturing facilities, especially in key markets like China, Thailand, and India, enabling companies to better serve regional demands and optimize supply chains. Strategic partnerships with veterinary clinics, research institutions, and local distributors have become increasingly common to enhance market presence and product development capabilities. Companies are also emphasizing sustainability initiatives, including sustainable packaging solutions and responsible sourcing practices, while simultaneously expanding their distribution networks through both traditional and digital channels.
Market Dominated by Global Conglomerates and Specialists
The Asia-Pacific pet food market exhibits a moderately fragmented structure, with a mix of global conglomerates and regional specialists competing for market share. Global players leverage their extensive research capabilities, established brand portfolios, and sophisticated distribution networks to maintain their market positions, while regional players capitalize on their local market knowledge and ability to cater to specific regional preferences. The market is characterized by a strong presence of multinational companies that have established manufacturing facilities across key markets, enabling them to maintain competitive pricing and ensure product availability.
The industry has witnessed significant merger and acquisition activity, with larger companies acquiring smaller, specialized pet food manufacturers to expand their product portfolios and geographical presence. These strategic acquisitions have helped companies gain access to new market segments, particularly in the premium and natural pet food categories. Companies are also forming strategic alliances with local players to strengthen their distribution networks and enhance their understanding of regional market dynamics. The competitive intensity is further amplified by the entry of new players, particularly in emerging markets, who are introducing innovative products and leveraging digital platforms for market penetration.
Innovation and Regional Presence Drive Success
For incumbent companies to maintain and increase their market share, focusing on product innovation and premiumization remains crucial. Successful strategies include developing specialized nutrition solutions, expanding product lines to address specific health concerns, and investing in research and development to create innovative formulations. Companies must also strengthen their distribution networks, particularly in emerging markets, while simultaneously building strong relationships with veterinarians and pet care professionals. Digital transformation initiatives, including e-commerce platforms and direct-to-consumer channels, are becoming increasingly important for market success.
For contenders looking to gain ground, differentiation through specialized product offerings and focus on underserved market segments presents significant opportunities. Success factors include developing strong local partnerships, investing in regional manufacturing capabilities, and creating products that cater to specific regional preferences and price points. Companies must also consider potential regulatory changes, particularly regarding pet food safety standards and labeling requirements, while building robust quality control systems. The growing trend of pet humanization and increasing focus on pet health presents opportunities for companies to develop innovative products, while the risk of substitution remains relatively low due to the increasing preference for commercial pet food market products over homemade alternatives.
Asia-Pacific Pet Food Industry Leaders
-
ADM
-
Colgate-Palmolive Company (Hill's Pet Nutrition Inc.)
-
General Mills Inc.
-
Mars Incorporated
-
Nestle (Purina)
- *Disclaimer: Major Players sorted in no particular order

Need More Details on Market Players and Competitors?
Download PDF
Recent Industry Developments
- July 2023: Hill's Pet Nutrition introduced its new MSC (Marine Stewardship Council) certified pollock and insect protein products for pets with sensitive stomachs and skin lines. They contain vitamins, omega-3 fatty acids, and antioxidants.
- May 2023: Nestle Purina launched new cat treats under the Friskies "Friskies Playfuls - treats" brand. These treats are round in shape and are available in chicken and liver and salmon and shrimp flavors for adult cats.
- April 2023: Mars Incorporated opened its first pet food research and development center in Asia-Pacific. This new facility, called the APAC pet center, will support the company's product development.
Asia-Pacific Pet Food Market Report Scope
Food, Pet Nutraceuticals/Supplements, Pet Treats, Pet Veterinary Diets are covered as segments by Pet Food Product. Cats, Dogs are covered as segments by Pets. Convenience Stores, Online Channel, Specialty Stores, Supermarkets/Hypermarkets are covered as segments by Distribution Channel. Australia, China, India, Indonesia, Japan, Malaysia, Philippines, Taiwan, Thailand, Vietnam are covered as segments by Country.
Pet Food Product
| Food | By Sub Product | Dry Pet Food | By Sub Dry Pet Food | Kibbles |
| Other Dry Pet Food | ||||
| Wet Pet Food | ||||
| Pet Nutraceuticals/Supplements | By Sub Product | Milk Bioactives | ||
| Omega-3 Fatty Acids | ||||
| Probiotics | ||||
| Proteins and Peptides | ||||
| Vitamins and Minerals | ||||
| Other Nutraceuticals | ||||
| Pet Treats | By Sub Product | Crunchy Treats | ||
| Dental Treats | ||||
| Freeze-dried and Jerky Treats | ||||
| Soft and Chewy Treats | ||||
| Other Treats | ||||
| Pet Veterinary Diets | By Sub Product | Derma Diets | ||
| Diabetes | ||||
| Digestive Sensitivity | ||||
| Obesity Diets | ||||
| Oral Care Diets | ||||
| Renal | ||||
| Urinary tract disease | ||||
| Other Veterinary Diets |
Pets
| Cats |
| Dogs |
| Other Pets |
Distribution Channel
| Convenience Stores |
| Online Channel |
| Specialty Stores |
| Supermarkets/Hypermarkets |
| Other Channels |
Geography
| Australia |
| China |
| India |
| Indonesia |
| Japan |
| Malaysia |
| Philippines |
| Taiwan |
| Thailand |
| Vietnam |
| Rest of Asia-Pacific |
| Pet Food Product | Food | By Sub Product | Dry Pet Food | By Sub Dry Pet Food | Kibbles |
| Other Dry Pet Food | |||||
| Wet Pet Food | |||||
| Pet Nutraceuticals/Supplements | By Sub Product | Milk Bioactives | |||
| Omega-3 Fatty Acids | |||||
| Probiotics | |||||
| Proteins and Peptides | |||||
| Vitamins and Minerals | |||||
| Other Nutraceuticals | |||||
| Pet Treats | By Sub Product | Crunchy Treats | |||
| Dental Treats | |||||
| Freeze-dried and Jerky Treats | |||||
| Soft and Chewy Treats | |||||
| Other Treats | |||||
| Pet Veterinary Diets | By Sub Product | Derma Diets | |||
| Diabetes | |||||
| Digestive Sensitivity | |||||
| Obesity Diets | |||||
| Oral Care Diets | |||||
| Renal | |||||
| Urinary tract disease | |||||
| Other Veterinary Diets | |||||
| Pets | Cats | ||||
| Dogs | |||||
| Other Pets | |||||
| Distribution Channel | Convenience Stores | ||||
| Online Channel | |||||
| Specialty Stores | |||||
| Supermarkets/Hypermarkets | |||||
| Other Channels | |||||
| Geography | Australia | ||||
| China | |||||
| India | |||||
| Indonesia | |||||
| Japan | |||||
| Malaysia | |||||
| Philippines | |||||
| Taiwan | |||||
| Thailand | |||||
| Vietnam | |||||
| Rest of Asia-Pacific | |||||
Need A Different Region or Segment?
Customize Now
Market Definition
- FUNCTIONS - Pet foods are usually intended to provide complete and balanced nutrition to the pet but are primarily used as functional products. The scope includes the food and supplements consumed by pets including veterinary diets. Supplements/nutraceuticals that are directly supplied to pets are considered within the scope.
- RESELLERS - Companies engaged in reselling of pet food without value addition have been excluded from the market scope, in order to avoid double counting.
- END CONSUMERS - Pet owners are considered to be the end-consumers in the market studied.
- DISTRIBUTION CHANNELS - Supermarkets/hypermarkets, specialty stores, convenience stores, online channels and other channels are considered within the scope. The stores which are exclusively providing pet related basic and custom products are considered within the scope of specialty stores.
| Keyword | Definition |
|---|---|
| Pet Food | The scope of pet food includes the food that is eatable by pets including food, treats, veterinary diets, and nutraceuticals/supplements. |
| Food | Food is animal feed intended for consumption by pets. It is formulated to provide essential nutrients and meet the dietary needs of various types of pets, including dogs, cats, and other animals. These are generally segmented into dry and wet pet foods. |
| Dry Pet Food | Dry pet foods may be extruded/baked (kibbles) or flaked. They have a lower moisture content, typically around 12-20%. |
| Wet Pet Food | Wet pet food, also known as canned pet food or moist pet food, generally has a higher moisture content compared to dry pet food, often ranging from 70-80%. |
| Kibbles | Kibbles are dry, processed pet food in small, bite-sized pieces or pellets. They are specifically formulated to provide balanced nutrition for various domestic animals, such as dogs, cats, and other animals. |
| Treats | Pet Treats are special food items or rewards given to pets, to show affection, and encourage good behavior. They are especially used during training. Pet treats are made from various combinations of meat or meat-derived materials with other ingredients. |
| Dental Treats | Pet dental treats are specialized treats that are formulated to promote good oral hygiene in pets. |
| Crunchy Treats | It is a type of pet treat that has a firm and crispy texture which can be a good source of nutrition for pets. |
| Soft and chewy treats | Soft and Chewy pet treats are a type of pet food product that is formulated to be easy to chewy and digest. They are usually made from soft and pliable ingredients, such as meat, poultry, or vegetables, that have been blended and formed into bite-sized pieces or strips. |
| Freeze-dried & Jerky Treats | Freeze-dried and jerky treats are snacks given to pets, that are prepared through a special preservation process, without damaging the nutritional content, resulting in long-lasting, nutrient-rich treats. |
| Urinary Tract Disease Diets | These are commercial diets that are specifically formulated to promote urinary health and reduce the risk of urinary tract infections and other urinary problems. |
| Renal Diets | These are specialized pet foods formulated to support the health of pets with kidney disease or renal insufficiency. |
| Digestive Sensitivity Diets | Digestive-sensitive diets are specially formulated to meet the nutritional needs of pets with digestive issues such as food intolerances, allergies, and sensitivities. These diets are designed to be easily digestible and to reduce the symptoms of digestive problems in pets. |
| Oral Care Diets | Oral care diets for pets are specially formulated diets produced to promote oral health and hygiene in pets. |
| Grain-Free Pet Food | Pet food that does not contain common grains like wheat, corn, or soy. Grain-free diets are often preferred by pet owners seeking alternative options or if their pets have specific dietary sensitivities. |
| Premium Pet Food | High-quality pet food formulated with superior ingredients often offers additional nutritional benefits compared to standard pet food. |
| Natural Pet Food | Pet food made from natural ingredients, with minimal processing and without artificial preservatives. |
| Organic Pet Food | Pet food is produced using organic ingredients, free from synthetic pesticides, hormones, and genetically modified organisms (GMOs). |
| Extrusion | A manufacturing process used to produce dry pet food, where ingredients are cooked, mixed, and shaped under high pressure and temperature. |
| Other Pets | Other pets include birds, fish, rabbits, hamsters, ferrets, and reptiles. |
| Palatability | The taste, texture, and aroma of pet food influence its appeal and acceptance by pets. |
| Complete and Balanced Pet Food | Pet food that provides all essential nutrients in appropriate proportions to meet the nutritional needs of pets without additional supplementation. |
| Preservatives | These are the substances that are added to pet food to extend its shelf life and prevent spoilage. |
| Nutraceuticals | Food products that offer health benefits beyond basic nutrition, often contain bioactive compounds with potential therapeutic effects. |
| Probiotics | Live beneficial bacteria that promote a healthy balance of gut flora, supporting digestive health and immune function in pets. |
| Antioxidants | Compounds that help neutralize harmful free radicals in the body, promoting cellular health and supporting the immune system in pets. |
| Shelf-Life | The duration of which pet food remains safe and nutritionally viable for consumption after its production date. |
| Prescription diet | Specialized pet food formulated to address specific medical conditions under veterinary supervision. |
| Allergen | A substance that can cause allergic reactions in some pets, leading to food allergies or sensitivities. |
| Canned food | Wet pet food that is packed in cans and contains higher moisture content than dry food. |
| Limited ingredient diet (LID) | Pet food formulated with a reduced number of ingredients to minimize potential allergens. |
| Guaranteed Analysis | The minimum or maximum levels of certain nutrients present in pet food. |
| Weight management | Pet food designed to help pets maintain a healthy weight or support weight loss efforts. |
| Other Nutraceuticals | It includes prebiotics, antioxidants, digestive fiber, enzymes, essential oils and herbs. |
| Other Veterinary Diets | It includes weight management diets, skin and coat health, cardiac care, and joint care. |
| Other Treats | It includes rawhides, mineral blocks, lickables, and catnips. |
| Other Dry Foods | It includes cereal flakes, mixers, meal toppers, freeze-dried foods, and air-dried foods. |
| Other Animals | It includes birds, fish, reptiles, and small animals (rabbits, ferrets, hamsters). |
| Other Distribution Channels | It includes veterinary clinics, local unregulated stores, and feed and farm stores. |
| Proteins and Peptides | Proteins are large molecules composed of basic units called amino acids which help in the growth and development of pets. Peptides are the short string of 2 to 50 amino acids. |
| Omega-3 fatty acids | Omega-3 fatty acids are essential polyunsaturated fats that play a crucial role in the overall health and well-being of Pets |
| Vitamins | Vitamins are the essential organic compounds that are essential for vital physiological functioning. |
| Minerals | Minerals are naturally occurring inorganic substances that are essential for various physiological functions in pets. |
| CKD | Chronic Kidney Disease |
| DHA | Docosahexaenoic Acid |
| EPA | Eicosapentaenoic Acid |
| ALA | Alpha-linolenic Acid |
| BHA | Butylated Hydroxyanisol |
| BHT | Butylated Hydroxytoluene |
| FLUTD | Feline Lower Urinary Tract Disease |
Need More Details on Market Definition?
Ask a Question
Research Methodology
Mordor Intelligence follows a four-step methodology in all our reports.
- Step-1: IDENTIFY KEY VARIABLES: In order to build a robust forecasting methodology, the variables and factors identified in Step-1 are tested against available historical market numbers. Through an iterative process, the variables required for market forecast are set and the model is built on the basis of these variables.
- Step-2: Build a Market Model: Market-size estimations for the forecast years are in nominal terms. Inflation is not a part of the pricing, and the average selling price (ASP) is kept constant throughout the forecast period.
- Step-3: Validate and Finalize: In this important step, all market numbers, variables and analyst calls are validated through an extensive network of primary research experts from the market studied. The respondents are selected across levels and functions to generate a holistic picture of the market studied.
- Step-4: Research Outputs: Syndicated Reports, Custom Consulting Assignments, Databases & Subscription Platforms

Get More Details On Research Methodology
Download PDF


