Market Overview
| Study Period | 2019 - 2030 |
|---|---|
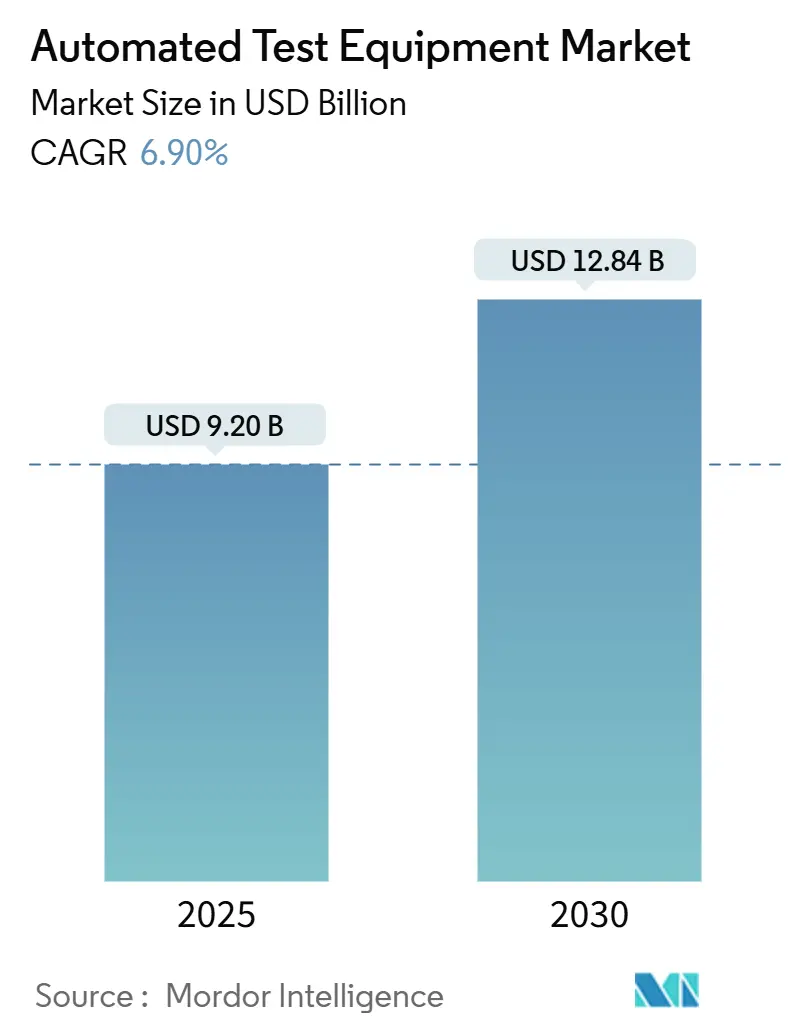
| Market Size (2025) | USD 9.20 Billion |
| Market Size (2030) | USD 12.84 Billion |
| Growth Rate (2025 - 2030) | 6.90% CAGR |
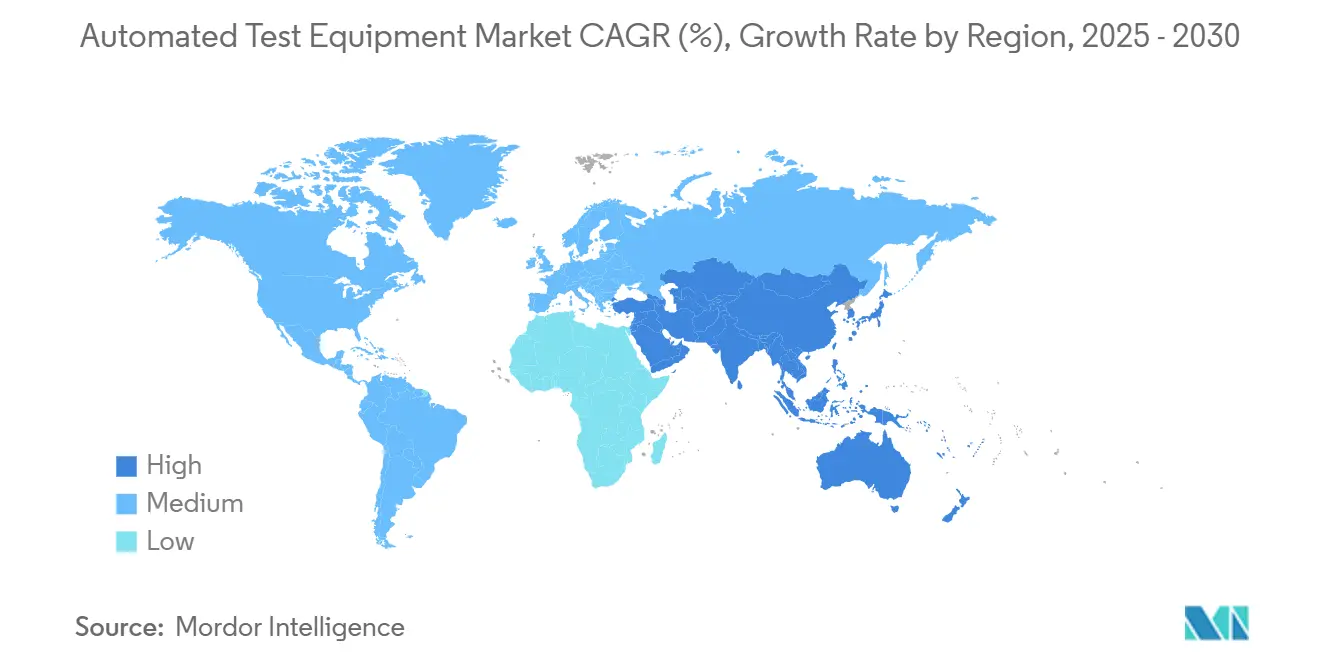
| Fastest Growing Market | Middle East and Africa |
| Largest Market | Asia Pacific |
| Market Concentration | Medium |
Major Players
*Disclaimer: Major Players sorted in no particular order Image © Mordor Intelligence. Reuse requires attribution under CC BY 4.0. |
|
Automated Test Equipment Market Analysis by Mordor Intelligence
The Automated Test Equipment market size was valued at USD 9.20 billion in 2025 and is projected to climb to USD 12.84 billion by 2030, advancing at a 6.9% CAGR. Demand is propelled by the migration to sub-5 nm nodes, the electrification of vehicles, and the rising complexity of System-in-Package designs. Manufacturers are channelling capital toward ultra-low-noise platforms able to measure below 10 nV/√Hz, while power-device specialists are specifying testers that safely apply in excess of 1,200 V stresses. Equipment vendors are simultaneously integrating real-time data analytics to shorten debug cycles and improve yield learning. Consolidation among leading suppliers continues, yet innovative mid-tier companies are targeting niche growth pockets such as wafer-level burn-in for AI accelerators and photonics device reliability validation.
Automated Test Equipment Market
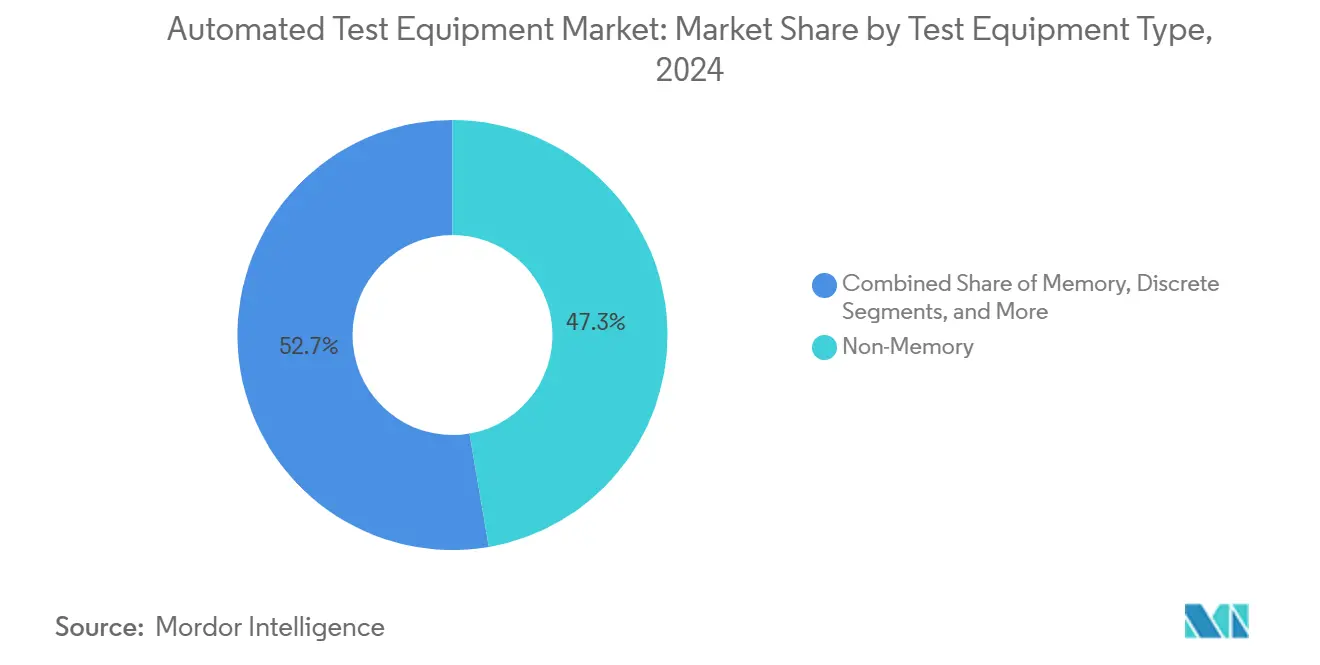
- By test equipment type, non-memory platforms led with 47.3% of Automated Test Equipment market share in 2024; system-level testers are forecast to expand at 13.7% CAGR through 2030.
- By component, tester mainframes captured 56.4% revenue in 2024, while system-level/burn-in racks are poised for the fastest 12.9% CAGR to 2030.
- By test stage, package/final testing accounted for 61.4% share of the Automated Test Equipment market size in 2024; system-level testing is projected to climb at 13.7% CAGR to 2030.
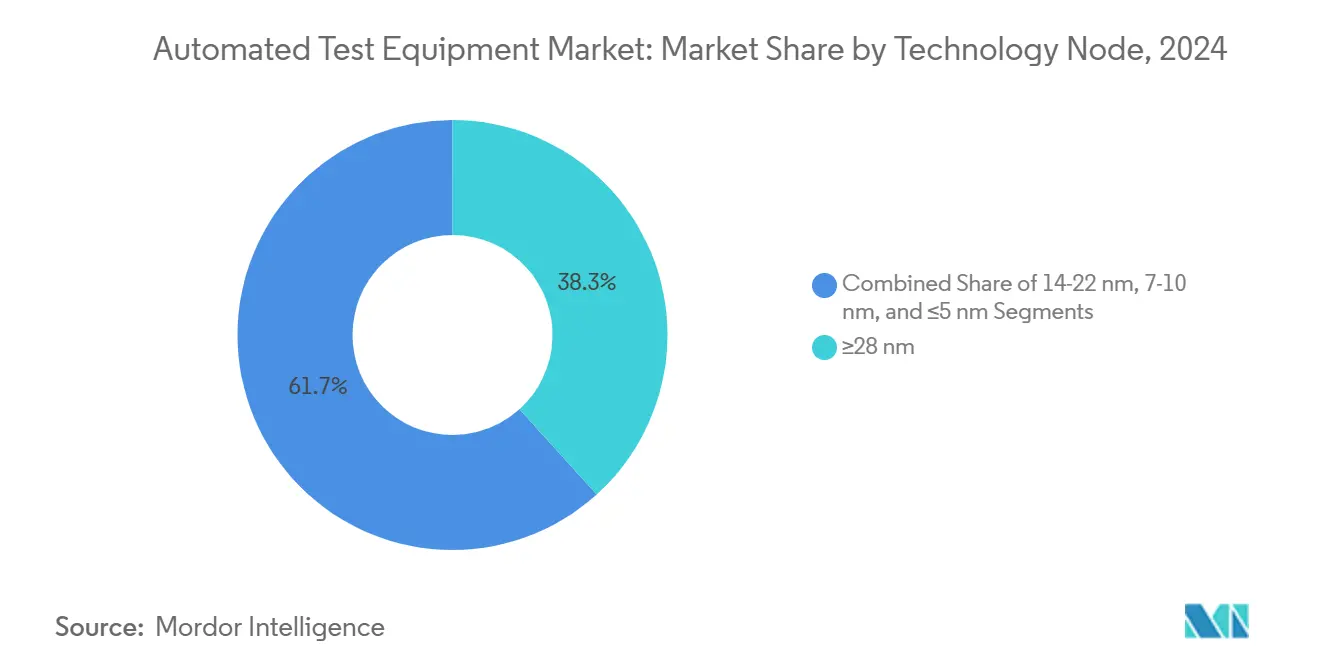
- By technology node, the ≥28 nm tier retained 38.3% of revenue in 2024; ≤5 nm platforms are projected to surge at 15.8% CAGR from 2025 to 2030.
- By end-user industry, consumer electronics held 39.3% share in 2024, whereas automotive and EV applications are advancing at 12.2% CAGR through 2030.
- By geography, Asia-Pacific commanded 62.4% of revenue in 2024; the Middle East and Africa region is anticipated to post a 9.1% CAGR between 2025 and 2030.
Global Automated Test Equipment Market Trends and Insights
Drivers Impact Analysis
| Driver | (~) % Impact on CAGR Forecast | Geographic Relevance | Impact Timeline |
|---|---|---|---|
| Shrinking <7 nm Nodes Requiring Ultra-Low Noise ATE | +2.1% | Asia-Pacific, North America | Medium term (2-4 years) |
| Automotive Functional-Safety IC Testing (ISO 26262) Surge in EU | +1.8% | Europe, North America | Long term (≥ 4 years) |
| SiC / GaN Power Devices Driving High-Voltage Discrete ATE | +1.5% | Global, with emphasis on Asia-Pacific | Medium term (2-4 years) |
| Growth of System-in-Package (SiP) Fuelling System-Level Testers | +1.3% | Asia-Pacific, North America | Medium term (2-4 years) |
| 5G / 6G RF Front-End Complexity in Asia | +1.0% | Asia-Pacific, North America | Short term (≤ 2 years) |
| Reshoring Incentives (US CHIPS, EU Chips Acts) Expanding Test Capacity | +0.8% | North America, Europe | Long term (≥ 4 years) |
| Source: Mordor Intelligence | |||
| Source: Mordor Intelligence | |||
Shrinking <7 nm Nodes Requiring Ultra-Low-Noise ATE
Sub-7 nm production ramp-ups in Taiwan and South Korea have mandated measurement precision below 10 nV/√Hz and picosecond-level timing. Leading foundries have responded by qualifying new vector-parallel architectures that suppress crosstalk through enhanced shielding and optimized ground referencing. Tool suppliers are pairing these designs with machine-learning-driven pattern generation to compress characterization loops, a feature now standard on flagship SoC platforms.[1]Nanomaterials Editorial Board, “Advanced CMOS Technology,” MDPI, mdpi.com
Automotive Functional-Safety IC Testing Surge (ISO 26262)
European Tier-1 semiconductor vendors increased deployments of fault-injection-capable testers by 34% between 2024 and 2025. The equipment executes hundreds of safety-goal permutations, mapping results back to requirements-traceability matrices. Integration with hardware-in-the-loop benches enables simultaneous verification of powertrain inverters, radar sensors, and MCU subsystems, ensuring ASIL-D compliance at scale.
SiC / GaN Power Devices Driving High-Voltage Discrete ATE
Wide-bandgap components for traction inverters and solar inverters demand characterization at up to 1,200 V and 150 °C. New discrete testers incorporate isolated Kelvin connections, automated hot-switch cycling, and calorimetric thermal-impedance extraction. Reliability protocols derived from GaN lifetime studies now form standard burn-in recipes for automotive qualification.
Growth of System-in-Package Fuelling System-Level Testers
Heterogeneous packages blending RF transceivers, SRAM stacks, and PMICs require concurrent mixed-domain evaluation. System-level racks, therefore, integrate multi-site RF shield boxes, high-speed digital interfaces, and thermal-stream air hooks inside a single frame. Smartphone and IoT OEMs have migrated over 40% of final-test volume to such racks since late 2024 to capture latent assembly faults that parametric screens miss.
Restraints Impact Analysis
| Restraint | (~) % Impact on CAGR Forecast | Geographic Relevance | Impact Timeline |
|---|---|---|---|
| High Capital Intensity and Lengthy Pay-back for Sub-5 nm Testers | -1.2% | Global | Medium term (2-4 years) |
| On-Chip BIST Reducing External Digital ATE Demand | -0.9% | Global | Long term (≥ 4 years) |
| Limited Inter-Vendor Interface Interoperability | -0.7% | Global | Medium term (2-4 years) |
| Cyclical Semiconductor CAPEX Cuts | -0.8% | Global, with emphasis on Asia-Pacific | Short term (≤ 2 years) |
| Source: Mordor Intelligence | |||
| Source: Mordor Intelligence | |||
High Capital Intensity and Lengthy Pay-Back for Sub-5 nm Testers
Platform prices rose 35% versus the 7 nm generation, stretching ROI beyond five years for mid-tier fabs. The need for ultra-stable low-k dielectric probing, advanced thermal regulation, and multi-terabit pattern memory inflates both acquisition and service costs, tempering adoption rates among smaller foundries.
On-Chip BIST Reducing External Digital ATE Demand
Modern SoCs routinely include logic and memory self-test engines delivering 98% fault coverage during wafer sort. Consequently, wafer-level external vector counts for digital patterns fell by double digits in 2024, redirecting capex toward RF, mixed-signal, and power-device benches that remain outside the scope of embedded test logic.
Segment Analysis
By Test Equipment Type: Non-Memory Platforms Anchor Revenue
Non-memory testers covering logic, SoC, and RF devices captured 47.3% of the Automated Test Equipment market share in 2024.[2]Advantest Communications, “Advantest Forms Strategic Partnerships with FormFactor and Technoprobe,” Advantest, advantest.com Their dominance arose from demand to screen AI processors, 5G transceivers, and automotive domain controllers. Vendors lifted vector speeds beyond 5 Gbps per pin and added sub-terahertz RF options to serve mixed workloads. Machine-learning pattern generation trimmed cycle times, suiting smartphone and data-centre volume runs. Integrated analytics linked fail signatures to layout blocks, reducing respins and cementing the segment’s revenue lead.
Test handlers form the fastest-growing category, with an 11.4% CAGR projected from 2025 to 2030 as automotive and power lines seek higher throughput and tighter thermal control. The Automated Test Equipment market size for handlers is widening as fabs specify multi-zone plates and active vibration damping to qualify wide-bandgap devices at 175 °C. Advanced robotics now moves fragile 3D-stacked packages without micro-cracking, raising first-pass yield in SiP assembly. Predictive-maintenance software further trims downtime, sustaining the segment’s double-digit trajectory.
Note: Segment shares of all individual segments available upon report purchase
Get Detailed Market Forecasts at the Most Granular Levels
Download PDF
By Component: System-Level Racks Gain Momentum
Tester mainframes held 56.4% revenue in 2024, bolstered by upgrades that integrate pattern-generation accelerators and cloud-connected analytics modules. Interface boards now employ low-loss laminates to support 70 Gbps differential lanes, while active thermal-control sockets stabilize junction temperatures within ±0.5 °C.
Automated Test Equipment market size for system-level/burn-in racks is projected to rise at 12.9% CAGR, driven by AI accelerator wafer-level stress testing and photonics assembly validation. Prober innovations address shrinking pad pitches through MEMS spring-probe cards offering 3 μm positional accuracy. Handler designs add multi-zone chill plates to match extended temperature test matrices demanded by safety-critical automotive ICs.
By Test Stage: System-Level Validation Redefines Quality Gates
Package/final benches represented 61.4% of revenue in 2024, verifying power-on functionality, standby leakage, and RF linearity before shipment. Smart load boxes now couple with automated optical inspection to flag package coplanarity anomalies.
System-level lines deliver the fastest 13.7% CAGR as OEMs insist on board-level power cycling, boot-time checks, and artificial-traffic stress suites. The Automated Test Equipment market size gain is most visible in smartphone and EV inverter control modules. Wafer probe stations continue as an early yield monitor, equipped with active vibration-dampening stages to protect fragile micro-bump arrays. Burn-in ovens extend dwell temperatures toward 175 °C for GaN HEMT endurance studies.
By Technology Node: Sub-5 nm Drives Precision
The ≥28 nm cohort still produced 38.3% of revenue in 2024, favoured for cost-sensitive industrial IoT parts. Automated Test Equipment market share for ≤5 nm devices is climbing swiftly; this node group will see a 15.8% CAGR, necessitating picosecond jitter measurement and sub-10 nV/√Hz noise floors.
Between 7 nm and 10 nm, testers must reconcile higher power-integrity margins against shrinking contact windows. Pattern-burst compression and smart alignment algorithms reduce test-time overheads, making economic sense for mid-range CPUs and GPUs. Fabless customers are demanding upgrade-path guarantees to future 3 nm compatibility, pushing vendors toward modular timing engines and field-replaceable analog front-ends.
Note: Segment shares of all individual segments available upon report purchase
Get Detailed Market Forecasts at the Most Granular Levels
Download PDF
By End-User Industry: Automotive Spearheads CAGR
Consumer electronics remained the largest revenue source at 39.3% in 2024, with smartphones alone driving multi-site test concurrency upgrades. The Automated Test Equipment market size attached to automotive and EV electronics is slated to grow at 12.2% CAGR as ADAS, traction inverter, and battery-management IC content scales. ISO 26262 work products include structural-coverage reports derived directly from tester databases, tightening design-for-test collaboration between IDM and EMS partners.
Telecom infrastructure testers now integrate beamforming calibration loops to validate massive-MIMO front-ends, while aerospace customers specify radiation-hardened test flows certified to JESD57. Medical device makers rely on extended burn-in at low leakage currents to guarantee implant longevity, nudging tester vendors to deliver femtoamp-level measurement modules.
Geography Analysis
Asia Pacific led the automated test equipment market with 62.4% revenue in 2024, supported by dense clusters of 300 mm fabs in Taiwan, South Korea, mainland China, and Japan. Foundry expansions at 3 nm and 2 nm nodes triggered corresponding investments in ultra-low-noise final-test lines across Hsinchu and Gyeonggi provinces, while Chinese IDMs accelerated domestic prober and handler procurement to offset export restrictions.[3]SEMI Industry Research, “Eighteen New Semiconductor Fabs to Start Construction in 2025,” SEMI, semi.org
North America ranked second as CHIPS Act incentives advanced multiple green-field fabs in Arizona, Texas, and New York, creating fresh demand for package/final and system-level stations capable of ambient-minus-40 °C stress profiles; Mexico’s automotive electronics corridor likewise upgraded handler fleets to serve nearby vehicle plants.
Europe’s share increased on the back of functional-safety IC production, with Germany and France expanding test capacity for ADAS processors and power modules, while the EUR 43 billion European Chips Act aimed to double regional fabrication output by 2030, spurring parallel tester orders.
The Middle East and Africa are projected to post a 9.1% CAGR from 2025 to 2030 as the UAE and Saudi Arabia channel diversification funds into local RF-front-end ventures; African hubs in South Africa and Nigeria have begun qualifying mixed-signal benches for regional fabless start-ups.
Get Analysis on Important Geographic Markets
Download PDF
Competitive Landscape
Advantest and Teradyne collectively held a significant revenue share of more than 50% of global revenue in 2024, leveraging deep research and development pipelines, large installed bases, and broad service footprints. Advantest extended its V93000 EXA Scale architecture with machine-learning-enabled fail-signature analytics, while Teradyne added new parallel power resources to its UltraFLEX Plus for high-current AI accelerators.
Cohu concentrated on recurring revenue, growing services, and consumables to 65% of 2024 turnover as its Diamondx platform penetrated mid-range MCU accounts. FormFactor and Technoprobe formed probe-card alliances with Advantest to accelerate wafer-level solutions for 3D-stacked DRAM. Niche suppliers such as Chroma and AccelRF carved out positions in photonics burn-in and RF reliability, respectively, winning awards and customer endorsements.[4]Chroma Product Marketing, “Chroma Photonic IC Burn-in and Reliability Test System Wins 2024 TOSIA Award,” Chroma, chromaate.com
Emerging entrants address gaps in silicon photonics, CMOS image sensor HDR testing, and cryogenic qubit validation. Strategic consolidation is expected to continue as incumbents acquire specialized IP, particularly around AI-driven test-program optimization and cyber-secure data pipelines.
Automated Test Equipment Industry Leaders
-
Advantest Corporation
-
Teradyne Inc.
-
Cohu Inc.
-
Chroma ATE Inc.
-
National Instruments (NI)
- *Disclaimer: Major Players sorted in no particular order
Need More Details on Market Players and Competitors?
Download PDF
Recent Industry Developments
- May 2025: Advantest unveiled SiConic™ SoC validation, V93000 EXA Scale upgrades, and ACS real-time data tools at SEMICON Southeast Asia 2025.
- April 2025: Technoprobe’s Capital Market Day outlined entry into High Bandwidth Memory probe-cards and final-test expansion to serve AI workloads.
- March 2025: Keysight Technologies and Analog Devices demonstrated 6G FR3 front-end characterization using PNA-X analyzers and a full signal-chain reference design.
- March 2025: Chroma’s 58604 Photonic IC Burn-in and Reliability Test System won the 2024 TOSIA Award for outstanding product innovation.
Research Methodology Framework and Report Scope
Market Definitions and Key Coverage
Our study defines the automated test equipment (ATE) market as all computer-controlled platforms that electrically and functionally verify semiconductors or assembled electronic devices before they ship from the factory, covering handlers, probers, testers, and system-level racks that integrate measurement hardware and dedicated software.
Scope Exclusions: General purpose oscilloscopes, spectrum analyzers, and other bench test instruments that are not integrated into a fully automated ATE workflow are excluded.
Segmentation Overview
- By Test Equipment Type
- Memory
- DRAM
- Flash
- Non-Memory
- Logic / SoC
- Mixed-Signal and Analog
- RF
- Discrete
- Test Handlers
- Memory
- By Component
- Tester (Core System)
- Handler
- Prober
- Load/Interface Boards and Sockets
- By Test Stage
- Wafer Probe Test
- Package / Final Test
- System-Level / Burn-in Test
- By Technology Node
- ≥28 nm
- 14-22 nm
- 7-10 nm
- ≤5 nm
- By End-User Industry
- Consumer Electronics
- IT and Telecommunications
- Automotive and EV
- Aerospace and Defense
- Healthcare Devices
- Industrial and Power
- By Geography
- North America
- United States
- Canada
- Mexico
- South America
- Brazil
- Argentina
- Rest of South America
- Europe
- Germany
- United Kingdom
- France
- Italy
- Nordics (Sweden, Finland, Norway, Denmark)
- Rest of Europe
- Asia-Pacific
- China
- Japan
- South Korea
- Taiwan
- Rest of Asia-Pacific
- Middle East and Africa
- Middle East
- Saudi Arabia
- United Arab Emirates
- Turkey
- Rest of Middle East
- Africa
- South Africa
- Nigeria
- Rest of Africa
- Middle East
- North America
Detailed Research Methodology and Data Validation
Primary Research
Interviews with test engineering managers at Asian foundries, procurement heads at tier-one consumer-electronics brands, and automation solution integrators in North America validated utilization rates, lead-time shifts, and pricing corridors. Follow-up surveys with European automotive electronics groups clarified the pace at which system-level testers penetrate electric-vehicle lines.
Desk Research
We gathered baseline data from public sources such as the United States Census Bureau's electronics export tables, Japan Electronics and Information Technology Industries Association shipment reports, SEMI's wafer start statistics, and customs-level trade logs accessed through Volza. Company 10-K filings, investor decks, and procurement disclosures supplied average selling price guidance for testers and handlers. Industry journals, including IEEE Transactions on Semiconductor Manufacturing, provided node-transition roadmaps that signal upcoming tester capacity shifts.
Subscription databases used selectively by Mordor analysts, D&B Hoovers for company revenues and Questel for patent trend spotting, offered additional context. The sources named here illustrate typical inputs; many other governmental, academic, and trade references were reviewed to cross-check figures and narratives.
Market-Sizing & Forecasting
A top-down construct converts global semiconductor wafer starts, smartphone shipments, and electric-vehicle production into potential device counts, which are then paired with test hours per unit to derive required tester fleets. Select bottom-up checks, sampled handler shipments and ASP × volume roll-ups from five leading vendors, adjust the pool for real-world replacement cycles and idle capacity. Key variables feeding our multivariate regression forecast include average technology node size migration, capital expenditure by leading foundries, global 5G handset output, and automotive semiconductor content per vehicle. Scenario analysis frames high-demand and supply-constraint cases; the midpoint becomes our published base case. Data gaps linked to privately held suppliers are smoothed using regional proxy ratios anchored to disclosed client mix.
Data Validation & Update Cycle
Model outputs pass variance tests against independent indices, such as global handler export values and quarterly vendor revenue trends. Outliers trigger re-engagement with interviewees before senior review. The dataset refreshes each year, with interim amendments when material events, major fab expansions or merger announcements, occur. A closing analyst sweep ensures clients receive the newest view at purchase.
Why Mordor's Automated Test Equipment Baseline Earns Trust
Published figures often diverge because firms pick different equipment scopes, assume unique tester lifespans, or freeze exchange rates at varying dates.
Key gap drivers include some studies that fold bench instruments into ATE totals; others apply static ASPs that ignore the premium on sub-7 nm testers; refresh cadences also vary, so rapid capacity additions in Asia may be missing elsewhere.
Benchmark comparison
| Market Size | Anonymized source | Primary gap driver |
|---|---|---|
| USD 9.20 B (2025) | Mordor Intelligence | - |
| USD 8.08 B (2025) | Regional Consultancy A | Omits handler refurb sales; uses 2024 ASPs |
| USD 5.19 B (2024) | Trade Journal B | Excludes system-level test racks and currency updated quarterly only |
| USD 8.80 B (2027) | Global Consultancy C | Bench instruments combined with ATE; aggressive five-year replacement cycle |
The comparison shows that when scope, pricing, and update rhythm are aligned, Mordor's numbers sit logically between narrow and broad counts, offering decision-makers a balanced, transparent baseline that can be retraced to clear variables and repeatable steps.
Need A Different Region or Segment?
Customize Now
Key Questions Answered in the Report
What is driving the sharp rise in system-level testers?
System-in-Package adoption and automotive functional-safety mandates require full-device validation under real operating conditions, pushing system-level tester demand to a 13.7% CAGR through 2030.
How significant is Asia-Pacific to the Automated Test Equipment market?
Asia-Pacific held 62.4% of global revenue in 2024, anchored by leading-edge fabs in Taiwan, South Korea, China, and Japan.
Which technology node segment is expanding fastest?
≤5 nm devices lead with a 15.8% CAGR forecast from 2025 to 2030, reflecting rapid adoption for AI and high-performance computing chips.
Why are SiC and GaN devices influencing ATE specifications?
These wide-bandgap semiconductors require test voltages up to 1,200 V and elevated temperatures, necessitating specialized high-voltage discrete testers with advanced safety features.
What restraint could slow Automated Test Equipment market growth?
High capital intensity for sub-5 nm capable platforms extends ROI beyond five years, limiting purchasing power for smaller fabs.
Page last updated on:


