
Market Overview
| Study Period | 2020 - 2031 |
|---|---|
| Forecast Data Period | 2026 - 2031 |
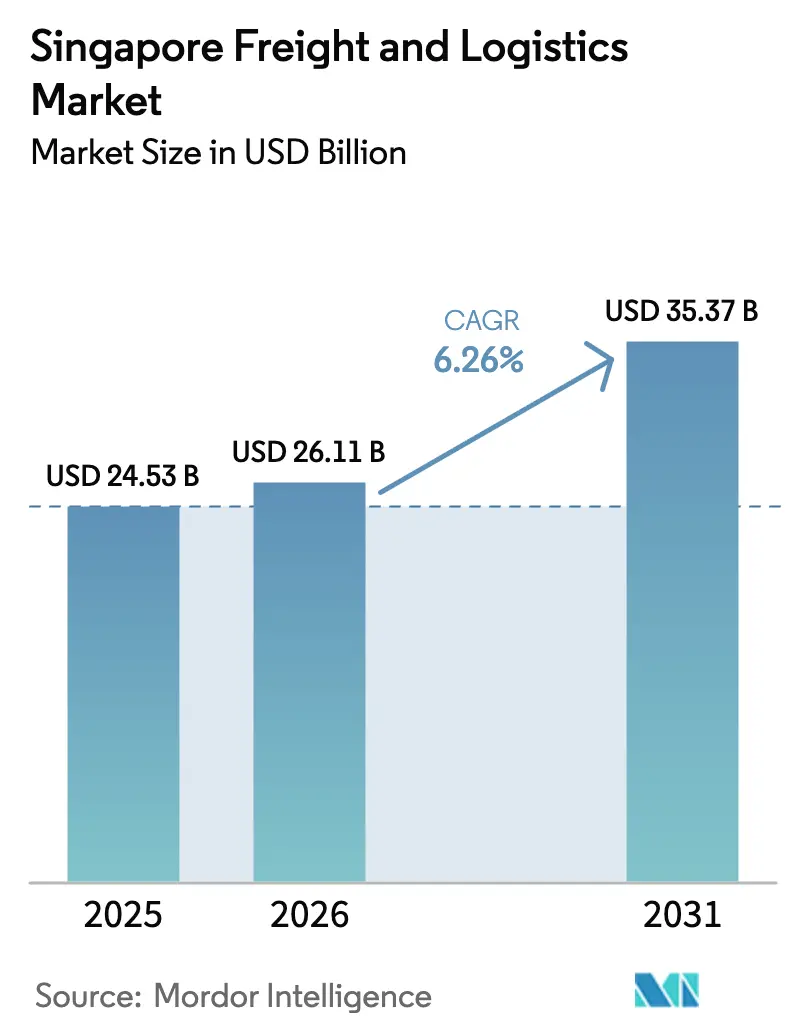
| Base Year Market Size (2025) | USD 24.53 Billion |
| Market Size (2026) | USD 26.11 Billion |
| Market Size (2031) | USD 35.37 Billion |
| Growth Rate (2026 - 2031) | 6.26 % |
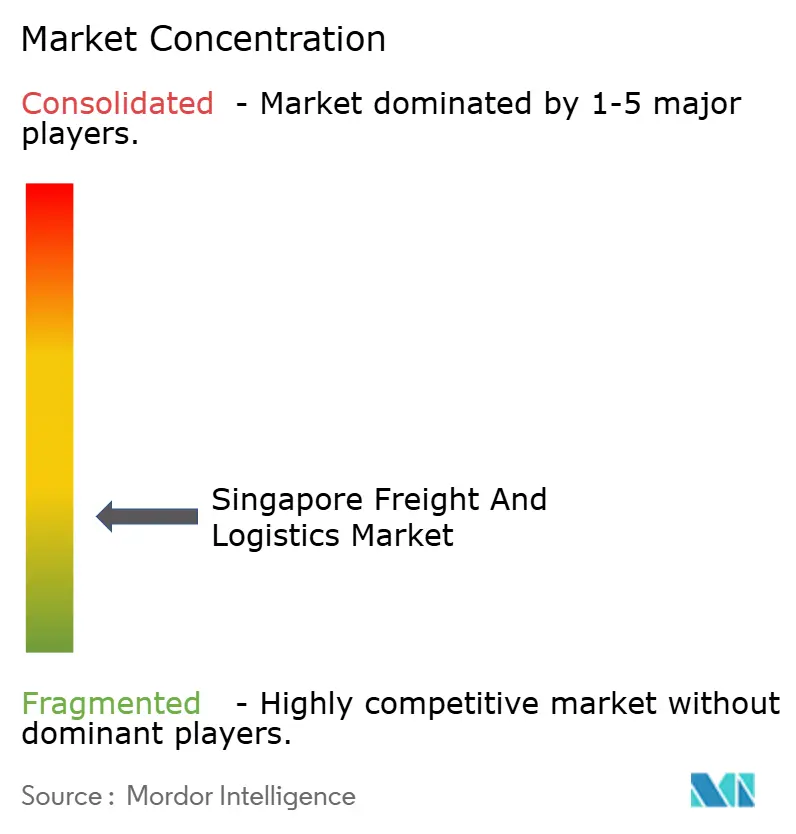
| Market Concentration | Low |
Major Players *Disclaimer: Major Players sorted in no particular order Image © Mordor Intelligence. Reuse requires attribution under CC BY 4.0. | |
Singapore Freight And Logistics Market Analysis by Mordor Intelligence
The Singapore Freight And Logistics Market size is projected to be USD 24.53 billion in 2025, USD 26.11 billion in 2026, and reach USD 35.37 billion by 2031, growing at a CAGR of 6.26% from 2026 to 2031.
Current growth rests on four pillars: surging e-commerce parcel flows, government-led infrastructure projects, rapid digital adoption among shippers, and an accelerating shift toward green freight solutions. Container throughput expanded to 39.47 million TEU in 2024, helped by vessel diversions from the Red Sea, while the Tuas Port mega-project is unlocking automated capacity that lowers unit costs and enhances schedule reliability. Air-cargo lanes regained momentum as belly-hold capacity returned, yet premium express demand keeps rates above pre-pandemic averages. At the same time, rising labor costs and land scarcity encourage automation, multi-story warehousing, and off-site consolidation, trends that will shape how the Singapore freight and logistics market evolves during the next five years. Competitive intensity remains high as global integrators strengthen vertical capabilities and local specialists defend niches in cold chain, contract logistics, and cross-border distribution.
Key Report Takeaways
- By logistics function, freight transport led with 61.26% of Singapore freight and logistics market share in 2025, while courier, express, and parcel (CEP) is forecast to grow fastest at a 7.20% CAGR between 2026-2031.
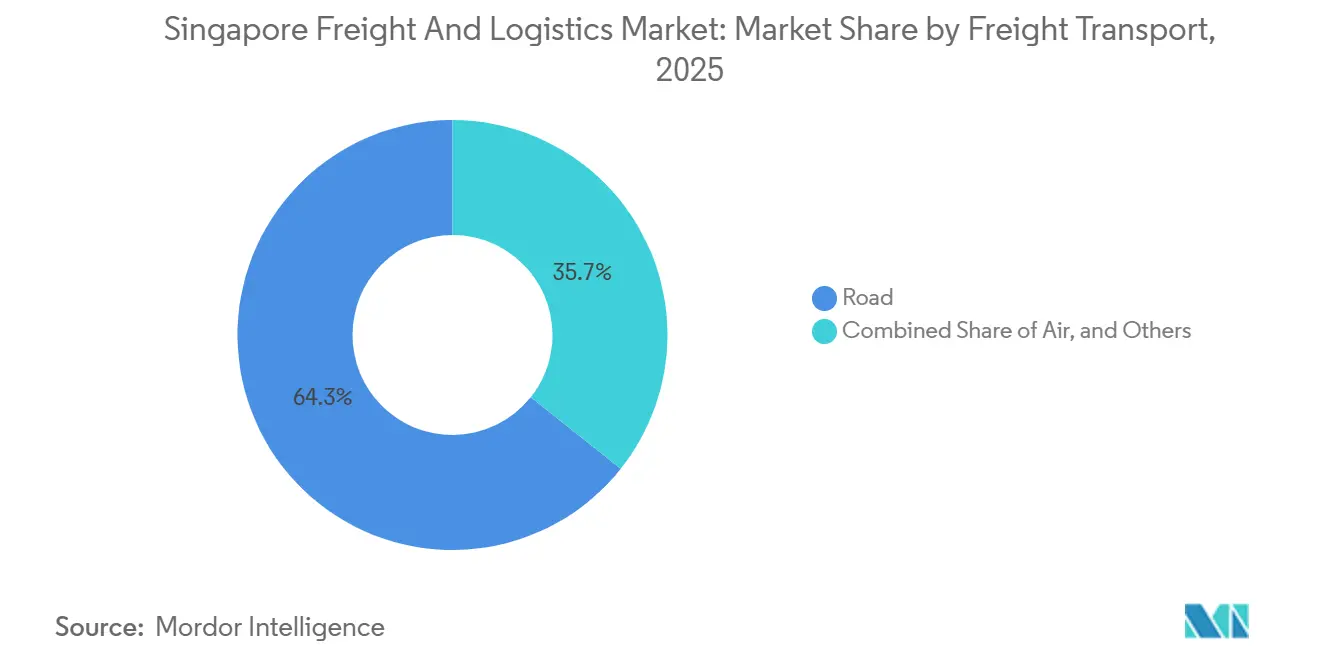
- By freight transport, road accounted for 64.31% of the segment’s 2025 revenue, yet air freight is poised to expand at a 7.05% CAGR between 2026-2031.
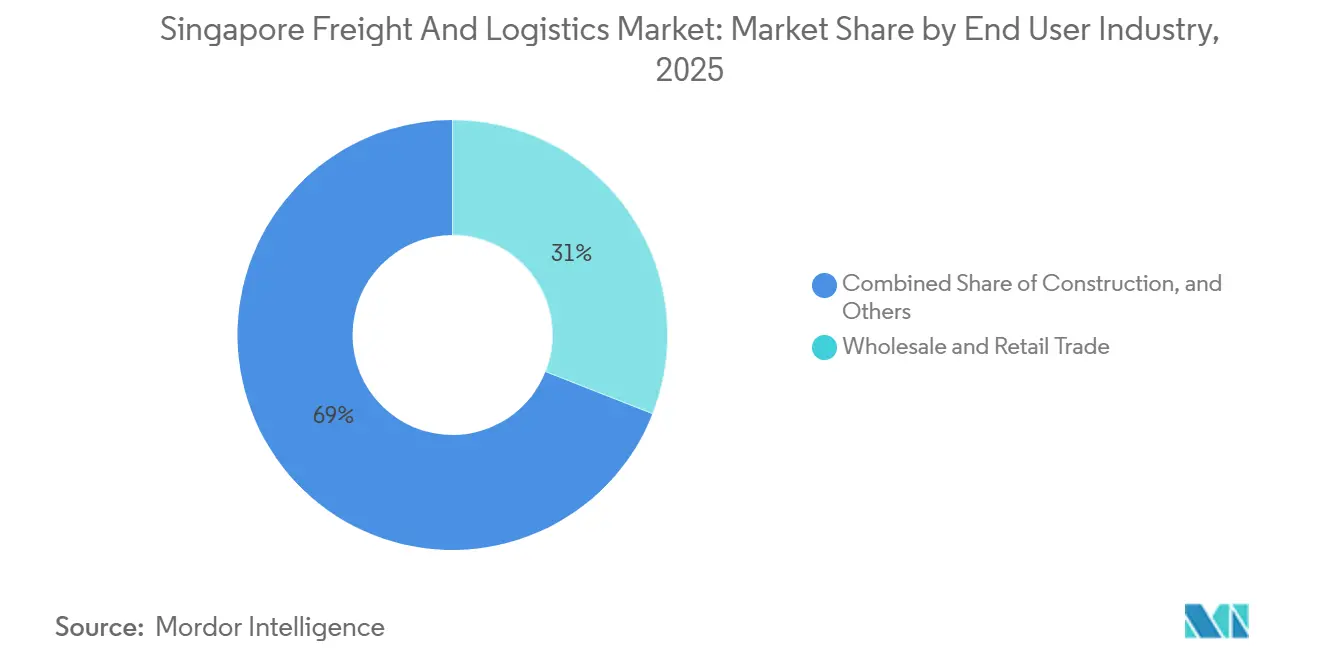
- By end-user industry, wholesale and retail trade captured 30.96% of Singapore freight and logistics market size in 2025, whereas manufacturing records the highest projected CAGR at 6.76% between 2026-2031.
- By warehousing and storage, temperature-controlled warehousing is advancing at a 7.06% CAGR between 2026-2031, even though non-temperature-controlled facilities still hold 91.56% of capacity in 2025.
- By CEP, the international CEP sub-segment is expanding at a 7.46% CAGR between 2026-2031, outpacing domestic parcels that account for 64.95% of value in 2025.
- By freight forwarding mode, sea and inland waterways accounted for a 50.34% share in 2025, while air freight forwarding is projected to expand at a 6.31% CAGR between 2026-2031.
Note: Market size and forecast figures in this report are generated using Mordor Intelligence’s proprietary estimation framework, updated with the latest available data and insights as of January 2026.
Singapore Freight And Logistics Market Trends and Insights
Drivers Impact Analysis*
| Driver | (~) % Impact on CAGR Forecast | Geographic Relevance | Impact Timeline |
|---|---|---|---|
| Government investment in port and logistics infrastructure | +1.2% | National, Tuas and Changi clusters | Medium term (2-4 years) |
| Explosive B2C e-commerce parcel volumes | +1.5% | National, spillover to ASEAN corridors | Short term (≤ 2 years) |
| Singapore’s role as a trans-shipment hub | +1.3% | Global reach anchored in 600+ port links | Long term (≥ 4 years) |
| Accelerated digitalization and 3PL outsourcing by SMEs | +0.9% | National, retail and manufacturing SMEs | Medium term (2-4 years) |
| SGTraDex adoption boosting visibility | +0.7% | National with ASEAN extension | Medium term (2-4 years) |
| Green Freight Corridor pilot for battery-electric trucks | +0.5% | Urban last-mile zones | Long term (≥ 4 years) |
| Source: Mordor Intelligence | |||
Government investment in port and logistics infrastructure
Singapore is channeling significant capital into backbone assets. The Tuas Port complex, built for 65 million TEU ultimate capacity, began Phase 1 operations in September 2024 and is already handling automated yard moves that reduce berth time by 20%. A SGD 647.5 million (USD 476.65 million) Supply Chain Hub scheduled for 2027 completion will integrate autonomous cranes with the SGTraDex data layer, enabling real-time inventory repositioning for manufacturers. Complementing port upgrades, the Land Transport Authority is piloting a Green Freight Corridor that offers SGD 40,000 incentives per heavy battery-electric truck from 2026, supported by battery-swap stations along key industrial routes. These initiatives reinforce Singapore freight and logistics market competitiveness by unlocking capacity, trimming dwell time, and sharpening the city-state’s cost advantage over regional rivals[1]“Green Freight Corridor Factsheet 2024,” Land Transport Authority, lta.gov.sg.
Explosive B2C e-commerce parcel volumes
Online shopping penetration reached 88%, pushing the domestic e-commerce value to SGD 7.9 billion (USD 5.81 billion) in 2023 and a projected SGD 11.3 billion (USD 8.31 billion) by 2028. Parcel volumes rose in double digits, with SingPost handling more than 200 million items in 2024. Capacity pressure triggered investment in automated sortation hubs and last-mile micro-fulfillment sites by DHL and SF Express, which together deployed electric cargo bikes to shave urban delivery costs by 15%. Cross-border flows add momentum as ASEAN e-commerce is forecast to touch USD 211 billion by 2025, routing high-yield parcels through Changi Airport’s express facilities[2]“Productivity Solutions Grant Update 2025,” Enterprise Singapore, enterprisesg.gov.sg .
Singapore’s role as trans-shipment hub for ASEAN + Indo-Pacific
Container volume reached 39.47 million TEU in 2024, cementing Singapore’s place as the world’s second-busiest box port. A liner shipping connectivity index of 117.8 highlights direct calls from more than 200 carriers. Red Sea disruptions diverted long-haul strings via the Cape of Good Hope, adding Singapore stops and showcasing the port’s agility. PSA is layering cold-chain, hazardous-cargo, and digital bunkering services onto Tuas operations, opening margin-rich adjacencies while the Maritime Singapore Green Initiative grants of SGD 200 million (USD 147.22 million) incentivize low-carbon propulsion.
Accelerated digitalization and 3PL outsourcing by SMEs
Enterprise Singapore’s Productivity Solutions Grant co-funds up to 50% of logistics tech adoption, allowing SMEs to deploy cloud WMS and TMS tools without high upfront costs. YCH Group and ST Logistics operate control towers that blend shipment data across modes, cutting lead time as much as 20% for electronics exporters. SGTraDex processed more than 35 million transactions by end-2024 and is on track to deliver SGD 100 million annual value by 2026 through paperless trade flows.
Restraints Impact Analysis*
| Restraint | (~) % Impact on CAGR Forecast | Geographic Relevance | Impact Timeline |
|---|---|---|---|
| Acute labor shortage and rising manpower costs | -0.8% | Warehousing and last-mile functions nationwide | Short term (≤ 2 years) |
| Land scarcity limiting new warehousing capacity | -0.6% | Western and northern industrial zones | Medium term (2-4 years) |
| High exposure to global trade-cycle volatility | -0.5% | Global macro impacts on trans-shipment volumes | Short term (≤ 2 years) |
| Tightening carbon-emission rules | -0.4% | Maritime and road fleets under national and IMO regimes | Long term (≥ 4 years) |
| Source: Mordor Intelligence | |||
Acute labor shortage and escalating manpower costs
Transport job vacancies rose to 3,800 in Q3 2024 from 2,800 a year earlier, and median sector wages climbed 5.4% in 2023. Foreign-worker quota ceilings hold at 38% of headcount, pushing logistics operators toward automation. SATS deployed autonomous mobile robots that trimmed manual cargo handling by 30%. Smaller firms face cash-flow pressure because robotics outlays entail multi-year payback horizons. The Progressive Wage Model will add further cost escalation through 2026, possibly driving basic warehousing activities to lower-cost sites over the border[3]“Labour Market Report Q3 2024,” Ministry of Manpower, mom.gov.sg.
Land scarcity limiting new warehousing capacity
JTC allocates a finite 12,800 hectares for industrial use, and prime sites near Tuas and Changi saw rents rise 10–15% in 2024. Vertically stacked warehouses improve land yield but elevate build cost and restrict heavy-vehicle movement. Cold-storage capacity, at about 1.2 million m³, lags growing pharmaceutical and perishable imports that jumped 8% in 2024. Lead times for new facilities stretch beyond two years, encouraging operators to lease space in Johor where rents are 50–60% lower yet cross-border links remain tight[4]“Industrial Rent Index 2024,” JTC Corporation, jtc.gov.sg.
*Our forecasts treat driver/restraint impacts as directional, not additive. The impact forecasts reflect baseline growth, mix effects, and variable interactions.
Segment Analysis
By End-User Industry: Wholesale and Retail Trade leads but Manufacturing accelerates
Wholesale and Retail Trade generated 30.96% of 2025 revenue, driven by omnichannel grocery and electronics distribution. Manufacturing, however, delivers the fastest 6.76% CAGR (2026-2031), buoyed by USD 177.8 billion in 2024 factory output spread across semiconductors and biomedical products. Precision sectors require strict climate control and short turnaround, lifting demand for specialized freight.
Oil, Gas, Mining, and Quarrying provides steady petrochemical flows from Jurong Island. Construction activity tied to Tuas Port and rapid transit infrastructure sustains heavy-haul demand, though growth moderates once flagship projects near completion. Agriculture remains minor but gains attention under the “30 by 30” local food plan, adding niche cold-chain requirements.



By Logistics Function: Freight Transport dominates but CEP surges on e-commerce tailwinds
Freight Transport held 61.26% of Singapore freight and logistics market share in 2025, anchored by maritime and air-cargo flows that benefit from the city-state’s trans-shipment strength. The segment will continue expanding, though its share inches lower as CEP accelerates. CEP revenue is set to climb at a 7.20% CAGR (2026-2031) on the back of domestic online retail and ASEAN cross-border orders. Warehousing follows in the mid-teens share, posting a 6.50% CAGR (2026-2031) as real-time visibility tools foster just-in-time stocking. Freight Forwarding gains incremental value from SME digitization, with TradeNet documentation cuts translating into faster customs release. Operators bundle insurance, brokerage, and packaging services to support compliance in data-localization regimes.
Parcel giants are blurring the line between CEP and forwarding. DHL and Kuehne+Nagel already cross-utilize linehaul capacity, boosting load factors and lowering unit cost. This convergence will reshape how the Singapore freight and logistics market allocates capital because express carriers now compete head-to-head with traditional forwarders for mid-weight cargo. Yet regulatory light-touch remains; IMDA’s data rules drive specialized compliance work but do not create significant entry barriers for tech-enabled challengers.
By CEP Destination Type: Domestic parcels dominate but International outpaces on ASEAN e-commerce
Domestic parcels formed 64.95% of the 2025 value as shoppers accustomed to same-day service demand dense urban coverage. Still, International parcels grow faster at a 7.46% CAGR (2026-2031) aligned with ASEAN cross-border trade. Higher yields per item make international traffic the profit engine. SingPost and SF Express operate cross-border hubs that link directly into partner postal networks, removing intermediate stops and improving reliability. Locker networks within residential precincts cut failed deliveries, yet free-shipping thresholds from platforms compress margins. To defend returns, operators introduce premium options featuring carbon-neutral certification, an offering likely to gain traction once carbon tax bands rise.
Blockchain-enabled track-and-trace will become table stakes. Maersk and DHL pilot programs show 60% dispute-resolution time savings, reinforcing visibility as a competitive differentiator in the Singapore freight and logistics market.
By Warehousing Temperature Control: Non-Temperature-Controlled dominates but Cold Chain accelerates
Non-Temperature-Controlled sites own 91.56% of capacity in 2025, catering to electronics and general merchandise. Automation investments in robotic picking, autonomous cranes, and productivity offset manpower constraints. Cold chain, although small, posts a 7.06% CAGR (2026-2031) as pharmaceutical imports and premium food demand climb. Land scarcity complicates cold-store expansion; rents near Changi run 30–40% above ambient equivalents. Operators respond with multi-story builds incorporating high-density racking and efficient refrigeration. The Health Sciences Authority enforces GDP certification, raising the floor for service quality and capital intensity.
Emerging players view the cold chain as the quickest path to margin expansion. GEODIS’s 2024 purchase of Keppel Logistics underscores the premium placed on temperature-controlled assets within the Singapore freight and logistics market.
By Freight Transport Mode: Road leads but Air gains on premium express demand
Road transport commanded a 64.31% share in 2025, reflecting dense urban distribution and short-haul connectivity to Johor. Growth is leveling as Electronic Road Pricing lifts operating cost, and diesel prices remain elevated. Air freight, the smallest mode by tonnage, outpaces all others with a 7.05% CAGR (2026-2031) courtesy of electronics and pharmaceutical express demand. Belly-hold capacity recovery trails passenger traffic rebounds, meaning dedicated freighters keep rates buoyant. Sea and Inland Waterways hold a steady footing through mega-carrier alliances and vessel upsizing that favor deep-draft Tuas berths. Pipelines serve niche petrochemical flows, and rail remains negligible due to geography.
The Singapore freight and logistics market size tied to Air freight will rise disproportionately because higher-yield cargo offsets volume gaps. That dynamic incentivizes Changi Airport to enlarge dedicated freighter stands and enhance perishables processing. Meanwhile, road fleets face green pressure. The Green Freight Corridor will compel fleet renewal toward electric trucks, adding capital needs yet reducing per-kilometer energy expense over time.
By Freight Forwarding Mode: Sea dominates but Air gains on express consolidation
Sea forwarding comprised 50.34% of 2025 values, propelled by direct liner links to 600 ports. Alliance consolidation keeps unit economics favorable for mega-forwarders. Air forwarding, though smaller, records a 6.31% CAGR (2026-2031) as express consolidation tightens lead times for high-value goods. Digital platforms offer instant booking and tracking, compressing the traditional brokerage space.
Maersk’s TradeLens and CMA CGM’s SHIPNEXT cut administrative time by half, letting operators focus on value-added services such as bonded warehousing and customs consultancy. Road forwarding retains relevance on Singapore-Malaysia links, especially once the RTS opens in 2026.
Geography Analysis
Singapore’s freight network spans only 730 km² yet punches above its weight. The western Tuas corridor, the eastern Changi cluster, and the central Jurong belt anchor national throughput. A 6.26% CAGR stems from automated capacity gains and digital orchestration that mitigate labor and land constraints.
Cross-border synergies with Johor intensify; the RTS Link will streamline cargo and labor flows, while lower rents across the strait encourage secondary storage. International CEP riding ASEAN growth funnels through Changi’s 24-hour customs clearance, making the city-state the default hub for time-sensitive goods.
Carbon taxation, climbing from SGD 25 (USD 18.40) per ton in 2024 to as high as SGD 80 per ton by 2030, raises the compliance bar but also sharpens the green premium commanded by low-emission services. Digital bunkering becomes mandatory in April 2025, cementing Singapore’s first-mover status in maritime sustainability.
Regulatory Landscape
Regulation in Singapore freight and logistics is anchored by trade facilitation, customs licensing, and modal safety regimes administered primarily by Singapore Customs, IRAS, the Maritime and Port Authority of Singapore (MPA), the Civil Aviation Authority of Singapore (CAAS), and the Land Transport Authority (LTA). On the trade side, Singapore Customs TradeFIRST operates as an integrated, risk-based assessment framework tied to access and facilitation across customs schemes, and it is used when companies apply for such schemes. Facilitation bands (from Basic to Premium) link compliance capability to operational autonomy.
Operators handling consolidation and bulk-breaking outside Free Trade Zones for non-dutiable, non-controlled, and non-strategic goods may require a Container Freight Warehouse (CFW) license. Conditions include GST-registered status and a satisfactory compliance record. Recent legislative updates reinforce compliance and security expectations across the ecosystem. The Regulation of Imports and Exports (Amendment) Act 2025 (published April 2026) updates elements of import-export controls and documentation protocols relevant to certification and preferential tariff arrangements, raising the premium on strong trade-data governance among forwarders and 3PLs. The Transport Sector (Miscellaneous Amendments) Act 2025 (commenced February 2026) strengthens selected land and sea transport rules to enhance safety and security. Data standardization efforts such as TR128 (Common Data Standards for Container Logistics) support interoperable container logistics datasets for import, export, and repositioning flows, aligning with digital initiatives such as SGTraDex used by shippers and logistics operators.
Value Chain Analysis
Singapore's freight and logistics value chain runs from freight generation (manufacturing, wholesale and retail trade, and petrochemicals centered around Jurong Island) through booking and orchestration (shippers, freight forwarders, and digital documentation platforms), to multimodal execution (ocean, air, and road carriers) and asset-heavy nodes (terminals, bonded/FTZ facilities, distribution centers, and temperature-controlled warehouses). PSA's Tuas Port anchors the seaport node, while Changi's air cargo complex supports time-sensitive and high-value flows. Downstream, CEP networks provide last-mile coverage and cross-border parcel injection, and contract logistics players operate control towers, WMS/TMS systems, and value-added services such as kitting, returns, labeling, and compliance documentation.
A visible shift in the chain is deeper integration between port operations and adjacent logistics real estate, increasing the share of value captured inside port-linked ecosystems rather than through external trucking loops. PSA's move toward a Supply Chain Hub at Tuas (planned for completion in Q2 2027, with over 185,000 sq m) and its collaboration with Cosco on warehousing and logistics services at Tuas highlights port-hinterland convergence, while Cosco's Jurong Island Logistics Hub Phase 2 expansion adds specialized capacity for chemical and petrochemical logistics. On the governance side, the Transport Sector (Critical Firms) Act 2024 coming into force on April 1, 2025 introduced a designated-entities regime (via CAAS, LTA, and MPA) that can apply to key transport firms, elevating operational resilience and continuity requirements across critical nodes in the chain. Tax and cashflow schemes administered by IRAS (for logistics and freight forwarding businesses) also shape how operators structure warehousing and cross-border flows.
Competitive Landscape
Combined, Maersk, CMA CGM, DHL, Kuehne+Nagel, and DSV control an estimated 45% of revenue, an edge built on end-to-end offerings that marry ocean, air, and contract logistics. Regional players PSA International, SATS, YCH Group, Singapore Post counter with deep local knowledge and infrastructure ownership. Market entry barriers remain moderate because port and airport access is open, but capital requirements climb as automation and green compliance loom. White-space opportunities surface in cold chain and electric last-mile delivery, areas where grant support shortens return periods.
Strategic moves in 2025 show the stakes. DSV’s USD 14.3 billion purchase of DB Schenker vaulted its Singapore revenue past USD 1 billion. PSA’s autonomous yard cranes cut berth turnaround to below 10 hours, lifting carrier satisfaction. Digital marketplaces such as TradeLens pull transactions away from manual brokers, while DHL and SF Express roll out delivery robots that shave urban costs.
Regulatory bodies exert selective pressure. The Competition and Consumer Commission of Singapore vets mergers for anti-competitive risk. The Maritime and Port Authority enforces environmental compliance. Operators that align with green and digital mandates will capture premium yield as the Singapore freight and logistics market matures.
Singapore Freight And Logistics Industry Leaders
DHL Group
Kuehne+Nagel
DSV A/S (Including DB Schenker)
CMA CGM Group (Including Bollore Logistics)
CWT Pte, Ltd.
- *Disclaimer: Major Players sorted in no particular order

Market Opportunities and Future Outlook
Digital trust and interoperability across port, shipping, and landside players are a concrete whitespace as transaction volumes scale and compliance tightens. MPA's launch of OCEANS-X in April 2026, positioned as a secure system-to-system data and API exchange platform for the maritime ecosystem, and ongoing adoption of standardized container logistics datasets (TR128) create a pathway for forwarders, terminal operators, and 3PLs to productize visibility, exception management, and compliance-as-a-service offerings. This supports higher-value services around paperless trade flows and integrated control towers, particularly for SMEs that are already using digital tools enabled by government co-funding and national platforms such as SGTraDex.
Two operational investment themes also stand out as immediately actionable: (1) specialized, compliant cold chain for pharmaceuticals and perishable imports and (2) automation and resilience at strategic nodes constrained by land and labor. DHL's February 2026 investment of EUR 10 million in a new pharmaceutical hub in Singapore (with temperature-controlled zones and GMP-aligned infrastructure near Tuas Biomedical Park) signals continued capital deployment into life-sciences logistics capacity, aligning with the report's observed acceleration in temperature-controlled warehousing demand. On the maritime side, MPA's 2026 edition of the Singapore Maritime Technology and Research Roadmap (over SGD 100 million in R&D over five years) and enabling tools such as the Maritime Digital Twin outline a pipeline for operators and solution providers to commercialize autonomous operations, smart port services, and cybersecurity capabilities, while construction progress on Cosco's Jurong Island Logistics Hub Phase 2 adds new specialized logistics capacity tied to petrochemical and chemical supply chains.
Recent Industry Developments
- June 2026: COSCO launched the South-east Asia India Service 2, linking Singapore with ports in China, Vietnam, and India. The added loop provides network optionality for shippers and forwarders routing around schedule disruptions and capacity swings. For Singapore, the service reinforces its role as a trans-shipment and consolidation node on intra-Asia and India-linked corridors.
- July 2025: Singapore Post sold its freight forwarding arm for SGD 177.9 million (USD 130.95 million) as it refocused on parcel and CEP operations. The divestment reshaped competitive dynamics in forwarding capacity and customer portfolios, creating room for other forwarders and integrators to absorb accounts and scale contract coverage. It also underlined the market's split between asset-light forwarding strategies and last-mile scale economics.
- September 2024: PSA advanced Tuas Port Phase 1 operations as the project began handling automated yard moves, supporting faster berth and yard productivity. The operational ramp-up strengthened Singapore's terminal competitiveness during periods of volatile global routing. It also increased demand for adjacent warehousing and landside value-added services as more cargo moved through the Tuas corridor.


Research Methodology Framework and Report Scope
Market Definition and Coverage
For this study, the Singapore freight and logistics market is sized as the gross revenue generated in Singapore from moving goods and supporting those goods flows, covering transport across modes, freight forwarding, courier-express-parcel, warehousing, and related value-added services.
Scope exclusions: We exclude passenger-only transport services and in-house logistics that are run internally by shippers and not billed as a third-party logistics service.
Segmentation Overview
- By End-User Industry
- Agriculture, Fishing, and Forestry
- Construction
- Manufacturing
- Oil and Gas, Mining, and Quarrying
- Wholesale and Retail Trade
- Others
- By Logistics Function
- Courier, Express and Parcel (CEP)
- By Destination Type
- Domestic
- International
- By Destination Type
- Freight Forwarding
- By Mode of Transport
- Air
- Sea and Inland Waterways
- Others
- By Mode of Transport
- Freight Transport
- By Mode of Transport
- Air
- Pipelines
- Rail
- Road
- Sea and Inland Waterways
- By Mode of Transport
- Warehousing and Storage
- By Temperature Control
- Non-Temperature-Controlled
- Temperature-Controlled
- By Temperature Control
- Other Services
- Courier, Express and Parcel (CEP)
Data Sources, Market Sizing, and Validation
Desk Research
Desk research was used to build the base structure of the model and anchor it to Singapore freight activity by lane and mode. We mainly relied on public statistical and regulatory sources such as Singapore Department of Statistics releases, Maritime and Port Authority of Singapore publications, Civil Aviation Authority of Singapore aviation statistics, Singapore Customs trade data, and WTO or UN Comtrade series for cross-checks.
To avoid overstating the market, these sources were treated as signals for demand and throughput rather than direct revenue proxies. We also reviewed company filings, annual reports, and investor presentations to understand service mix and pricing direction, and we used a paid subscription for news and financials to track capacity additions, policy changes, and large contract wins that can shift near-term assumptions. The desk sources listed are illustrative and not exhaustive, and many other public references were used for data collection, validation, and clarification.
Primary Interviews and Surveys
Primary interviews and surveys were used to validate what desk sources cannot fully show, especially pricing, utilization, and the share of transshipment versus domestic distribution work billed in Singapore. We spoke with a mix of logistics providers, freight forwarders, warehouse operators, and large shipper-side logistics teams, and the discussions covered the main trade-lane linkages into and out of Singapore so assumptions could be checked across customer types.
Distribution of primary research fieldwork respondents
| Company type | Respondent position |
|---|---|
| Top tier: 33% | CXOs: 15% |
| Mid tier: 52% | Functional/Unit leaders: 39% |
| Smaller Players: 15% | Managers: 46% |
Market-Sizing & Forecasting
Sizing starts from a top-down build that reconstructs the addressable revenue pool from Singapore freight activity and service coverage, and then we test totals using selective bottom-up approximations before finalizing. In practice, the model is guided by indicators such as Singapore merchandise trade values by major lanes, port container and cargo throughput, air cargo tonnage, warehouse space additions and occupancy direction, and observable shifts in parcel volumes tied to domestic consumption.
The value layer is formed by applying service-mix weights and reasonable pricing bands that came from interviews and publicly visible price movement signals, then adjusting for what is actually billed in Singapore, including hub and transshipment-linked work. Where bottom-up checks were used, it was through sampled operator revenue ranges, service line shares, and simple volume times ASP checks for major activities, and gaps were handled by using peer-group averages and then pressure-testing the result with respondents. Forecasts were built using scenario analysis supported by short variable-level outlooks from industry experts, covering trade growth, capacity expansions, and cost-driven pricing changes.
Data Validation & Update Cycle
Outputs are validated by comparing model results with independent activity markers such as trade growth direction, throughput trends, and reported logistics revenue cues from public company disclosures. When a number looks off, we revisit the assumptions behind the step that caused the jump, and we trigger follow-up calls when the variance cannot be explained by a clear market event.
Before sign-off, the model and logic are reviewed in multiple analyst passes so calculation errors and scope overlaps are removed. The report is refreshed annually, and interim updates are made when material changes happen, such as major policy shifts, port capacity announcements, or sharp freight rate resets. Right before delivery, a final review pass is done so clients receive the latest updated view.
Mordor Intelligence's Singapore Freight and Logistics Market Sizing Compared With Other Published Estimates
Published market values for Singapore freight and logistics often do not match because firms draw the line around different revenue pools, and then apply different assumptions on what is billed locally versus what is simply handled in Singapore. Differences also show up when one estimate leans heavily on throughput indicators, while another anchors the value to a broader services bundle that includes adjacent marine activities.
The largest gap drivers in this market are usually whether port-linked marine services are counted, how transshipment-linked revenue is attributed, and how courier and warehousing are treated when they are bundled with transport. The spread below is largely explained by excluding port marine services like bunkering and shipyard repair from the market value, and counting only freight and logistics services billed in Singapore, which reflects the sizing approach used near the end of the modeling chain by Mordor Intelligence.
Benchmark comparison
| Source | Market Size | Gaps in Research Methodology |
|---|---|---|
| Mordor Intelligence | USD 24.53 B (2025) | |
| Global Data Publisher A | USD 67.22 B (2024) | Uses a wider value pool that appears to fold in port and marine services alongside logistics, which can inflate the total versus freight-only service revenues billed in-country. |
| Industry Research Group B | USD 74.90 B (2025) | Likely applies broader inclusions and averaging across functions without clearly separating hub handling from value-added logistics revenue, which can lift totals when throughput is converted to value. |
Looking across the three figures, the main takeaway is that scope choices matter more than math in this market. Once service lines are kept consistent and billing location is treated carefully, the resulting number becomes easier to reconcile with trade, throughput, and operating signals, and it stays repeatable year to year.


Key Questions Answered in the Report
What is the current value of the Singapore freight and logistics market?
The Singapore freight and logistics market size is USD 26.11 billion in 2026.
How fast will the market grow through 2031?
Market value is projected to reach USD 35.37 billion by 2031, representing a 6.26% CAGR (2026-2031).
Which logistics function is expanding the quickest?
Courier, Express, and Parcel services are set to rise at a 7.20% CAGR (2026-2031) as e-commerce volumes climb.
Why is air freight outperforming other transport modes?
Capacity constraints, premium electronics and pharmaceutical demand, and express delivery needs propel air freight at a 7.05% CAGR (2026-2031).
What challenges threaten growth?
Labor shortages, rising industrial rents, global trade volatility, and stricter carbon rules can temper expansion if not managed through automation and green investments.
Page last updated on:




