
Fintech Market Size and Share
Market Overview
| Study Period | 2019 - 2030 |
|---|---|
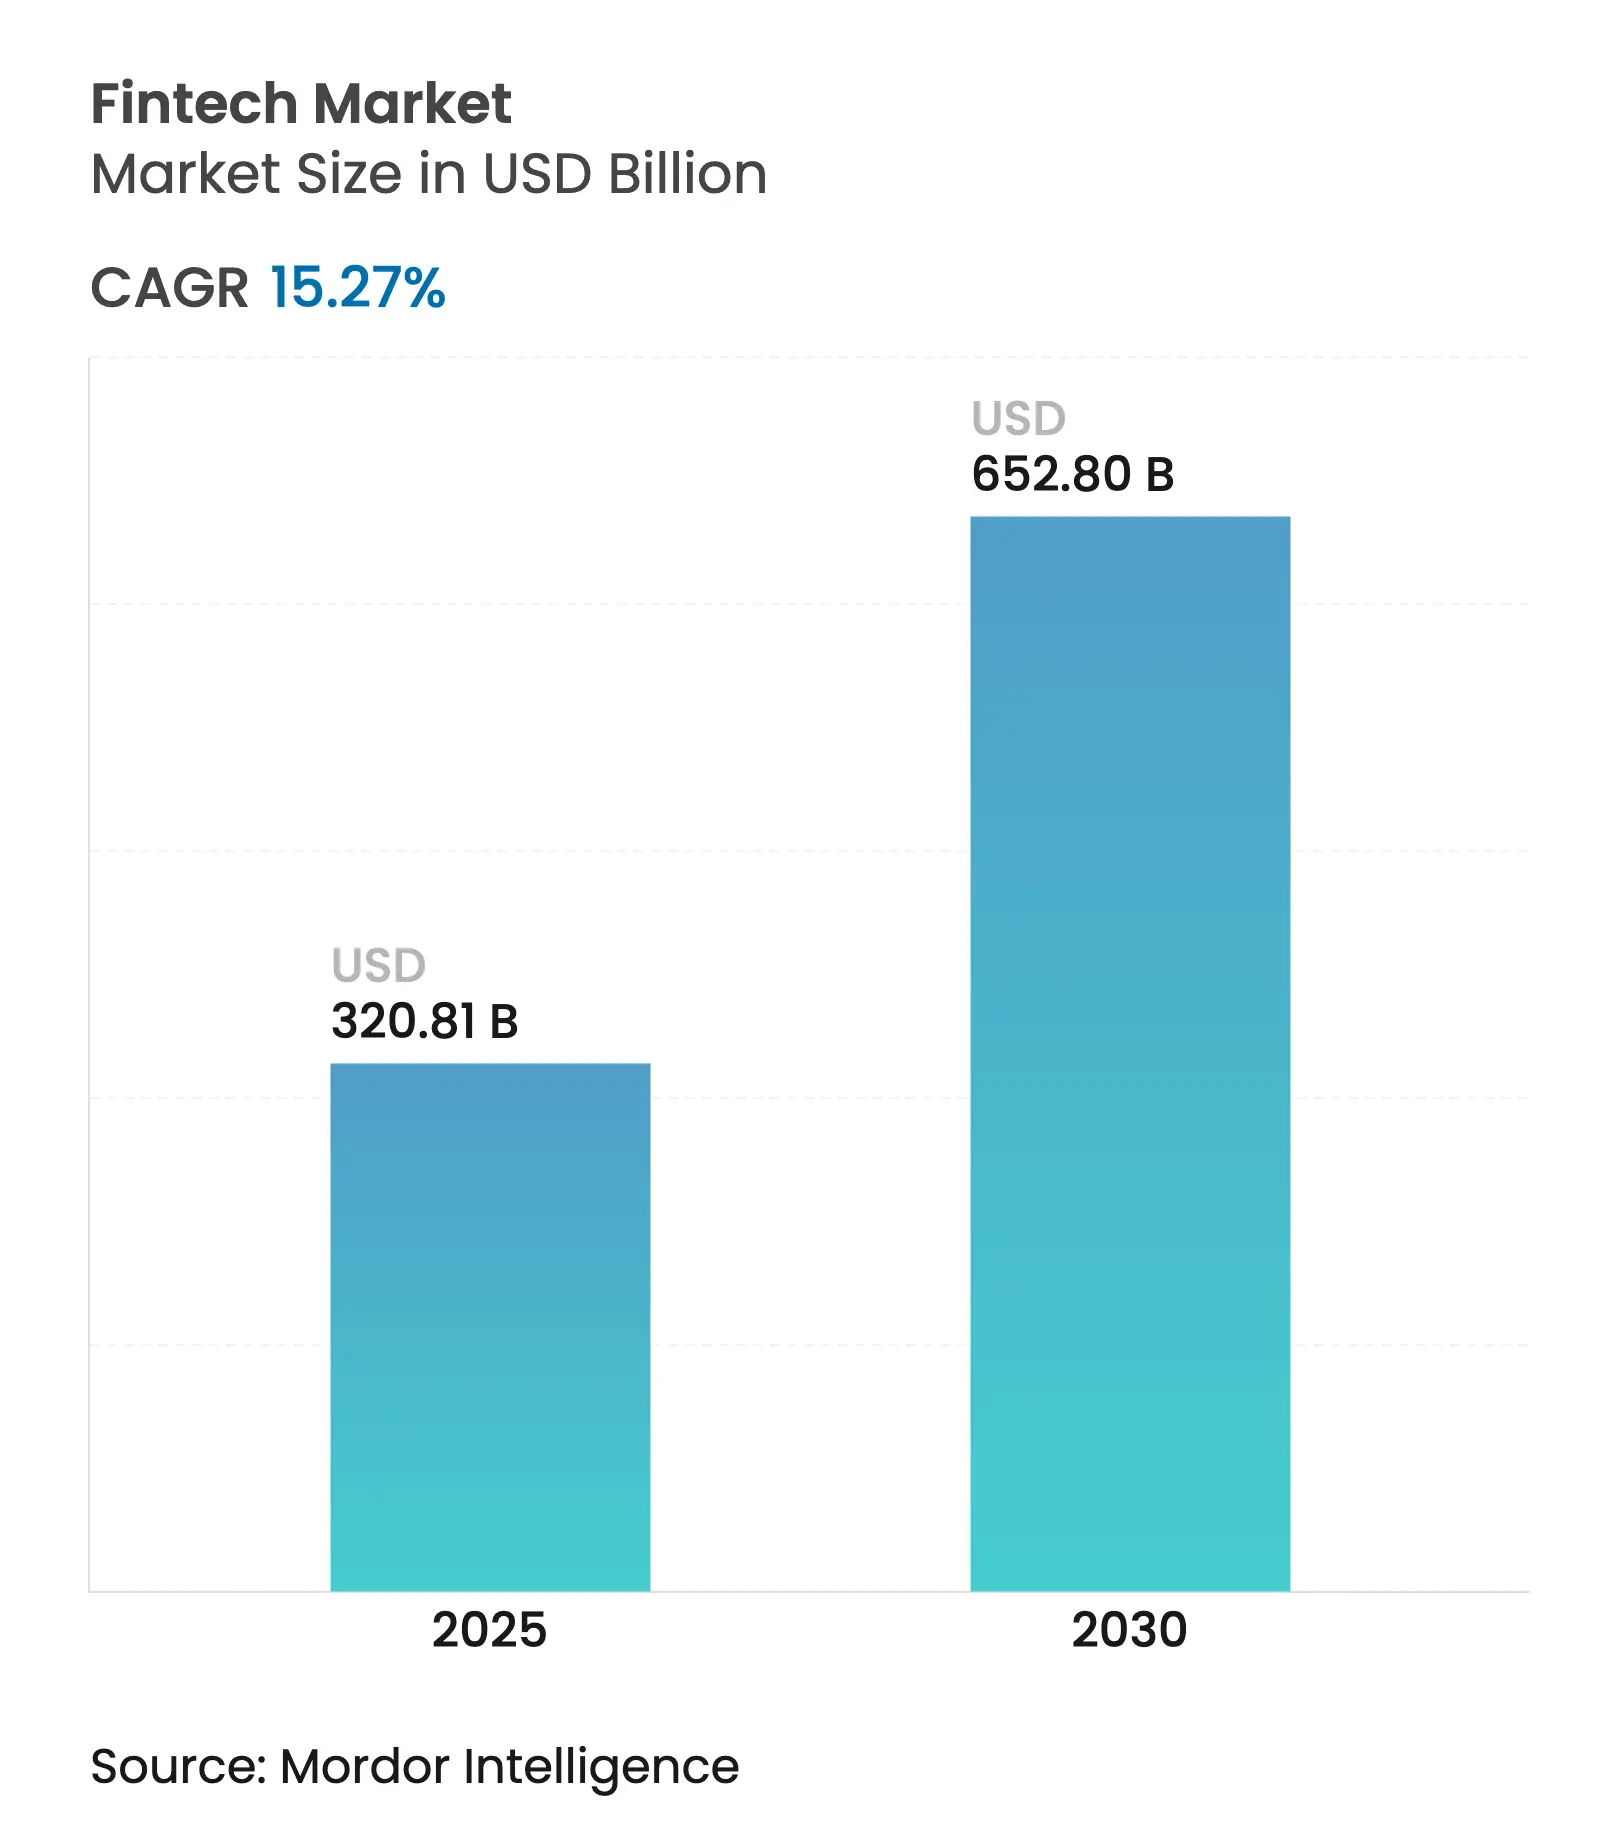
| Market Size (2025) | USD 320.81 Billion |
| Market Size (2030) | USD 652.80 Billion |
| Growth Rate (2025 - 2030) | 15.27 % CAGR |
| Fastest Growing Market | Asia Pacific |
| Largest Market | Asia Pacific |
| Market Concentration | Medium |
Major Players *Disclaimer: Major Players sorted in no particular order. Image © Mordor Intelligence. Reuse requires attribution under CC BY 4.0. |

Fintech Market Analysis by Mordor Intelligence
Strong tailwinds include harmonizing regulations that ease cross-border expansion, real-time payment rails that accelerate transaction flows, and widening access to open-banking data. Competitive intensity is heightening as platform giants embed contextual finance into everyday digital journeys, shrinking the gap between commerce and financial services. Artificial-intelligence tools for fraud prevention, credit decisioning, and personalized offers are moving from experimental pilots to scale deployments, tilting the advantage toward firms with deep data capabilities. Simultaneously, capital markets are reopening for profitable fintech operators, enabling fresh funding for product expansion and strategic acquisitions.
Key Report Takeaways
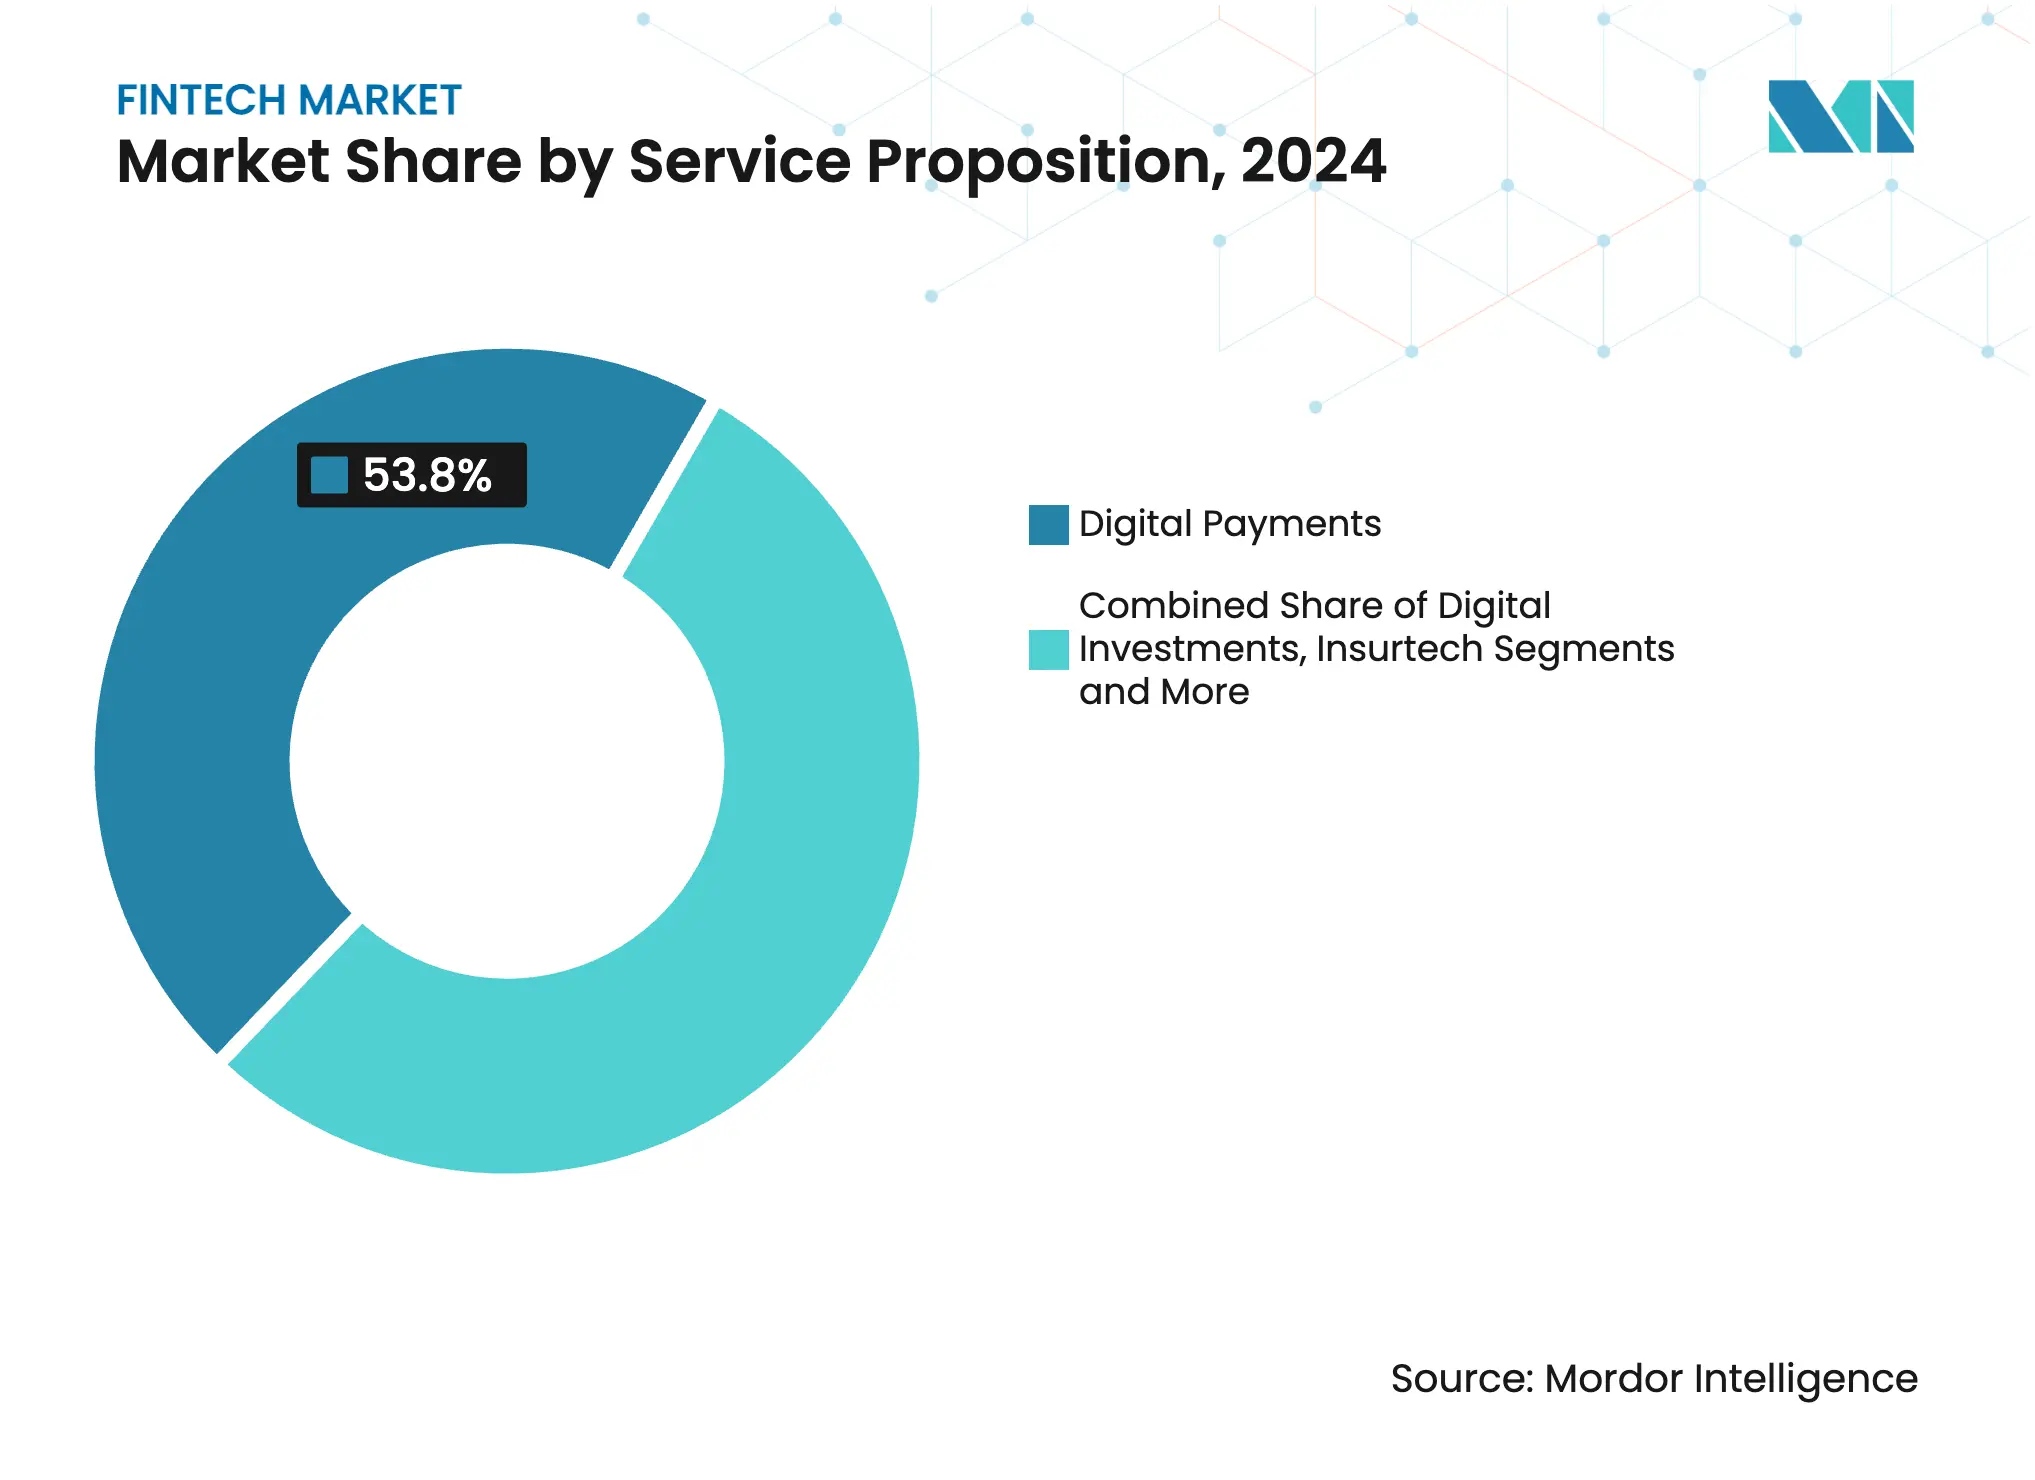
- By service proposition, digital payments led with 46.2% of fintech market share in 2024, while neobanking is projected to expand at an 18.7% CAGR to 2030.
- By end-user, the retail segment held 62.1% of the fintech market size in 2024; the business segment is expected to advance at a 16.5% CAGR through 2030.
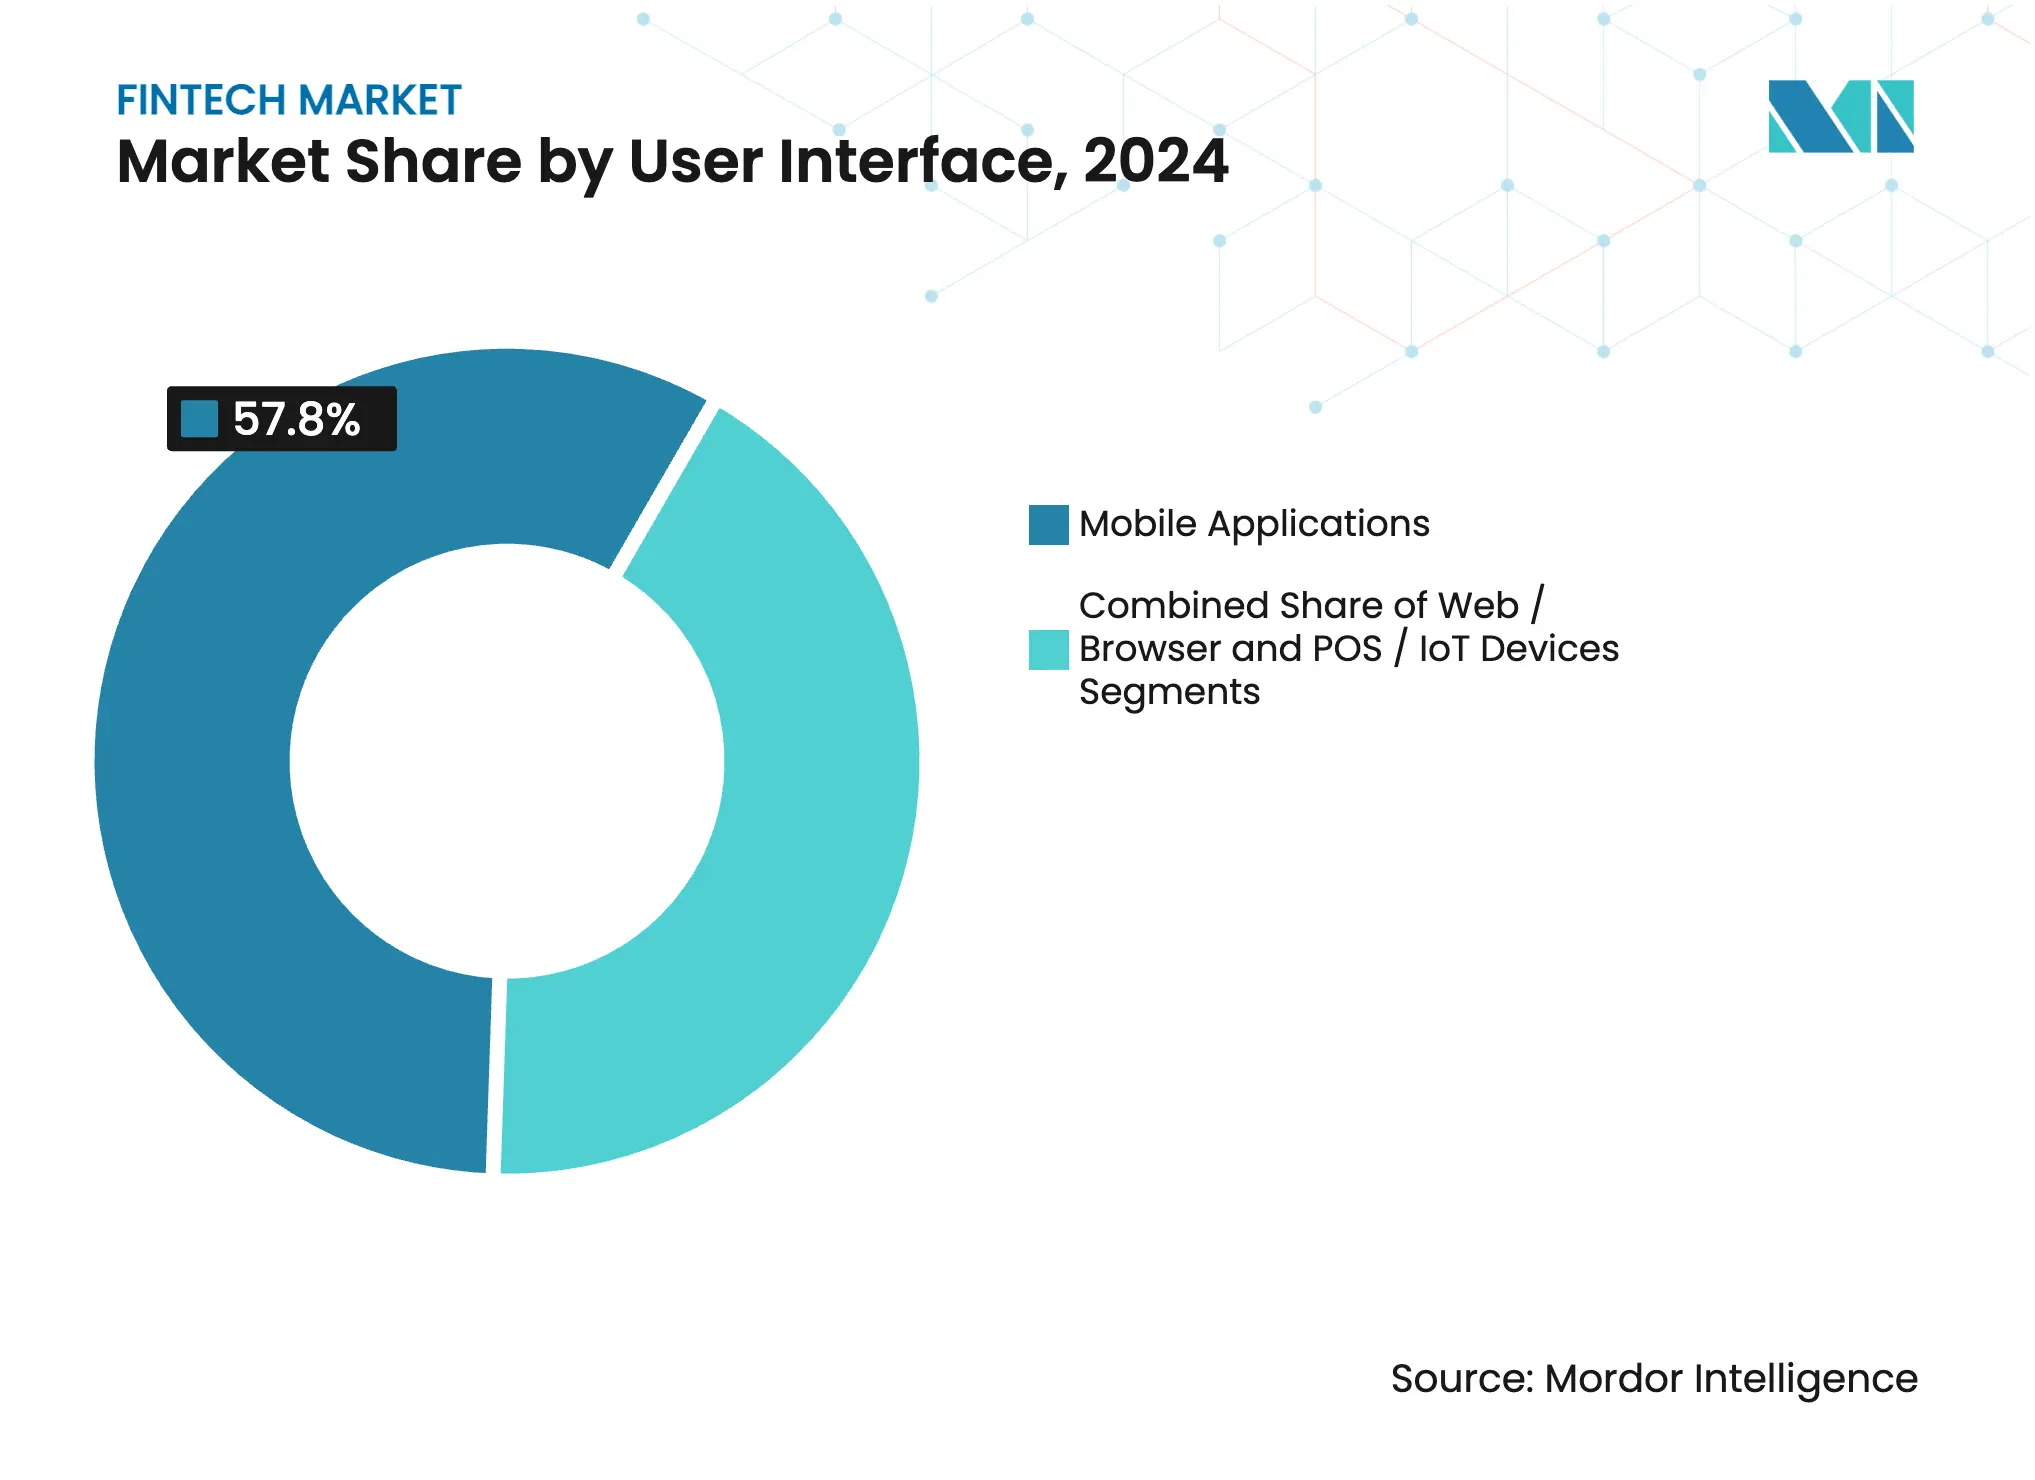
- By user interface, mobile applications commanded 57.8% of fintech market share in 2024, whereas POS/IoT devices post the fastest 17.9% CAGR to 2030.
- By region, Asia-Pacific accounted for 44.86% of the fintech market in 2024 and is forecasted to grow at a 16.02% CAGR to 2030.
Note: Market size and forecast figures in this report are generated using Mordor Intelligence's proprietary estimation framework, updated with the latest available data and insights as of January 2026.
Global Fintech Market Trends and Insights
Drivers Impact Analysis
| Driver | (~) % Impact on CAGR Forecast | Geographic Relevance | Impact Timeline |
|---|---|---|---|
Real-time payments mandates
|
+2.5%
|
North America, Europe, Asia-Pacific
|
Medium term (2-4 years)
|
Open-banking & API standardization
| +2.2% | Europe, South America, Global rollout | Medium term (2-4 years) |
CBDC pilots in China & India
| +1.8% | Asia-Pacific, Global spillover | Long term (≥4 years) |
Rise of embedded finance on Asian e-commerce platforms
| +2% | Asia-Pacific, North America | Short term (≤2 years) |
SME credit gap in MENA & South America
| +1.5% | Middle East, North Africa, South America | Medium term (2-4 years) |
ESG-linked fintech solutions
| +1.2% | Europe, North America, Asia-Pacific | Long term (≥4 years) |
| Source: Mordor Intelligence | |||
Real-time payments mandates accelerating fintech adoption
Central-bank systems such as FedNow in the United States and SEPA Instant Credit Transfer in Europe are transforming settlement expectations from hours to seconds. Faster clearing underpins new value propositions in treasury management, micro-lending, and cash-flow analytics, helping the fintech market reach enterprise customers that once relied on slower batch processes. In 2025, U.S. real-time transactions are expected to hit 7.4 billion, and similar momentum is visible in China, the United Kingdom, and Hong Kong. Providers that integrate overlay services - request to pay, automated reconciliation, and just-in-time financing - gain sticky revenue streams grounded in the same rails. Adoption is most rapid where regulators set explicit migration deadlines and update settlement finality rules. Payment-network interoperability remains the next hurdle, but pilots linking domestic faster-payment systems already demonstrate viable cross-border models.
Open-banking & API standardization broadening data access
PSD2 in Europe and Brazil’s Open Finance regime prove that uniform API specifications can unlock account aggregation, balance verification, and direct-from-bank payments at scale. Standardized consent flows shift competition away from data hoarding toward data utilization, encouraging predictive underwriting and hyper-personalized budgeting tools. Regulators now treat open finance as critical digital infrastructure, prompting adoption across the Americas and parts of Asia-Pacific. Fintech platforms that pair bank-sourced data with merchant, telecom, or social signals create richer risk models, lowering default rates and broadening credit access. The pattern is fostering interoperable fintech market ecosystems where smaller providers tap third-party analytics to compete against incumbents on service quality rather than raw customer reach.
CBDC pilots in China & India driving infrastructure upgrades
Digital-currency trials in Asia’s two largest economies require new authentication, identity resolution, and offline payment features, forcing underlying payment networks to modernize. Fintech firms that re-engineer wallets, point-of-sale devices, and settlement gateways around CBDC design mandates gain first-mover advantage once public rollouts begin. Beyond domestic use, central banks in both countries are testing cross-border corridors that may cut correspondent-bank costs and open adjacent revenue pools in trade finance. Early alignment with CBDC standards positions fintech players to embed programmable money features - conditional disbursements or tax-at-source - into enterprise resource-planning systems. As official guidance stabilizes, venture investment in CBDC-ready core banking modules accelerates, making digital-currency compatibility a prerequisite rather than a differentiator by decade's end.
Rise of embedded finance among Asian e-commerce platforms
Large marketplace operators extend payments, credit, and insurance at checkout, effectively outsourcing financial-product discovery to retail and lifestyle apps with vast user bases. The move compresses customer-acquisition costs and surfaces real-time behavioral data, allowing tailored underwriting for each transaction. Merchants benefit from higher conversion and bigger average order values, while platform operators capture the fee margin historically owned by banks. This embedded model has already spread from Southeast Asian super-apps to North American social-commerce experiments. For the fintech market, the architectural shift reallocates value toward API suppliers, credit-risk engines, and compliance-as-a-service vendors that power embedded transactions behind the scenes.
Restraints Impact Analysis
| Restraint | (~) % Impact on CAGR Forecast | Geographic Relevance | Impact Timeline |
|---|---|---|---|
Regulatory clamp-down on BNPL models
|
-1.8%
|
Europe, North America, Australia
|
Short term (≤2 years)
|
Sophisticated fraud & deepfake identity risks
| -2.2% | Global, higher in emerging markets | Medium term (2-4 years) |
Cloud-concentration risk
| -1.5% | Global, advanced cloud regions | Long term (≥4 years) |
Funding winter & valuation corrections
| -2.5% | North America, Europe | Short term (≤2 years) |
| Source: Mordor Intelligence | |||
Regulatory clamp-down on BNPL models
Consumer-protection agencies in the United Kingdom, the United States, and Australia are drafting rules that classify BNPL products as credit, mandating affordability checks, standardized disclosures, and hardship protocols. Providers must integrate soft-pull credit bureaus, upgrade dispute-resolution workflows, and adjust revenue models away from late-fee dependency. Compliance costs rise, encouraging consolidation and alliances with regulated lenders that already hold lending licenses. Retailers may experience slower BNPL checkout adoption in the near term, but transparent terms could expand the addressable base over time. Fintech firms that pre-emptively embed regulation-ready data fields and repayment analytics create defensible positions once uniform frameworks crystallize.
Sophisticated fraud & deepfake-based identity risks
Synthetic-media tools can replicate voices and faces with startling fidelity, undermining biometric authentication at call centers and account-opening stages. Fraud rings exploit real-time payment irrevocability to siphon funds before victims notice. The fintech industry answers with liveness checks, device-graph scoring, and behavioral biometrics, but adversaries adapt rapidly. Regulatory bodies now expect layered controls and continuous monitoring rather than static KYC snapshots. Insurers charge higher cyber-premiums for platforms without anomaly-detection AI, pushing risk-management investment higher up executive agendas. Firms that share threat-intelligence feeds through sector-wide information exchanges reduce detection latency and cut aggregate loss severity, but coordination costs remain a challenge.
Segment Analysis
By Service Proposition: Diverse revenue engines reshape competitive boundaries
Neobanking accounts for a modest slice of the fintech market size yet posts the fastest 18.7% CAGR to 2030, signaling a decisive shift from branch-centric to app-centric banking. Feature velocity, transparent pricing, and personalized insights allow neobanks to capture young, mobile-first consumers. Established lenders react with digital subsidiaries and accelerated core-bank modernization, narrowing the experiential gap but raising technology budgets. Digital-payments solutions hold 46.2% of the fintech market share in 2024 and remain vital gateways for customer acquisition. Providers layer fraud-analytics, loyalty integrations, and working-capital loans onto payment rails, turning low-margin processing into bundled value propositions that lift customer lifetime revenue.
Expanding beyond wallets and cards, insurtech, wealth-tech, and reg-tech carve specialized lanes where data science and automation can upend legacy processes. Usage-based insurance and AI-driven claims triage cut carrier loss ratios, attracting joint ventures between insurers and cloud vendors. In wealth management, fractional ownership and automated rebalancing democratize investing, while compliance-automation tools monetize new reporting mandates. The ability to orchestrate multiple service propositions within a single experience defines future winners, pushing fintech platforms toward modular architectures that let users toggle between payments, credit, savings, and protection.
Note: Segment shares of all individual segments available upon report purchase
By End-User: Enterprise demand narrows the retail lead
Retail clients still represent 62.1% of fintech market share in 2024 as millions of consumers migrate daily banking, payments, and investments to mobile apps. Gamified interfaces, subscription-free accounts, and instant settlement sustain stickiness in competitive urban segments. Yet the business user base is expanding faster, propelling a 16.5% CAGR as SMEs digitize invoices, payroll, and supplier financing. Fintech suites plug directly into enterprise resource-planning systems, automating reconciliation and liquidity forecasting and lifting adoption beyond early-stage start-ups.
Corporates increasingly demand embedded treasury dashboards that merge FX hedging, card issuing, and cash pooling under unified APIs. This functionality shortens decision cycles and strengthens vendor resilience. Meanwhile, retail fintech products diversify into buy-now-pay-later, micro-investing, and budget coaching features that extend customer lifespan. Competitive pressure centers on acquiring low-cost deposits and transactional data, prompting partnerships where banks supply balance-sheet capacity while fintech apps maintain user engagement.
By User Interface: Omnichannel strategies evolve around device realities
Mobile applications dominate daily interactions, holding 57.8% of the fintech market size as users favor fingertip access, instant notifications, and biometric login. App-native experiences integrate geolocation, push alerts, and camera-based cheque capture, cementing convenience as table stakes. Web dashboards remain crucial for long-form tasks such as tax reporting, portfolio analysis, and multi-account treasury management, offering feature depth unavailable on small screens.
POS and IoT devices exhibit the fastest 17.9% CAGR over the forecast period, riding the shift from isolated payment terminals to multifunction commerce hubs that unify inventory, loyalty, booking, and analytics. Software-defined POS allows rapid firmware pushes, enabling incremental feature monetization without hardware swaps. Voice-activated banking on smart speakers and automotive consoles emerges as a nascent channel, hinting at broader ambient-finance adoption. Vendors that map the right use case to each interface—rather than blindly mirroring screens—improve engagement metrics and reduce customer-support load.
Note: Segment shares of all individual segments available upon report purchase
Geography Analysis
Asia-Pacific commanded 44.86% of the fintech market in 2024 and is on track for a 16.02% CAGR through 2030. China’s super-app ecosystem and India’s UPI rails anchor regional growth, joined by Southeast Asian digital-bank license programs that lower entry barriers. Governments treat fintech as a lever for economic inclusion, streamlining e-KYC norms and nurturing sandboxes. Regional incumbents respond with strategic venture arms that inject capital into start-ups, hedging disruption risk while tapping novel capabilities.
North America remains an innovative powerhouse despite maturing user penetration. AI-driven personalization, crypto-asset services, and cloud-native core banking differentiate offerings as regulators provide clearer guidance on stablecoins and digital-asset custody. Venture funding gravitates toward firms with secure data-exchange protocols, reflecting lessons from high-profile cyber incidents. The fintech market in the region continues to benefit from deep capital markets that reward proven revenue retention and cross-selling metrics.
Europe’s regulatory leadership shapes its fintech trajectory. PSD2 catalyzed open-banking platforms, MiCA brings clarity to crypto-asset issuance, and DORA sets stringent operational-resilience rules. These frameworks spawn specialized reg-tech vendors and compliance-as-a-service products, adding new revenue layers. Continental neobanks localize services across multi-currency regimes while passporting licenses to scale. Additionally, green-finance imperatives stimulate climate-data fintech platforms that measure scope-3 emissions at the transaction level.
South America showcases rising adoption curves anchored by Brazil’s PIX instant-payment network. Large unbanked populations and mobile-first behavior create fertile ground for wallet providers, digital lenders, and micro-insurance schemes. Regulatory openness to sandbox testing attracts international capital, and domestic champions scale regionally by offering low-cost remittances and credit scoring tied to utility-bill histories. As the infrastructure matures, the region exports talent and product frameworks to other emerging markets.
Middle East and Africa present heterogeneous opportunity sets. Gulf Cooperation Council states issue digital-bank licenses, host government-backed fintech accelerators, and invest sovereign wealth in AI-centric finance ventures. Africa’s mobile-money rails remain world-leading in transaction volume, and remittance corridors integrate with diaspora wallets abroad. Regional fintech themes include Sharia-compliant embedded finance, low-fee cross-border transfers, and agricultural-input lending facilitated via satellite agronomy data.

Reports are available across multiple geographies.
Gain in-depth market insights across regions to support informed decisions.
Competitive Landscape
Market Concentration
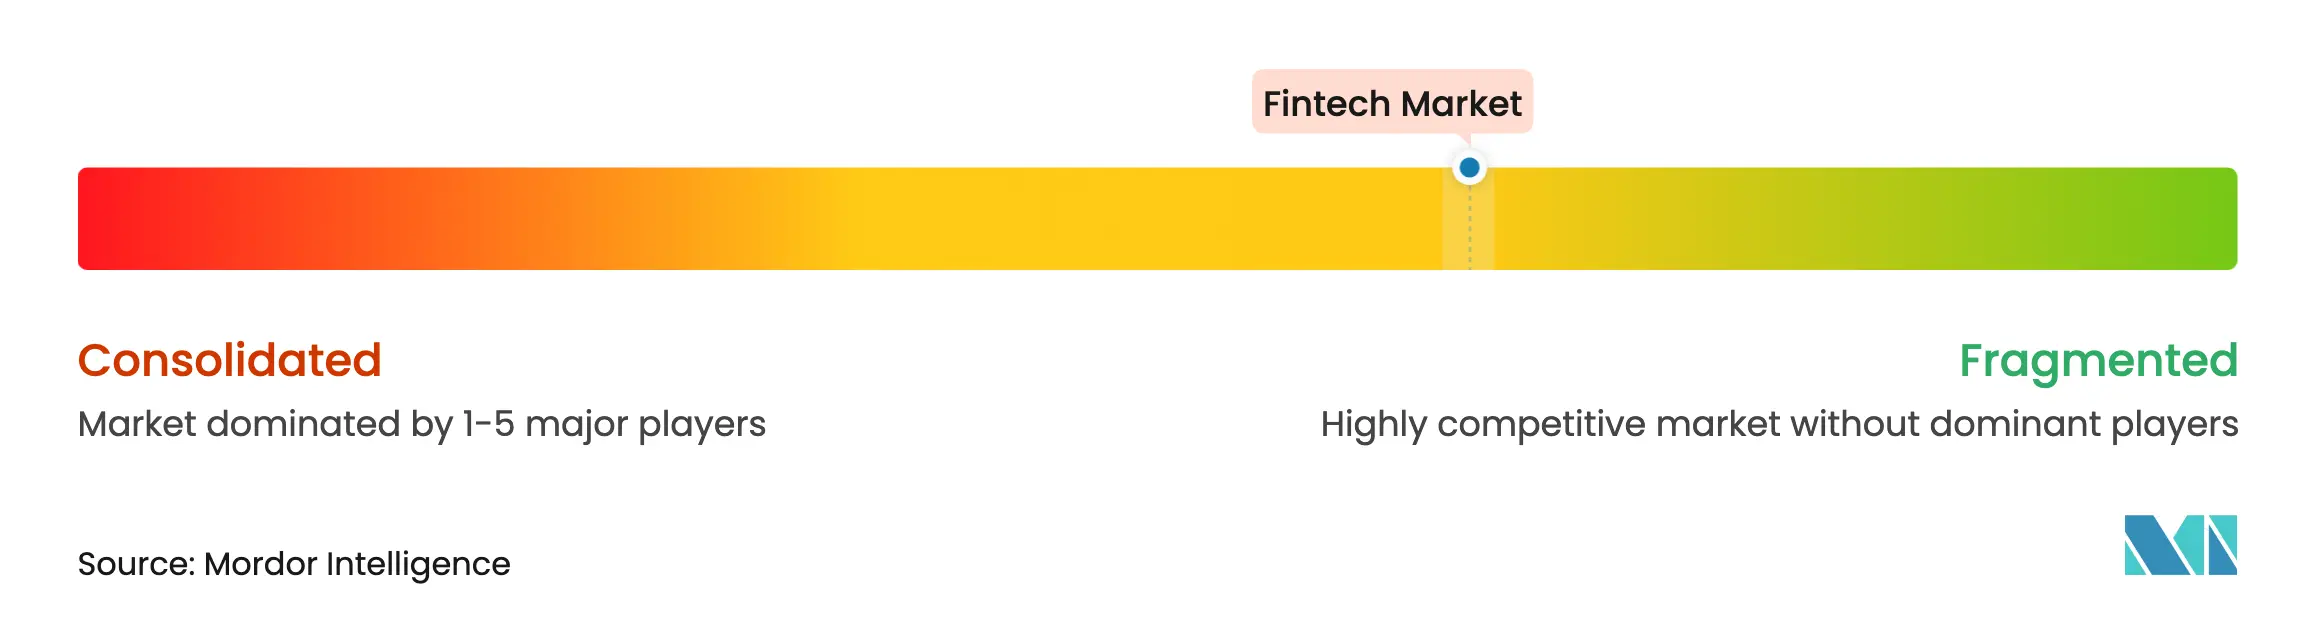
Industry structure resembles a barbell. At one end, diversified giants such as Visa, Mastercard, and PayPal fortify network effects by broadening developer toolkits, bleeding into lending, and rolling out stablecoin settlement layers. At the other end, niche specialists tackle single pain points—instant payroll, gig-worker insurance, or AI-based transaction categorization—often partnering with larger processors for distribution. M&A activity intensifies as public-market valuations stabilize, enabling strategic bolt-ons that fill feature gaps.
Data stewardship and trust act as decisive competitive levers. Firms with longitudinal user histories train superior machine-learning models that detect anomalies, personalize offers, and optimize pricing. Cloud cost management and sovereign-data compliance shape vendor selection, pushing hyperscalers to add in-country infrastructure and financial-services compliance blueprints. In payments, contactless and tokenization standards distribute security duties across the transaction chain, benefiting platforms that coordinate multi-party certification efforts.
Strategic collaboration trumps outright rivalry in many verticals. Banks supply balance-sheet depth, while fintech partners manage design agility and customer engagement. Several national switches license their rails to private wallets instead of building competing front-end apps, aligning incentives. In capital markets, embedded-investment APIs let consumer platforms offer fractional equities without managing custody directly. Competitive intensity now orbits customer experience and cost-to-serve rather than exclusive access to rails.
Fintech Industry Leaders

*Disclaimer: Major Players sorted in no particular order
Recent Industry Developments
- July 2026: Juspay partnered with Recurly to integrate its open-source payment orchestration platform, Hyperswitch, enabling subscription merchants to access over 300 payment service providers (PSPs) globally, reduce payment failures, and accelerate international expansion.
- June 2026: Juspay joined the Mastercard Engage partner network to expand adoption of Click to Pay, strengthening tokenized digital checkout capabilities for merchants worldwide.
- March 2025: Visa launched a stablecoin settlement service with Fireblocks to enable USDC clearing.
- February 2025: Stripe acquired Bridge for USD 165 million, adding crypto-infrastructure capabilities.
Table of Contents for Fintech Industry Report
1. Introduction
- 1.1 Study Assumptions & Market Definition
- 1.2 Scope of the Study
2. Research Methodology
3. Executive Summary
4. Market Landscape
- 4.1 Market Overview
- 4.2 Market Drivers
- 4.2.1 Real-time Payments Mandates (FedNow, SEPA Instant Credit Transfer) Accelerating Fintech Adoption
- 4.2.2 Open-Banking & API Standardization (PSD2, Brazil Open Finance) Broadening Data Access
- 4.2.3 CBDC Pilots in China & India Driving Fintech Infrastructure Upgrades
- 4.2.4 Rise of Embedded-Finance Among Asian E-commerce Platforms
- 4.2.5 SME Credit Gap in MENA & South America Fueling Digital Lending Platforms
- 4.2.6 ESG-Linked Fintech Solutions Attracting Green-Investment Funds in Europe
- 4.3 Market Restraints
- 4.3.1 Regulatory Clamp-down on BNPL Models
- 4.3.2 Sophisticated Fraud & Deepfake?based Identity Risks
- 4.3.3 Cloud-Concentration Risk Creating Single Points-of-Failure
- 4.3.4 Funding Winter & Valuation Corrections Curbing Scale-ups
- 4.4 Value / Supply-Chain Analysis
- 4.5 Regulatory Outlook
- 4.6 Technological Outlook
- 4.7 Porter's Five Forces
- 4.7.1 Threat of New Entrants
- 4.7.2 Bargaining Power of Buyers/Consumers
- 4.7.3 Bargaining Power of Suppliers
- 4.7.4 Threat of Substitutes
- 4.7.5 Intensity of Competitive Rivalry
- 4.8 Investment & Funding Trend Analysis
5. Market Size & Growth Forecasts (Value)
- 5.1 By Service Proposition
- 5.1.1 Digital Payments
- 5.1.2 Digital Lending and Financing
- 5.1.3 Digital Investments
- 5.1.4 Insurtech
- 5.1.5 Neobanking
- 5.2 By End-User
- 5.2.1 Retail
- 5.2.2 Businesses
- 5.3 By User Interface
- 5.3.1 Mobile Applications
- 5.3.2 Web / Browser
- 5.3.3 POS / IoT Devices
- 5.4 By Region
- 5.4.1 North America
- 5.4.1.1 United States
- 5.4.1.2 Canada
- 5.4.1.3 Mexico
- 5.4.2 South America
- 5.4.2.1 Brazil
- 5.4.2.2 Argentina
- 5.4.2.3 Chile
- 5.4.2.4 Colombia
- 5.4.2.5 Rest of South America
- 5.4.3 Europe
- 5.4.3.1 United Kingdom
- 5.4.3.2 Germany
- 5.4.3.3 France
- 5.4.3.4 Spain
- 5.4.3.5 Italy
- 5.4.3.6 Benelux (Belgium, Netherlands, and Luxembourg)
- 5.4.3.7 Nordics (Sweden, Norway, Denmark, Finland, and Iceland)
- 5.4.3.8 Rest of Europe
- 5.4.4 Asia-Pacific
- 5.4.4.1 China
- 5.4.4.2 India
- 5.4.4.3 Japan
- 5.4.4.4 South Korea
- 5.4.4.5 Australia
- 5.4.4.6 South-East Asia (Singapore, Indonesia, Malaysia, Thailand, Vietnam, and Philippines)
- 5.4.4.7 Rest of Asia-Pacific
- 5.4.5 Middle East and Africa
- 5.4.5.1 United Arab Emirates
- 5.4.5.2 Saudi Arabia
- 5.4.5.3 South Africa
- 5.4.5.4 Nigeria
- 5.4.5.5 Rest of Middle East and Africa
6. Competitive Landscape
- 6.1 Market Concentration
- 6.2 Strategic Moves
- 6.3 Market Share Analysis
- 6.4 Company Profiles (includes Global level Overview, Market Level Overview, Core Segments, Financials as available, Strategic Information, Market Rank/Share for Key Companies, Products & Services, and Recent Developments)
- 6.4.1 PayPal Holdings Inc.
- 6.4.2 Ant Group Co. Ltd.
- 6.4.3 Stripe Inc.
- 6.4.4 Block Inc. (Square, Cash App)
- 6.4.5 Adyen N.V.
- 6.4.6 Coinbase Global Inc.
- 6.4.7 Robinhood Markets Inc.
- 6.4.8 Revolut Ltd.
- 6.4.9 Klarna Bank AB
- 6.4.10 N26 GmbH
- 6.4.11 SoFi Technologies Inc.
- 6.4.12 Nubank (Nu Holdings)
- 6.4.13 Wise plc
- 6.4.14 Juspay
- 6.4.15 FIS Global
- 6.4.16 Fiserv Inc.
- 6.4.17 Intuit Inc.
- 6.4.18 M-PESA (Vodafone / Safaricom)
- 6.4.19 Paytm Digital Payments Ltd.
- 6.4.20 Razorpay Software Pvt Ltd.
7. Market Opportunities & Future Outlook
- 7.1 White-space & Unmet-Need Assessment
Scope and Methodology
The term fintech (financial technology) is used to refer to computer programs and other modern technologies used by different businesses that offer automated and improved financial services.
The global fintech market can be segmented based on service proposition and geography. By service proposition, the financial technology industry is segmented into money transfer and payments, savings and investments, digital lending and lending marketplaces, online insurance and insurance marketplaces, and other service propositions. By geography, the market is segmented into Europe, Asia-Pacific, North America, Latin America, and the Middle East and Africa. The fintech market research report offers fintech market size and forecasts in value terms (USD) for all the above-mentioned segments.
| By Service Proposition | Digital Payments | |
| Digital Lending and Financing | ||
| Digital Investments | ||
| Insurtech | ||
| Neobanking | ||
| By End-User | Retail | |
| Businesses | ||
| By User Interface | Mobile Applications | |
| Web / Browser | ||
| POS / IoT Devices | ||
| By Region | North America | United States |
| Canada | ||
| Mexico | ||
| South America | Brazil | |
| Argentina | ||
| Chile | ||
| Colombia | ||
| Rest of South America | ||
| Europe | United Kingdom | |
| Germany | ||
| France | ||
| Spain | ||
| Italy | ||
| Benelux (Belgium, Netherlands, and Luxembourg) | ||
| Nordics (Sweden, Norway, Denmark, Finland, and Iceland) | ||
| Rest of Europe | ||
| Asia-Pacific | China | |
| India | ||
| Japan | ||
| South Korea | ||
| Australia | ||
| South-East Asia (Singapore, Indonesia, Malaysia, Thailand, Vietnam, and Philippines) | ||
| Rest of Asia-Pacific | ||
| Middle East and Africa | United Arab Emirates | |
| Saudi Arabia | ||
| South Africa | ||
| Nigeria | ||
| Rest of Middle East and Africa | ||
