
Chromatography Instrumentation Market Size and Share
Market Overview
| Study Period | 2020 - 2031 |
|---|---|
| Market Size (2026) | USD 10.63 Billion |
| Market Size (2031) | USD 13.52 Billion |
| Growth Rate (2026 - 2031) | 4.92% CAGR |
| Fastest Growing Market | Asia Pacific |
| Largest Market | North America |
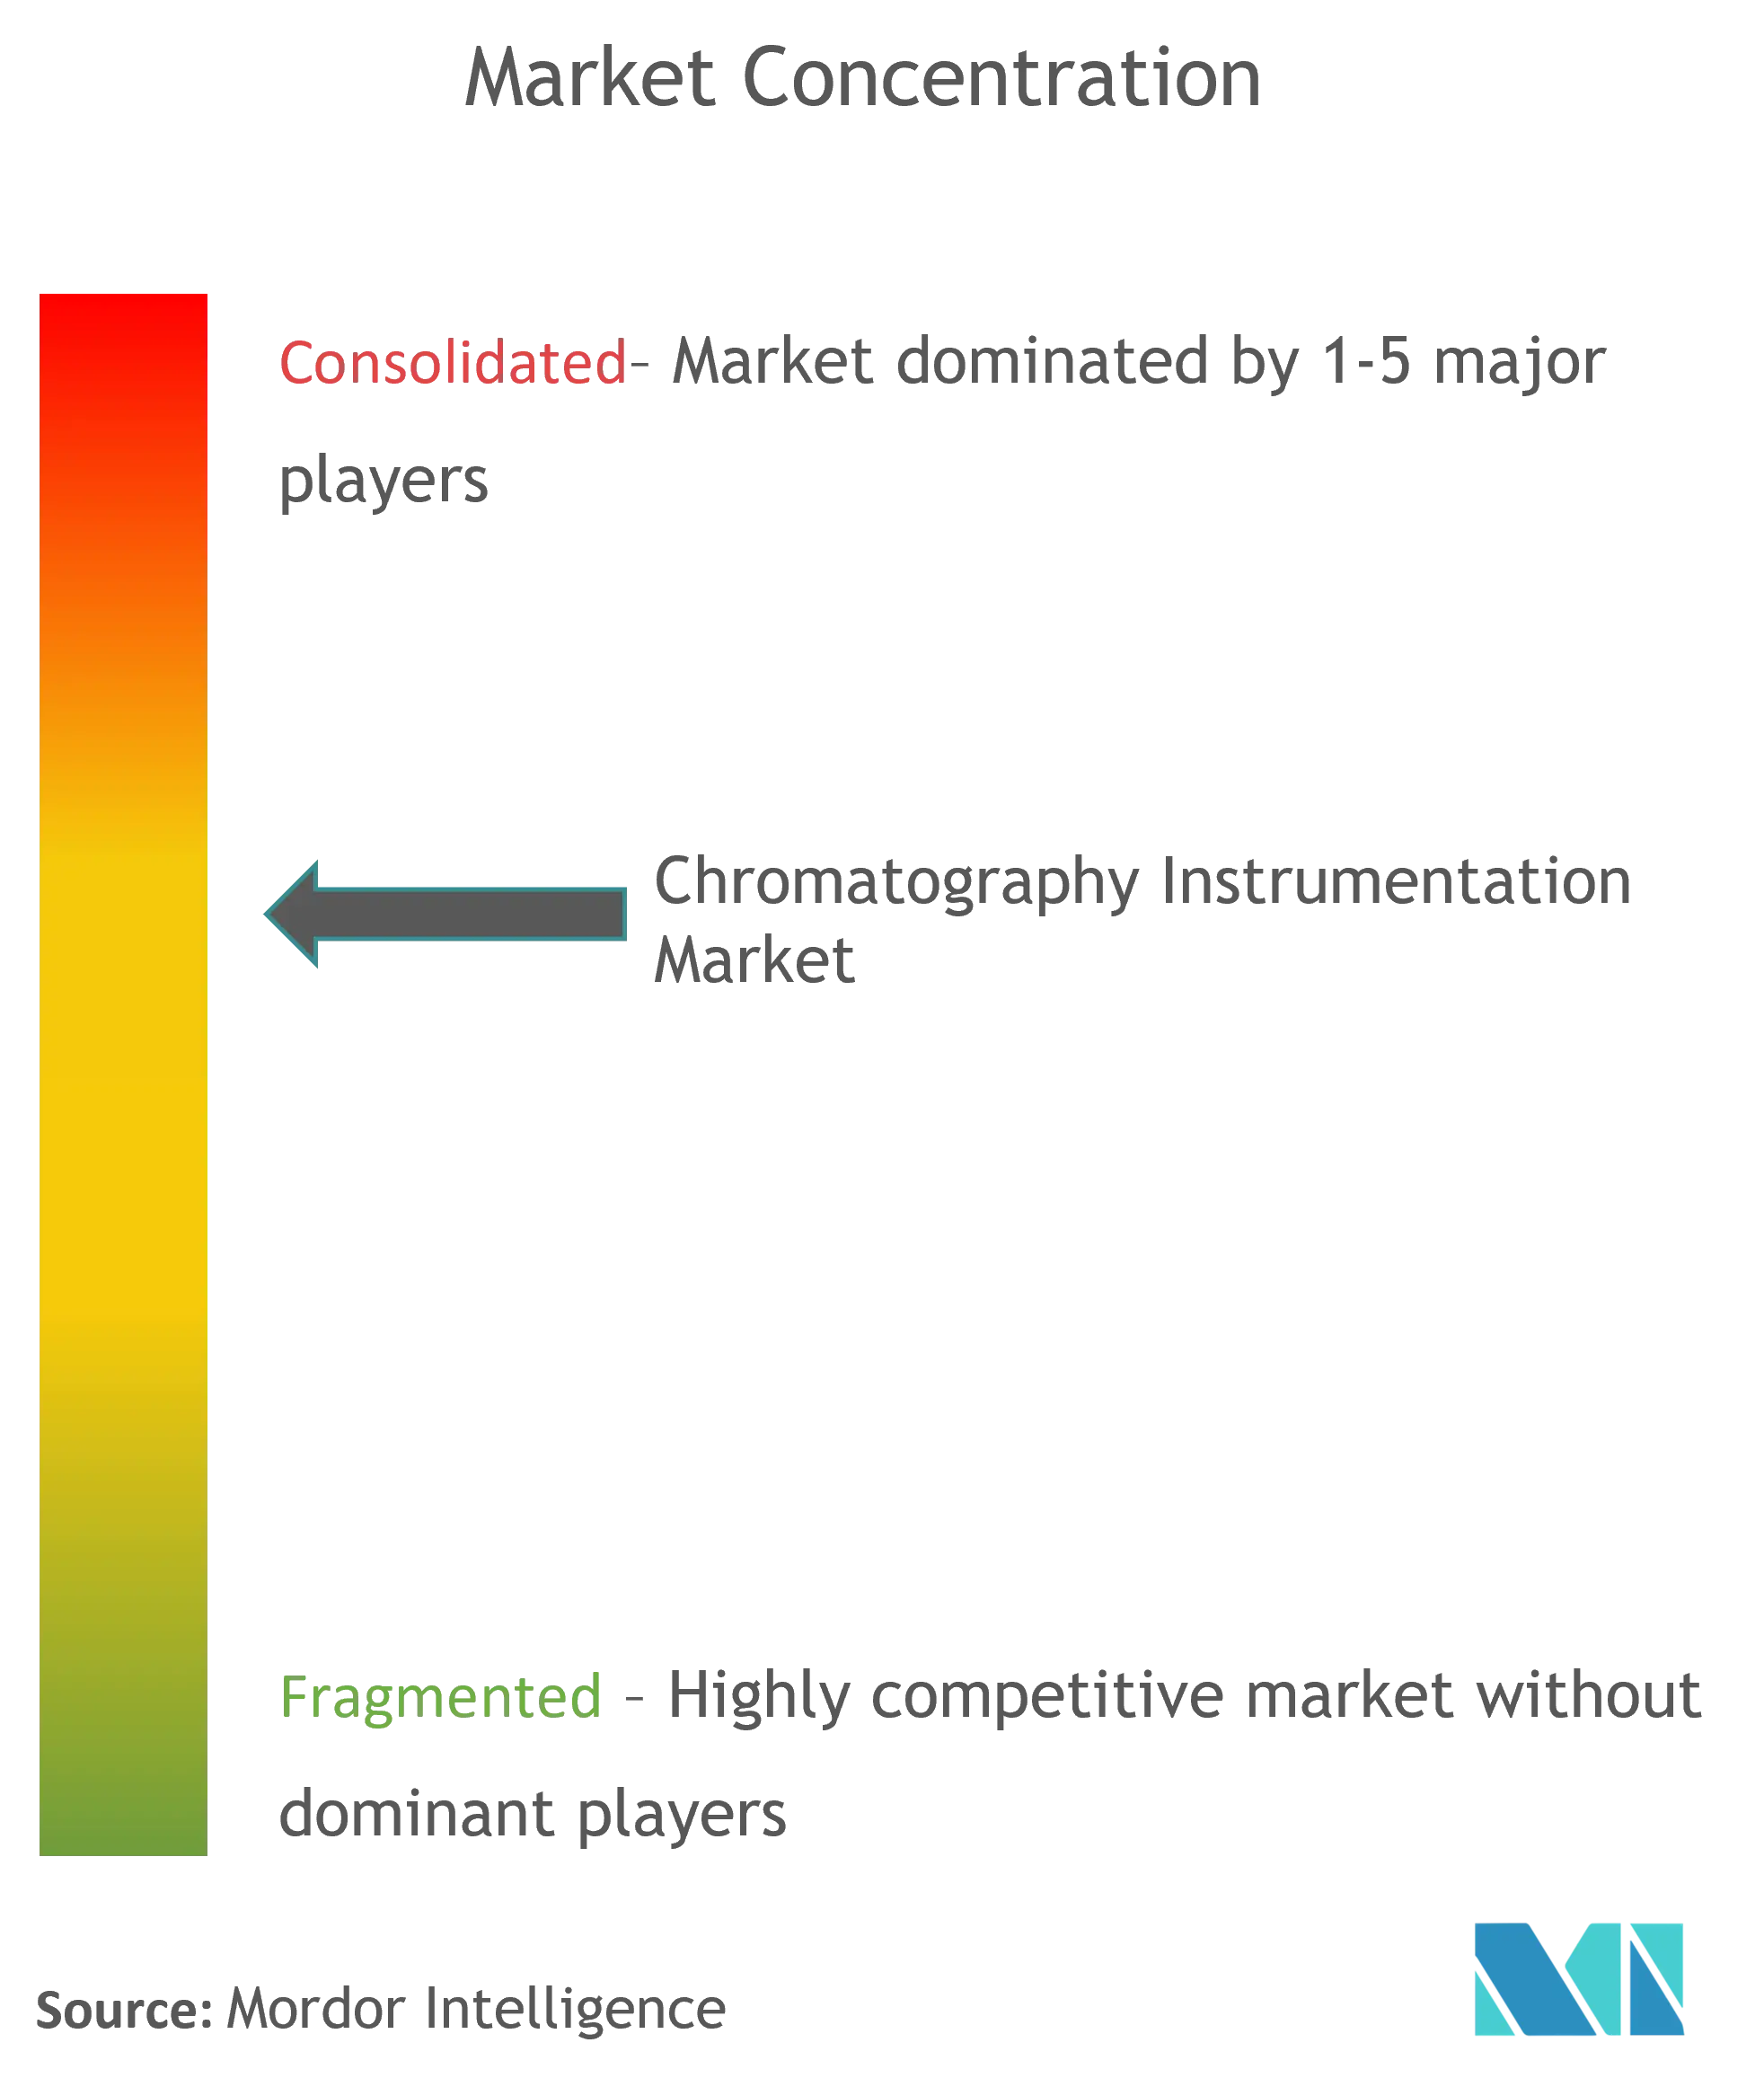
| Market Concentration | Medium |
Major Players *Disclaimer: Major Players sorted in no particular order Image © Mordor Intelligence. Reuse requires attribution under CC BY 4.0. | |
Chromatography Instrumentation Market Analysis by Mordor Intelligence
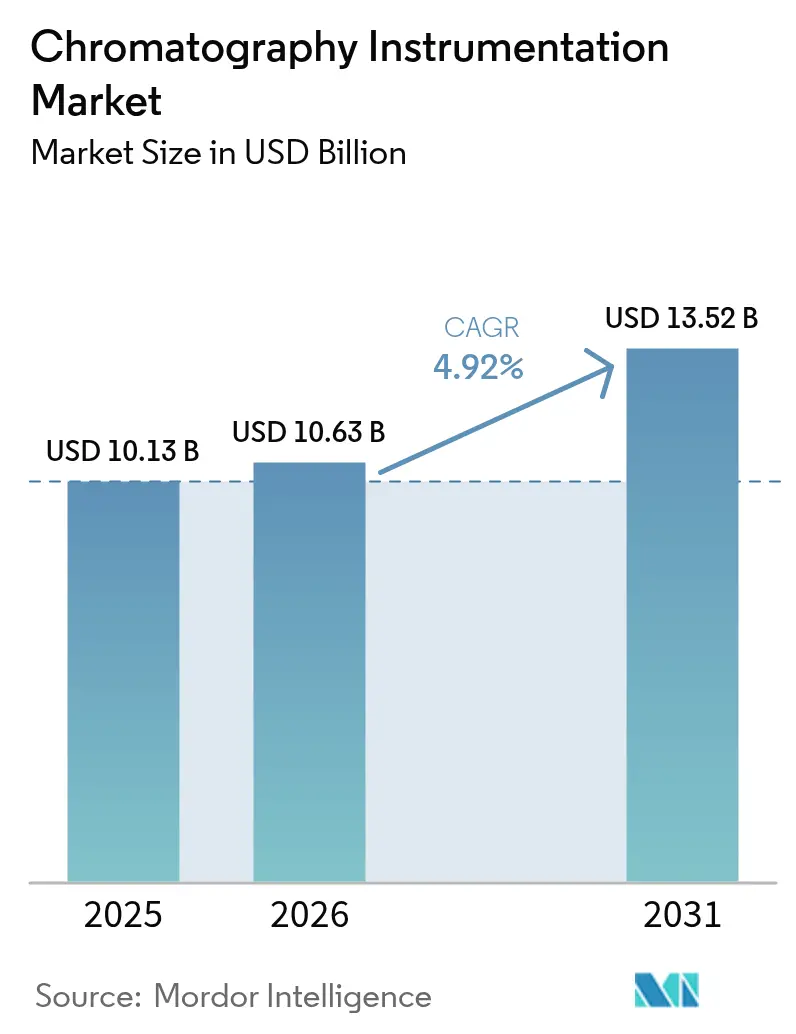
The Global Chromatography Instrumentation Market size is expected to grow from USD 10.13 billion in 2025 to USD 10.63 billion in 2026 and is forecast to reach USD 13.52 billion by 2031 at 4.92% CAGR over 2026-2031.
Rising regulatory scrutiny, expanding biologics pipelines, and rapid automation are reinforcing demand, while artificial-intelligence-enabled platforms are cutting laboratory cycle times by as much as 40%. Pharmaceutical and biopharmaceutical companies account for the most significant revenue contribution, driven by the US FDA’s more rigorous analytical validation guidelines that favor ultra-high-performance systems.[1]US Food & Drug Administration, “Q2(R2) Validation of Analytical Procedures and Q14 Analytical Procedure Development,” fda.gov Parallel expansion of PFAS monitoring and food-safety testing is adding new application breadth, especially for ion and liquid chromatography platforms. Vendors are responding with greener solvent systems, smaller footprints, and cloud-connected software that supports predictive maintenance. Supply-chain localization for critical columns and resins further supports stable long-term growth as manufacturers mitigate geopolitical risk.
Key Report Takeaways
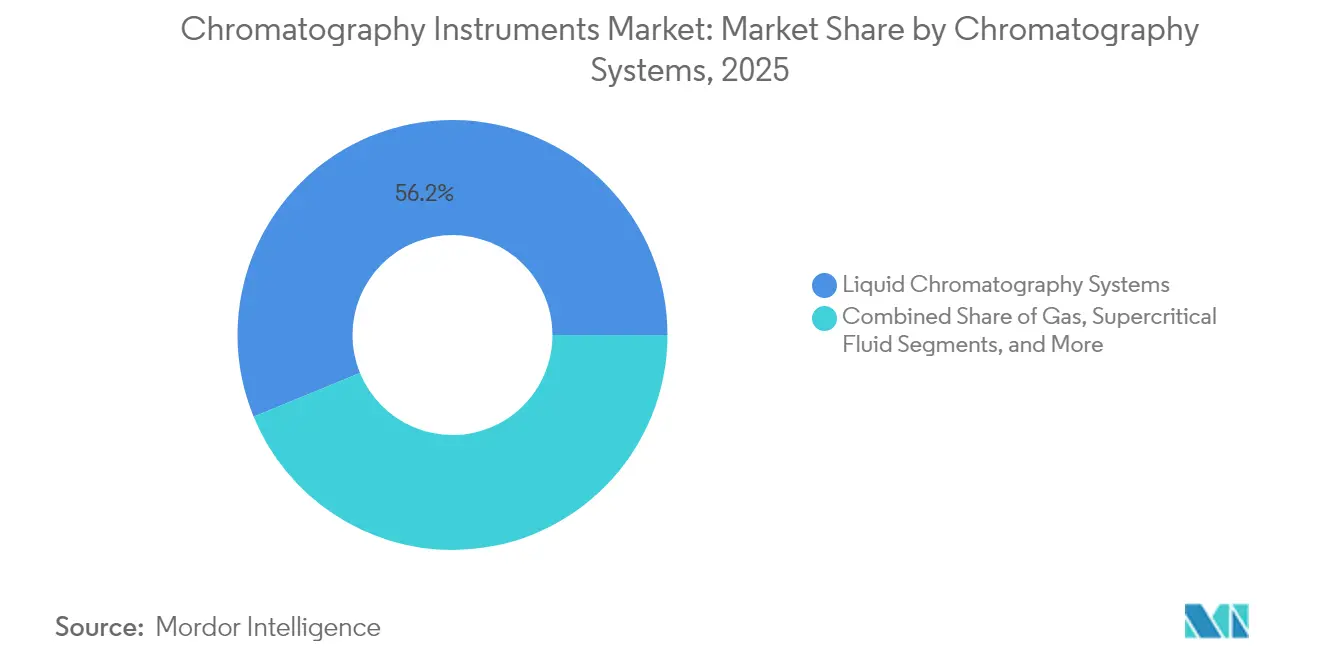
- By device, liquid chromatography systems led with 56.20% of chromatography instrumentation market share in 2025; supercritical fluid chromatography is projected to expand at an 8.45% CAGR through 2031.
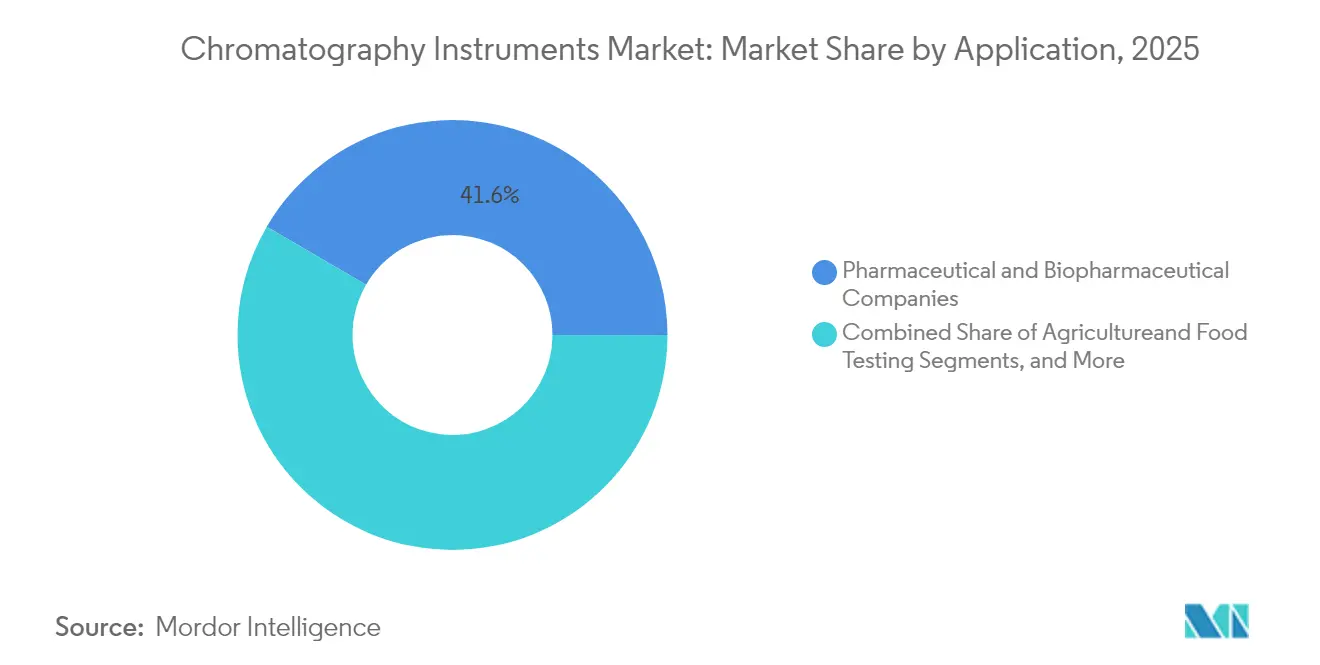
- By application, pharmaceutical and biopharmaceutical laboratories held a 41.60% share of the chromatography instrumentation market size in 2025, whereas environmental testing is set to grow at a 8.95% CAGR to 2031.
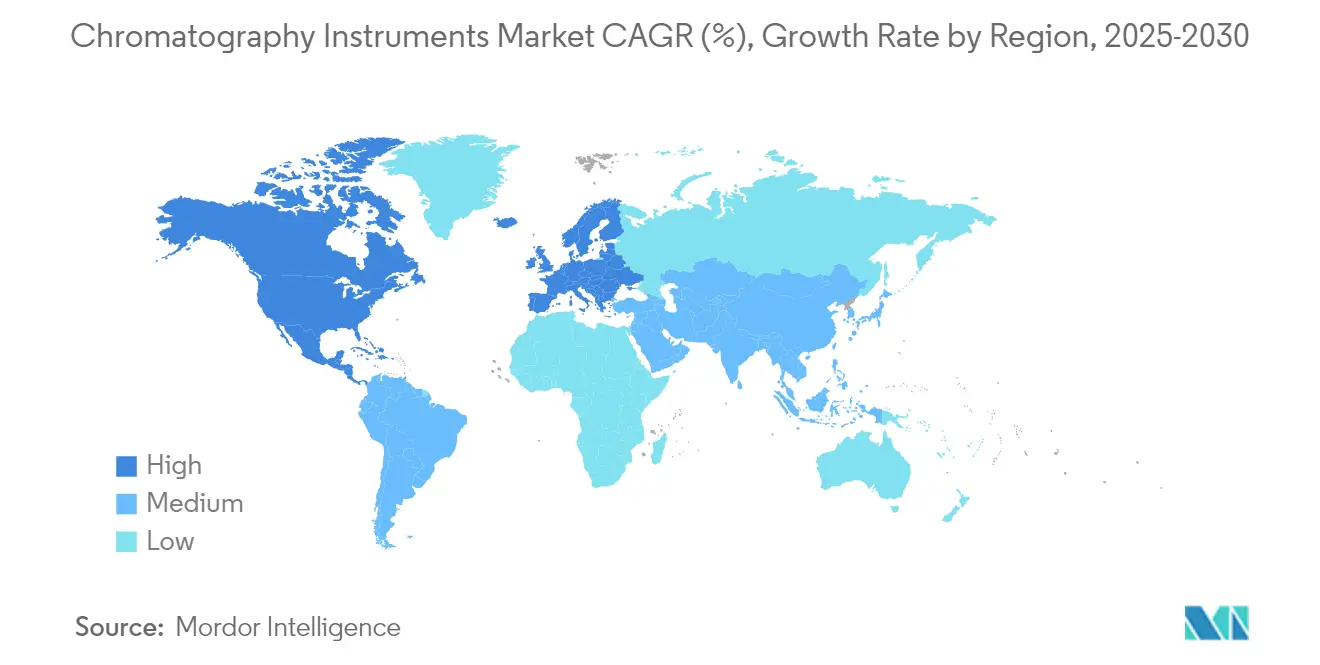
- By geography, North America commanded 38.30% revenue in 2025, while Asia-Pacific is poised for the fastest 7.45% CAGR through 2031.
Note: Market size and forecast figures in this report are generated using Mordor Intelligence’s proprietary estimation framework, updated with the latest available data and insights as of 2026.
Global Chromatography Instrumentation Market Trends and Insights
Drivers Impact Analysis*
| Driver | (~) % Impact on CAGR Forecast | Geographic Relevance | Impact Timeline |
|---|---|---|---|
| Chromatography integral to accelerating biologics & small-molecule drug approvals | +1.20% | Global – strongest in North America & EU | Medium term (2-4 years) |
| Rapid technology advances: miniaturized & UHPLC/UPGC platforms | +0.90% | Global – led by developed markets | Short term (≤ 2 years) |
| Stringent global food-safety and PFAS regulations upping testing volumes | +0.80% | North America & EU primary, expanding to APAC | Long term (≥ 4 years) |
| Expanding bioprocessing & continuous manufacturing in biopharma | +0.70% | Global – APAC fastest | Medium term (2-4 years) |
| Helium shortage spurring alternative-carrier-gas GC upgrades | +0.40% | Global – most acute in legacy labs | Short term (≤ 2 years) |
| AI-powered workflow automation slashing analytical turnaround time | +0.60% | Developed markets first, then global | Medium term (2-4 years) |
| Source: Mordor Intelligence | |||
Chromatography Integral to Accelerating Biologics & Small-Molecule Drug Approvals
Updated Q2(R2) and Q14 guidance from the US FDA now requires stronger evidence of method robustness, prompting widespread upgrades to ultra-high-performance LC-MS platforms. Waters’ Empower software already supports roughly 80% of new drug dossiers worldwide, reflecting the technique’s central role in quality-by-design programs. Demand is especially strong for biocompatible columns that eliminate metal contamination of antibody therapeutics. Continuous manufacturing lines rely on in-line chromatographic monitoring to keep critical process parameters within specification, reinforcing instrumentation sales to contract development and manufacturing organizations.
Rapid Technology Advances: Miniaturized & UHPLC/UPGC Platforms
Latest-generation systems deliver pressures beyond 1,300 bar while embedding self-diagnostic sensors that trigger automated maintenance routines. AI engines now tune gradient profiles in real time, improving peak capacity without operator intervention and reducing solvent use by up to 65%. Microfluidic sample preparation modules minimize reagent consumption and accelerate throughput, allowing smaller labs to handle complex matrices. Instrument footprints continue to shrink, enabling multiplexed installations even in space-constrained facilities. These gains directly address the global shortage of trained chromatographers by reducing manual workload.
Stringent Global Food-Safety and PFAS Regulations Upping Testing Volumes
The US EPA’s Method 1633 establishes sub-ng/mL limits for dozens of PFAS compounds, expanding LC-MS/MS demand in environmental and food laboratories.[2]US Environmental Protection Agency, “Draft Method 1633: Analysis of PFAS in Aqueous, Solid, Biosolids, and Tissue Samples,” epa.gov Europe’s REACH program adds similar obligations, and several APAC nations are drafting aligned rules. Vendors have introduced delay columns and dedicated stationary phases that suppress analyte degradation, increasing method sensitivity threefold. The estimated USD 220 billion cost to remediate US contamination alone underscores enduring testing volume, firmly linking regulatory action to sustained revenue for the chromatography instrumentation market.
Expanding Bioprocessing & Continuous Manufacturing in Biopharma
Asia Pacific biomanufacturers are shifting from batch to continuous downstream purification, depending on multi-column chromatography skids that deliver higher yields at lower buffer consumption. Cytiva and Pall plan USD 600 million in new resin capacity, ensuring supply of agarose beads essential for intensified processes. Inline protein-A monitoring shortens release cycles, encouraging broader installation of PAT-ready systems. Integrated software feeds analytics directly to manufacturing execution systems, tightening control loops and reducing deviation rates.
Restraints Impact Analysis*
| Restraint | (~) % Impact on CAGR Forecast | Geographic Relevance | Impact Timeline |
|---|---|---|---|
| High upfront and maintenance cost of advanced LC & MS-coupled systems | -0.80% | Global – most limiting in emerging markets | Long term (≥ 4 years) |
| Shortage of skilled chromatographers & data analysts | -0.60% | Developed markets first, now global | Medium term (2-4 years) |
| Volatility in supply of high-purity resins, columns & semiconductor chips | -0.50% | Worldwide | Short term (≤ 2 years) |
| Emerging green-solvent mandates raising compliance and redesign costs | -0.30% | EU & North America lead | Long term (≥ 4 years) |
| Source: Mordor Intelligence | |||
High Upfront and Maintenance Cost of Advanced LC & MS-Coupled Systems
Next-generation LC-MS instruments often exceed USD 500,000, with service contracts adding another 12% annually, straining budgets in academia and diagnostic labs. Semiconductor tariffs risk pushing component costs higher, potentially delaying upgrades. Certified pre-owned programs from OEMs and resellers offer entry points as low as USD 14,000, yet limited warranty scope can raise lifecycle risk. Total analytical cost per complex bioanalytical sample frequently surpasses USD 100, forcing some facilities to outsource testing rather than invest internally.
Shortage of Skilled Chromatographers & Data Analysts
Retirement of experienced analysts and competition from adjacent industries have left many laboratories understaffed. Multifunctional instruments now integrate guided workflows and remote diagnostics to support novice users. While these tools ease routine tasks, advanced method development still demands expertise. Training programs lag behind market growth, prolonging vacancies and limiting throughput capacity.
*Our forecasts treat driver/restraint impacts as directional, not additive. The impact forecasts reflect baseline growth, mix effects, and variable interactions.
Segment Analysis
By Devices: High-Performance Liquid Systems Sustain Leadership
Liquid chromatography systems captured 56.20% of 2025 revenue, reflecting broad applicability in pharma, environmental, and clinical arenas. The chromatography instrumentation market size for liquid platforms reached USD 5.69 billion in 2025 and is projected to advance at a 4.85% CAGR, buoyed by biocompatible hardware that minimizes metal adsorption of sensitive biomolecules. Supercritical fluid instruments, though smaller in absolute terms, will record the fastest 8.45% CAGR, riding pharmaceutical demand for greener chiral separations. Gas chromatography manufacturers are redesigning systems for hydrogen carriers to mitigate helium reliance, and ion chromatography gains relevance in drinking-water compliance. Consumables, especially columns engineered for PFAS and antibody analysis, drive recurring revenue and buffer suppliers from capital-spending cycles. Localization of agarose resin production in the US and Europe shields users from trans-Pacific logistics risk, improving lead times and pricing stability.
Technological differentiation now centers on embedded analytics. Instruments log every parameter change, creating traceable digital twins that feed laboratory information systems. Vendors integrate column health dashboards that predict failure, thereby protecting data integrity and reducing reruns. Compact autosamplers and solvent-saving gradient pumps align with green-chemistry mandates while preserving chromatographic resolution. These trends ensure sustained leadership for liquid systems, underpinning the overall trajectory of the chromatography instrumentation market.



By Application: Environmental Testing Outpaces Traditional Domains
Pharmaceutical laboratories retained the largest 41.60% revenue slice in 2025, yet mounting PFAS and food-safety rules position environmental testing as the fastest-expanding application at 8.95% CAGR. Routine drug-release testing now requires sub-ppm impurity quantitation, driving multi-detector LC-MS configurations in pharma quality control suites. Clinical diagnostics adopt liquid chromatography-tandem mass spectrometry for vitamin-D, steroid, and toxicology panels, widening the method’s footprint beyond esoteric labs.
Agri-food chains deploy high-throughput GC-MS screens for pesticide residues, while petrochemical operators monitor refinery streams with process GC units capable of real-time composition feedback. Across every segment, machine-learning post-processing reduces manual peak review, allowing labs to redeploy limited staff toward investigation tasks. These cross-industry drivers collectively keep the chromatography instrumentation market on a resilient growth path, even as spending priorities vary by sector.
Geography Analysis
North America maintained 38.30% of global revenue in 2025, anchored by intensive pharmaceutical R&D pipelines and strict FDA oversight that mandate high-end analytical validation. Domestic expansion projects such as Thermo Fisher’s USD 2 billion capacity program improve access to instruments and consumables, supporting replacement cycles and new installations. Federal incentives for semiconductor onshoring also protect instrument component supply, enhancing ecosystem resilience.
Europe follows with a well-established base but faces tighter solvent and waste regulations that drive early adoption of greener technologies. Laboratories pivot toward low-flow UHPLC and hydrogen carrier gas solutions to comply with environmental directives. EU Horizon research funds continue to seed next-generation detection methods, sustaining regional innovation pipelines.
Asia-Pacific represents the principal growth engine, expanding at a 7.45% CAGR to 2031. China and India jointly account for over half of regional demand as contract research organizations, vaccine producers, and generics manufacturers scale operations. Government initiatives to upgrade food-safety testing and curb industrial pollution further stimulate orders. Japanese and South Korean firms remain at the forefront of platform engineering, exporting high-precision components worldwide and reinforcing the global standing of the chromatography instrumentation market.

Regulatory Landscape
US FDA Quality Management System Regulation (QMSR) became effective in February 2026, amending 21 CFR Part 820 to harmonize quality requirements with ISO 13485:2016 and tighten expectations on supplier controls, risk management, and documentation for manufacturers and service organizations supporting chromatography platforms. For data systems and workflows, regulated laboratories using chromatography data systems (CDS) align with 21 CFR Part 11 for electronic records and signatures, with emphasis on audit trails, access controls, and validated software configurations. In Europe, Regulation (EU) 2017/745 (MDR) was updated through January 2026, reinforcing traceability and quality management obligations for device-adjacent laboratory environments, while pharmacopoeial and international guidance supports consistent qualification and method-suitability practices across GMP/GLP operations.
Value Chain Analysis
The chromatography instrumentation value chain covers precision components (pumps, valves, detectors, autosamplers), embedded software, and final system assembly, followed by installation, qualification, and lifecycle service. Upstream supply is concentrated among specialty chemical producers for silica-based column materials, while high-precision fluidic components and advanced detectors (notably MS interfaces) require long build and calibration cycles, which concentrates supply power among established manufacturers and qualified subcontractors. Downstream, OEMs and authorized channels capture value through application support, validation documentation, and field service capacity in regulated environments, where qualification burdens and Part 11-aligned software validation extend beyond the hardware sale. Regional supply-chain patterns also show localization and substitution pressures in procurement behavior, including China, where April 2026 trade reporting showed a 19.7% year-on-year increase in import value for chromatography and mass spectrometry instruments, alongside a decline in imported-brand share in government procurement to 52.3% from 63.1% in April 2025. These shifts can affect distribution partnerships, local assembly choices, and service footprints.
Competitive Landscape
Four multinationals such as Waters, Agilent, Thermo Fisher Scientific, and Shimadzu—collectively hold significant global revenue, underscoring moderate consolidation within the chromatography instrumentation market. Each leverages unique technology stacks: Waters pioneered UPLC; Agilent emphasizes modular LC platforms; Thermo Fisher integrates chromatography with Orbitrap MS; and Shimadzu champions AI-assisted workflows. Competitive tension now centers on software ecosystems that enhance regulatory compliance and remote service.
Mergers and acquisitions accelerate capability expansion. Thermo Fisher’s USD 4.1 billion purchase of Solventum’s purification and filtration unit broadens bioprocess coverage and underpins chromatography resin supply. Smaller niche acquisitions, such as PEAK Scientific’s purchase of Noblegen gas-generation technology, illustrate how specialized capabilities can earn premium market positioning. Patent filings concentrate on porous particle chemistry and chemometrics algorithms, with top inventors often exceeding 100 active US patents.
Pricing pressure persists despite vendor concentration, driven by leaner manufacturing in Asia-Pacific and the rise of certified-pre-owned equipment programs. Suppliers respond by bundling instruments with cloud subscriptions, securing annuity revenue through analytics dashboards and e-commerce consumable ordering. This balanced strategy maintains profitability while keeping barriers to entry high for new challengers, sustaining leadership positions within the chromatography instrumentation market.
Chromatography Instrumentation Industry Leaders
Agilent Technologies
Thermo Fisher Scientific
Merck KGaA
Sartorius AG
Bio-Rad Laboratories
- *Disclaimer: Major Players sorted in no particular order

Market Opportunities and Future Outlook
Compliance-driven validation updates create openings for vendors that pair high-performance hardware with validation-ready software and documentation. The April 2026 USP prospectus for a new General Chapter on supercritical fluid chromatography (SFC) creates opportunities for instrument makers and application teams to package turnkey SFC and UHPLC workflows for regulated pharmaceutical environments, particularly where greener separations and solvent reduction are part of procurement criteria. Biopharma-led applications continue to pull through demand for specialized separation solutions aligned to emerging modalities and high-throughput QC needs, supported by 2026 launches of microflow LC columns and QC-tested reversed-phase platforms targeting GLP-1 characterization and lipid nanoparticle component analysis. On the supply side, Welch Materials inaugurated a chromatography production base in Nanjing in January 2026 with planned annual capacity of 190,000 columns and 30 tons of purification materials, supporting faster lead times and broader access to consumables used for routine method deployment in pharma, environmental, and food-testing laboratories.
Recent Industry Developments
- July 2026: Agilent Technologies expanded its Altura HPLC column portfolio by launching inert size exclusion and PLRP-S columns for biotherapeutic analysis. The additions target analytical robustness for protein and biomolecule workflows that require tighter control of secondary interactions and reproducibility in regulated testing. The additions also support Agilent's consumables pull-through around installed LC systems and method packages used in biopharma analytics.
- June 2026: Thermo Fisher Scientific announced new Orbitrap mass spectrometry platforms and associated AI-enabled software and integrated workflows at ASMS 2026, spanning research, biopharma, and applied testing use cases. By pushing higher-resolution capability and workflow integration, the launch supports broader adoption of advanced MS-coupled chromatography in routine characterization and testing environments. The release also increases competitive pressure on end-to-end ecosystems that bundle instruments, software, and service for throughput and compliance needs.
- October 2025: Merck KGaA announced a definitive agreement to acquire the chromatography business of JSR Life Sciences to expand Protein A capabilities and its downstream chromatography portfolio. The transaction consolidates expertise and capacity in high-value bioprocess chromatography media that supports intensified biologics manufacturing. It also points to continued consolidation around critical purification and separation technologies that influence instrument and consumable selection in biopharma operations.


Research Methodology Framework and Report Scope
Market Definition and Coverage
This market covers revenues from chromatography instruments used to separate, detect, and quantify chemical and biological mixtures in lab and process settings. It includes complete systems and major instrument modules sold for gas, liquid, ion, thin-layer, and supercritical chromatography workflows.
Scope exclusions: We exclude chromatography consumables and lab disposables (such as columns, solvents, vials, and needles) and we also exclude service and maintenance contracts.
Segmentation Overview
- By Devices
- Chromatography Systems
- Gas Chromatography Systems
- Liquid Chromatography Systems
- Supercritical Fluid Chromatography Systems
- Ion Chromatography Systems
- Thin-Layer Chromatography Systems
- Consumables
- Columns
- Solvents / Reagents / Adsorbents
- Syringes / Needles
- Membrane Filters
- Others
- Accessories
- Column Accessories
- Auto-Sampler Accessories
- Pumps
- Detectors
- Other Accessories
- Chromatography Systems
- By Application
- Agriculture & Food Testing
- Pharmaceutical & Biopharmaceutical Companies
- Clinical & Diagnostic Laboratories
- Environmental Testing
- Chemical & Petrochemical
- Forensic & Toxicology
- Geography
- North America
- United States
- Canada
- Mexico
- Europe
- Germany
- United Kingdom
- France
- Italy
- Spain
- Rest of Europe
- Asia Pacific
- China
- Japan
- India
- South Korea
- Australia
- Rest of Asia Pacific
- Middle East and Africa
- GCC
- South Africa
- Rest of Middle East and Africa
- South America
- Brazil
- Argentina
- Rest of South America
- North America
Data Sources, Market Sizing, and Validation
Desk Research
Desk research was used to set the basic market structure and to build external reality checks for sizing. We referenced public sources such as the US FDA, the European Medicines Agency, the US Environmental Protection Agency, the World Health Organization, and OECD datasets to understand testing volumes, regulated methods, and compliance-driven demand signals.
To anchor supply-side context, we also reviewed company annual reports and investor presentations, product catalogs and price lists published on manufacturer websites, association publications (including analytical chemistry and laboratory group materials), and peer-reviewed journals that discuss method adoption and detector trends. In a limited way, paid subscriptions for company financials and news, patent databases, and shipment-level trade data were used to validate activity levels when public data was not granular enough. These are examples only, and many other sources were also reviewed to collect data, confirm assumptions, and clarify gaps.
Primary Interviews and Surveys
Primary work focused on interviews and short surveys with instrument manufacturers, regional distributors, lab managers, and procurement stakeholders across life sciences, environmental testing, food testing, and petrochemical labs. The respondent input helped confirm what is typically purchased as a complete system versus a module, the usual replacement cycle, average selling price ranges by configuration, and how demand shifts with funding, regulation, and sample loads across regions.
Distribution of primary research fieldwork respondents
| Company type | Respondent position | Region |
|---|---|---|
| Top tier: 27% | CXOs: 18% | APAC: 47% |
| Mid tier: 51% | Functional/Unit leaders: 25% | EMEA: 29% |
| Smaller Players: 22% | Managers: 57% | Americas: 24% |
Market-Sizing & Forecasting
Sizing started with a top-down build where regulated testing intensity and lab activity were translated into instrument demand pools by region, then split across chromatography techniques and typical system configurations. The inputs that mattered most were method adoption for LC and GC, installed base replacement cycles, average selling prices by detector and pump setup, lab capex patterns in pharma and biotech, and growth in environmental and food safety testing volumes.
We then corroborated results with selective bottom-up approximations, including sample revenue roll-ups for key product families, distributor channel checks on unit movement, and ASP times volume calculations for a set of common system builds, before totals were adjusted for overlaps and missing coverage. Where direct unit data was not available, gaps were handled using validated proxy indicators such as import trends for analytical instruments, patent activity around detector technologies, and primary feedback on typical order sizes.
For forecasting, we used scenario analysis supported by expert input, so regulatory tightening, biopharma pipeline momentum, and lab funding cycles could be reflected without overfitting. Assumptions on ASP progression and replacement timing were refreshed with primary feedback and then applied consistently across regions to keep the model repeatable.
Data Validation & Update Cycle
Outputs were checked through triangulation across independent signals, then reviewed for unusual jumps by region, technique, and pricing, since these are common failure points in instrument markets. When variances did not match known demand drivers, such as regulation-led testing or lab capex slowdowns, assumptions were revisited and targeted follow-ups were triggered with interviewees.
A multi-step analyst review is used before sign-off so scope alignment, currency treatment, and year mapping stay consistent across the dataset. Reports are refreshed annually, and interim updates are made when material events occur, after which a final pre-delivery pass is completed so clients receive an up-to-date view.
Mordor Intelligence's Global Chromatography Instrumentation Market Market Sizing Compared With Other Published Estimates
Published market sizes for chromatography instrumentation often differ because each publisher draws the line around what counts as instrumentation, uses different base years, and applies different pricing and currency treatments. Differences also come from how installed base replacement and new lab additions are translated into annual equipment demand.
Columns and solvents sit outside Mordor Intelligence's scope, and that single exclusion explains why estimates that bundle consumables and accessories often show a smaller starting-year number but a smoother growth line over longer forecast windows.
Benchmark comparison
| Source | Market Size | Gaps in Research Methodology |
|---|---|---|
| Mordor Intelligence | USD 10.63 B (2026) | |
| Industry Publisher A | USD 7.93 B (2024) | Uses a broader bill of materials that groups instruments with consumables and accessories, and the base year is earlier, which shifts the current-year level and the apparent growth path. |
| Global Publisher B | USD 10.33 B (2024) | Reports an instruments figure but does not clearly state factory-gate pricing or constant-dollar treatment, so timing of currency conversion and ASP assumptions can move the 2024 value versus later-year baselines. |
Across the table, the spread mainly comes from scope and year alignment, then from how prices are normalized across regions. By keeping the model tied to equipment-only revenue and by cross-checking against replacement cycles, configuration-level ASPs, and lab activity signals, the final number stays traceable to inputs a client can sanity-check and repeat.


Key Questions Answered in the Report
What is the current size of the chromatography instrumentation market?
The chromatography instrumentation market stands at USD 10.63 billion in 2026 and is set to reach USD 13.52 billion by 2031.
Which device type captures the highest market share?
Liquid chromatography platforms lead with 56.20% of global revenue thanks to their versatility across pharmaceutical, environmental, and clinical workflows.
Which application area will grow the fastest through 2031?
Environmental testing is projected to expand at a 8.95% CAGR through 2031 due to stringent PFAS and food-safety regulations.
Who are the top players in this market?
Waters, Agilent, Thermo Fisher Scientific, and Shimadzu together control more than 80% of worldwide revenues.
Why is AI important in modern chromatography?
AI-enabled workflows can cut analytical turnaround by up to 40%, enhance data reliability, and ease skilled-labour shortages through predictive maintenance and automated method optimisation.
What regions offer the strongest growth outlook?
Asia-Pacific is forecast to grow at 7.45% CAGR, driven by expanding biomanufacturing capacity, rising healthcare investment, and tighter regulatory compliance standards.
Page last updated on:






