
Market Overview
| Study Period | 2020 - 2031 |
|---|---|
| Market Size (2026) | USD 269.55 Billion |
| Market Size (2031) | USD 446.89 Billion |
| Growth Rate (2026 - 2031) | 10.64 % |
| Fastest Growing Market | Asia Pacific |
| Largest Market | North America |
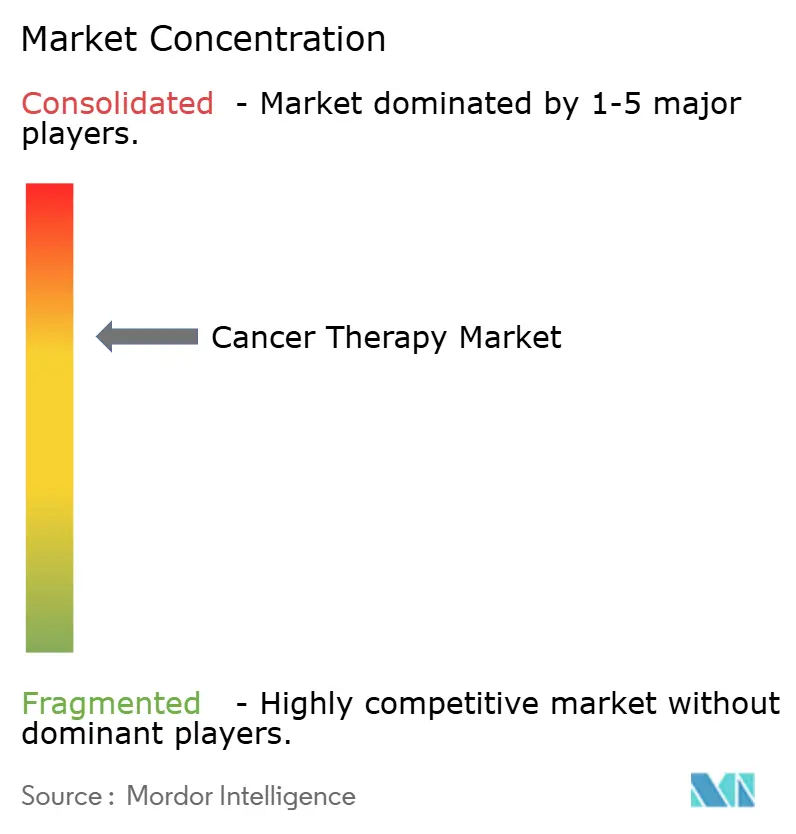
| Market Concentration | Medium |
Major Players *Disclaimer: Major Players sorted in no particular order Image © Mordor Intelligence. Reuse requires attribution under CC BY 4.0. | |
Cancer Therapy Market Analysis by Mordor Intelligence
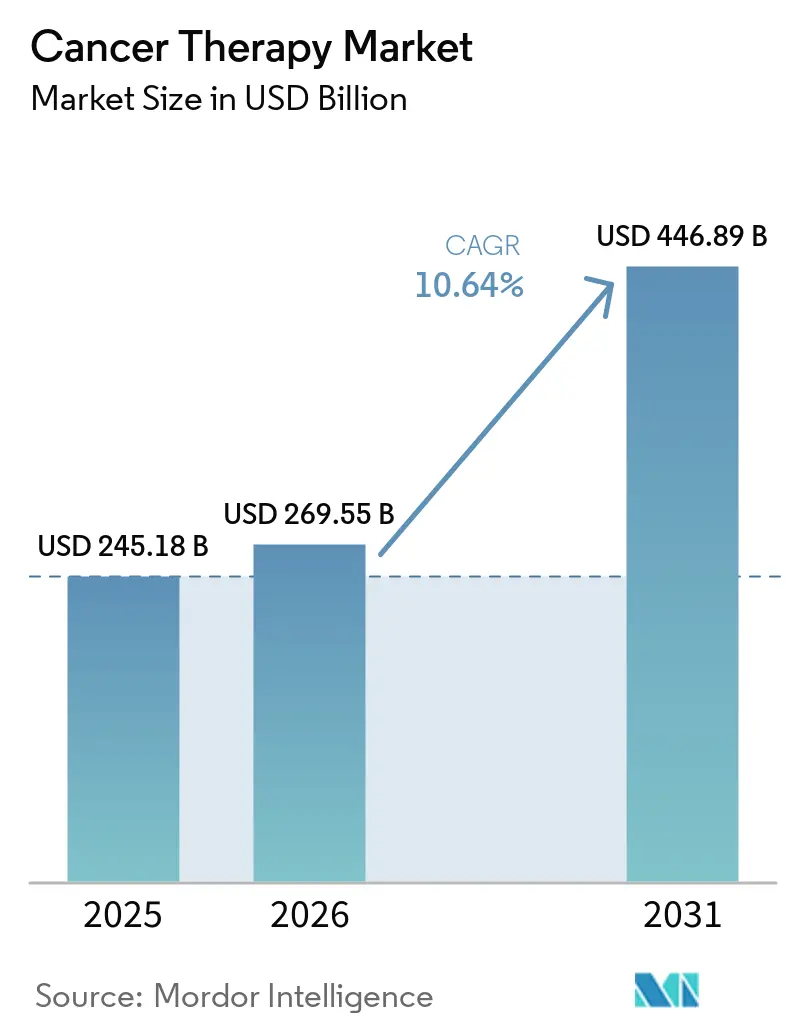
The Cancer Therapy Market size was valued at USD 245.18 billion in 2025 and is estimated to grow from USD 269.55 billion in 2026 to reach USD 446.89 billion by 2031, at a CAGR of 10.64% during the forecast period (2026-2031).
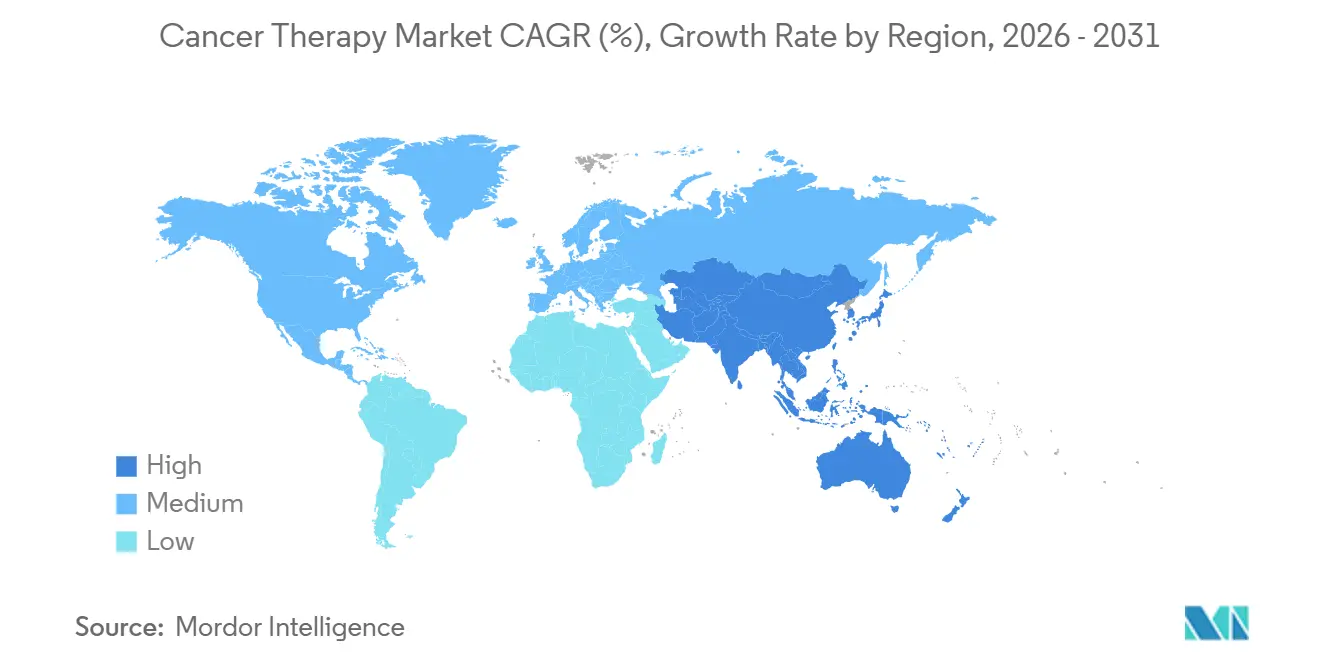
The broader adoption of immune-oncology agents, steady gains in biomarker-guided prescribing, and the expansion of manufacturing capacity for cell and gene therapies are driving demand in both mature and emerging healthcare systems. Large pharmaceutical companies are accelerating portfolio renewal through targeted acquisitions, while specialty biotechs employ artificial intelligence to shorten discovery timelines and secure niche indications. Hospitals remain the dominant spending channel; however, payers are steering patients toward suitable regimens in outpatient and home settings to curb the total cost of care. Regional growth differentials are pronounced as Asia-Pacific countries streamline approval pathways and subsidize locally produced biologics.
Key Report Takeaways
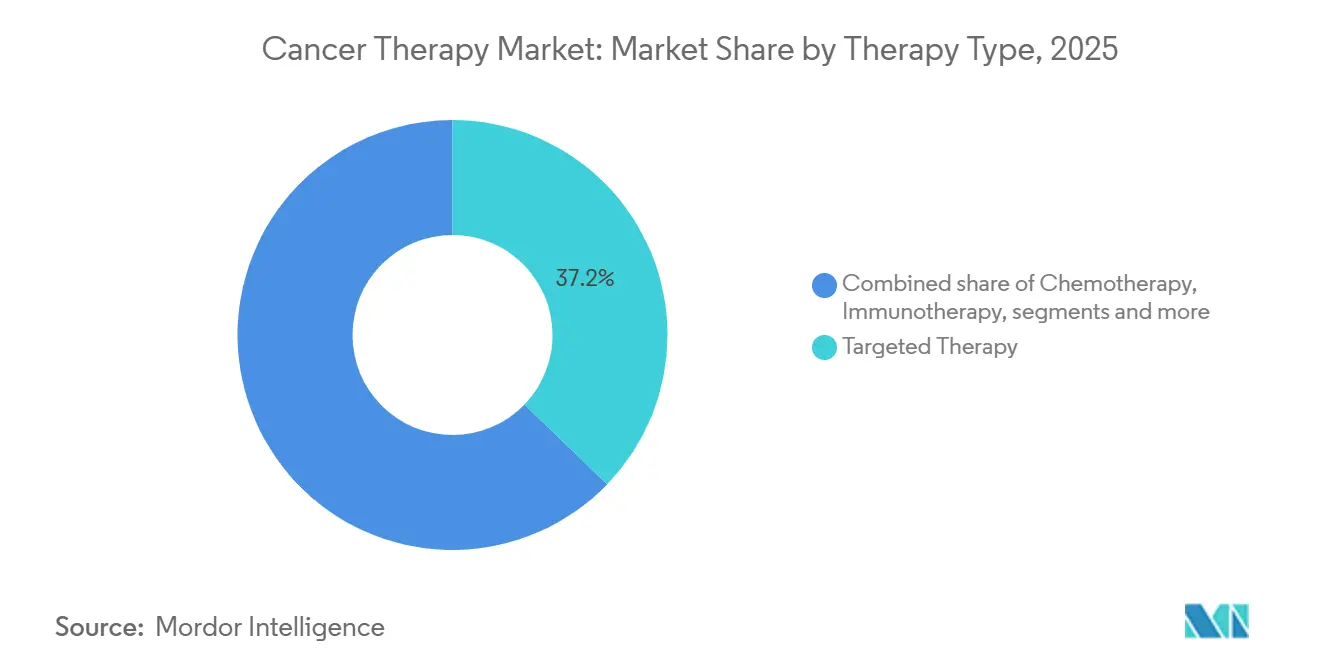
- By therapy type, targeted therapy captured 37.21% revenue share in 2025; cell and gene therapy is forecast to expand at a 12.5% CAGR through 2031.
- By cancer type, breast cancer held 18.23% of 2025 demand, while lung cancer therapeutics are projected to advance at an 11.1% CAGR to 2031.
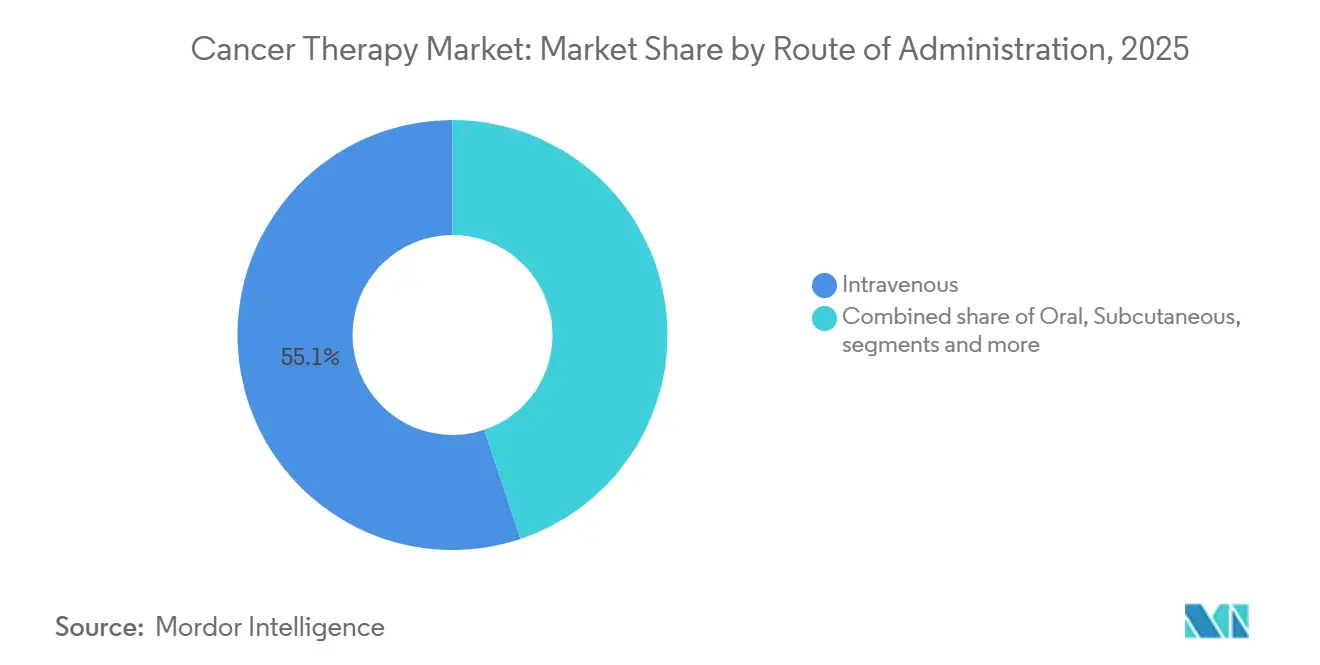
- By route of administration, intravenous drugs accounted for 55.14% of the cancer therapy market share in 2025, whereas intratumoral delivery is set to grow at a 12.73% CAGR through 2031.
- By end user, hospitals accounted for 62.40% of 2025 spending; meanwhile, home-care settings are projected to expand at an 11.72% CAGR through 2031.
- By geography, North America led with 43.23% of the 2025 revenue, while the Asia-Pacific region is advancing at an 11.20% CAGR through 2031.
Note: Market size and forecast figures in this report are generated using Mordor Intelligence’s proprietary estimation framework, updated with the latest available data and insights as of January 2026.
Market Trends and Insights
Drivers Impact Analysis of Cancer Therapy Market*
| Driver | (~) % Impact on CAGR Forecast | Geographic Relevance | Impact Timeline |
|---|---|---|---|
| Rising Global Cancer Incidence & Aging Population | +2.3% | North America, Europe, East Asia | Long term (≥ 4 years) |
| Advances in Immunotherapy and Targeted Therapies | +2.8% | North America and Europe | Medium term (2-4 years) |
| Growing Adoption of Precision Oncology & Biomarker Testing | +1.9% | North America, Western Europe, urban China and India | Medium term (2-4 years) |
| Increasing Healthcare Expenditure & Access in Emerging Markets | +1.7% | Asia-Pacific core, Middle East, Latin America | Long term (≥ 4 years) |
| Accelerating Digital Therapeutics & AI-Driven Discovery | +1.2% | United States, European Union, Israel, Singapore | Short term (≤ 2 years) |
| Expansion of Value-Based Pricing & Outcome Contracts | +0.9% | United States, United Kingdom, Germany, Australia | Medium term (2-4 years) |
| Source: Mordor Intelligence | |||
Rising Global Cancer Incidence & Aging Population
Worldwide, people aged 65 and older account for most new cancer diagnoses, and health agencies now register oncology as a top cause of urban mortality in multiple regions[1]. Longer lifespans coupled with cumulative exposures to tobacco, ultraviolet radiation, and industrial pollutants ensure persistently high therapy volumes across numerous lines of treatment. National cancer centers in East Asia forecast marked growth in incident cases through 2035, prompting investments in regional oncology hubs. Direct care costs already consume a rising share of health budgets, displacing preventive programs and straining insurance solvency. Hospital systems are scaling their infusion capacity and recruiting oncology specialists to accommodate the influx of patients.
Advances in Immunotherapy and Targeted Therapies
Cancer biological therapies such as checkpoint inhibitors, bispecific T-cell engagers, and antibody-drug conjugates have redefined survival benchmarks across tumor types, earning multiple accelerated approvals in the last five years. Bispecific antibodies for multiple myeloma and relapsed lymphoma show durable progression-free survival in heavily pretreated populations. HER2-low breast cancer approvals broaden eligibility to patients previously deemed HER2-negative, reshaping treatment algorithms. KRAS G12C inhibitors, combined with checkpoint blockade, are outperforming chemotherapy in pivotal trials, creating new sequencing challenges for clinicians. The complexity of regimen selection is driving the adoption of clinical decision-support tools that integrate real-world evidence.
Growing Adoption of Precision Oncology and Biomarker Testing
Coverage expansions for broad genomic profiling under Medicare have enabled access to testing for millions of U.S. beneficiaries[3]. Liquid biopsy volumes are rising swiftly as oncologists leverage circulating tumor DNA to guide therapy choice and monitor resistance mutations. China has added multiple companion diagnostics to its reimbursement list, cutting out-of-pocket costs and boosting uptake in secondary and tertiary markets. Tumor-agnostic approvals for NTRK fusions and microsatellite instability have accelerated biomarker testing, yet community practices still cite authorization delays and turnaround times as impediments. Diagnostic firms, therefore, focus on automation to shorten reporting cycles.
Increasing Healthcare Expenditure and Access in Emerging Markets
Governments in India, Brazil, and Saudi Arabia are directing substantial funds to oncology centers, reimbursement schemes, and workforce training. India’s national program now subsidizes several high-cost biologics, lifting utilization in lower-income districts. Brazil is establishing radiotherapy centers to reduce wait times, while Gulf nations are forming alliances with top cancer institutes to operate comprehensive facilities. Local biologic manufacturing across Asia-Pacific is lowering ex-factory prices, stimulating demand without external currency exposure. As a result, market penetration curves in emerging economies are steepening.
Restraints Impact Analysis of Cancer Therapy Market*
| Restraint | (~) % Impact on CAGR Forecast | Geographic Relevance | Impact Timeline |
|---|---|---|---|
| High Treatment Costs And Financial Toxicity | -1.3% | Global | Long term (≥ 4 years) |
| Stringent Regulatory Approval Processes And Clinical Trial Complexity | -0.9% | Global | Medium term (2-4 years) |
| Supply Chain Vulnerabilities In Viral Vector And Raw Material Manufacturing | -0.7% | Global | Short term (≤ 2 years) |
| Growing Immunotherapy Resistance And Tumor Heterogeneity Challenges | -1.1% | Global | Long term (≥ 4 years) |
| Source: Mordor Intelligence | |||
High Treatment Costs and Financial Toxicity
Studies show patients facing elevated out-of-pocket expenses are more likely to discontinue oral targeted therapies prematurely, directly reducing overall survival. U.S. CAR-T infusion courses incur total charges exceeding USD 400,000, even for insured patients, encompassing hospital stays, ancillary care, and lost wages. Major assistance foundations report record application volumes yet must cap enrollments as funding lags demand. Payers respond with step-therapy prerequisites, delaying access to novel regimens and compounding disease burden. Policymakers debate co-payment caps to prevent household asset depletion.
Stringent Regulatory Approval Processes and Clinical Trial Complexity
Despite accelerated pathways, confirmatory trials lag, prompting label restrictions for several oncology agents pending survival verification. European regulators require adaptive designs to mature evidence, but sponsors struggle to meet milestones amid global enrollment hurdles. Phase III protocols now include more exclusion criteria and additional procedure visits than they did five years ago, resulting in a quarter-lengthened recruitment period. Basket trials targeting low-frequency biomarkers face operational difficulties due to the scarcity of eligible patients and competing industry studies. Rising trial overhead lifts development cost and deters smaller sponsors.
*Our forecasts treat driver/restraint impacts as directional, not additive. The impact forecasts reflect baseline growth, mix effects, and variable interactions.
Cancer Therapy Market Segment Analysis
By Therapy Type:
Cell & Gene Therapy Outpaces Legacy ModalitiesCell and gene therapy growth at a 12.50% CAGR through 2031 underscores a structural shift away from cytotoxic drugs. Allogeneic CAR-T platforms offer off-the-shelf convenience, trimming manufacturing timelines from weeks to days. Targeted therapy accounted for 37.21% of 2025 revenue, but upcoming biosimilars are expected to erode price points as exclusivities lapse. Checkpoint inhibitors penetrate adjuvant settings, tripling eligible patient pools. Chemotherapy remains pivotal in hematologic malignancies and as a combination backbone, though first-line use in solid tumors is declining. Hormonal therapy sustains favorable toxicity profiles for receptor-positive cancers, enhanced by CDK4/6 inhibitors that extend progression-free survival past 30 months. Bispecific T-cell engagers demonstrate robust response rates in late-line myeloma, while antibody-drug conjugates with novel payloads enlarge responder subsets. The cancer therapy market size for cell and gene therapy is forecast to narrow the gap with targeted agents by 2031 materially. Biosimilars incentivize manufacturers to adopt innovative payload conjugation strategies, thereby preserving premium pricing despite intensifying competition.
Second-generation gene-edited platforms integrate hypoimmune features to evade host rejection, potentially reducing post-infusion cytokine release. Manufacturing scale-out in Singapore and China expands vector supply, tempering historical bottlenecks. Portfolio rationalization among large caps accelerates licensing deals for mid-stage assets in KRAS-mutant malignancies, often surpassing USD 1 billion upfront. Venture investment in oncology AI start-ups supports computational protein design, generating clinically viable candidates more quickly than traditional methods. As new entrants proliferate, the cancer therapy market witnesses a more democratized innovation landscape that challenges historical monopoly dynamics. Investors, therefore, track comparative durability of responses to gauge eventual adoption curves.

By Cancer Type:
Lung-Cancer Therapies Surge on Mutation-Targeted BreakthroughsBreast cancer retained 18.23% of 2025 revenue as HER2-directed regimens and CDK4/6 inhibitors entrench in earlier-line protocols.
Label expansions for checkpoint inhibitors into neoadjuvant lung settings extend treatment duration, compounding revenue streams. Combination regimens pairing KRAS inhibitors with immunotherapy offer additive benefit, pending final survival analyses. Radioligand therapy trials in earlier prostate cancer lines hint at future label growth. Basket trial successes in NTRK and RET alterations illustrate the potential of tumor-agnostic pathways to unlock cross-histology revenue with limited patient numbers. Market watchers observe whether pancreatic tumor microenvironment modulation strategies translate preclinical promise into survival gains.
By Route of Administration:
Intratumoral Delivery Gains TractionIntravenous therapies accounted for 55.14% of 2025 revenue, reflecting the dominance of monoclonal antibody infusions. However, subcutaneous formulations that cut chair time from hours to minutes show rapid uptake among infusion centers seeking throughput gains. Oral small molecules, especially kinase inhibitors, continue to gain market share due to their convenience value, although adherence monitoring remains critical. Intratumoral delivery is projected to grow at a 12.73% CAGR, driven by oncolytic virus platforms and localized immunomodulators that maximize tumor exposure while sparing systemic tissue. The cancer therapy market size attributable to intratumoral products is projected to nearly double by 2031. Regulatory guidance released in 2025 clarifies expectations for manufacturing and biodistribution, thereby lowering development risk.
Subcutaneous hyaluronidase-enabled co-formulations enable larger volumes, and many originator brands are repositioning intravenous blockbusters as pre-filled syringes. On-body injectors enable chemotherapy supportive drugs to be administered at home, reducing emergency department visits. Oral therapy benefit designs often shift full cost into deductibles early each year, heightening financial toxicity risk. Sensor-enabled adherence packaging now records dosing events to support outcome-based pricing agreements. Together, these trends foster diversification of administration modes, expanding patient choice, and relieving hospital resource constraints across the cancer therapy market.
By End User:
Home-Care Settings Expand Amid Cost PressureHospitals accounted for 62.40% of 2025 oncology spending, as complex CAR-T infusions and surgical resections require intensive resources. Nonetheless, payers cap facility fees, prompting centers to improve efficiency or risk losing their margins. Specialty clinics backed by private equity consolidate community practices and negotiate volume rebates with national insurers. Hypofractionated radiotherapy protocols reduce treatment courses, thereby increasing linear accelerator utilization rates. Homecare settings are growing at an 11.72% CAGR, as portable pumps and remote monitoring devices enable chemotherapy delivery in the comfort of living rooms. Payers report lower total cost of care and reduced inpatient admissions.
Wearable sensors transmit real-time vital signs to command centers, enabling early intervention and reducing the need for emergency visits. Regulatory approvals for five-day infusion pumps simplify logistics and expand eligibility beyond urban clusters. Tele-oncology check-ins replace routine follow-up appointments, alleviating travel burdens. Oncology home infusion programs in ten U.S. states cut average episode costs by double digits within the cancer therapy market. Even stem-cell transplant after-care protocols now integrate remote oximetry and nurse hotlines, validating community-based convalescence models.
Geography Analysis
North America Cancer Therapy Market
North America retained 43.23% share in 2025, supported by the world’s highest per-capita oncology spend and a critical mass of research institutions. U.S. legislation capped annual out-of-pocket drug costs for Medicare beneficiaries, promising improved adherence for millions on oral regimens. Canada’s national alliance negotiated confidential rebates on novel biologics, narrowing reimbursement delays. Digital infrastructure supports the collection of extensive real-world evidence, informing value-based contracts.
Europe Cancer Therapy Market
Europe advances at a high single-digit CAGR through 2031 as outcome-based agreements spread. Germany and the UK tie payment for CAR-T therapies to progression-free survival, shifting risk to manufacturers. The European Medicines Agency pursues rolling reviews to shorten approval cycles for pandemic-delayed dossiers. Biosimilar penetration erodes antibody price points, funding coverage for newer modalities. Central re-evaluation committees periodically reassess comparative therapeutic benefit, modifying prices under health technology assessment frameworks.
APAC Cancer Therapy Market
The Asia-Pacific region grows fastest, at an 11.20% CAGR, because China adds dozens of therapies to the national reimbursement list at negotiated discounts below Western prices.
LATAM and MEA Cancer Therapy Market
Latin America experiences double-digit growth as Brazil embraces biosimilars and Argentina streamlines expedited review pathways. Cross-border clinical trial participation gives patients earlier access while building local site capabilities. Middle Eastern Gulf states invest in integrated cancer campuses staffed by international experts. Africa experiences modest expansion, with donor agencies funding the installation of radiotherapy facilities in urban hubs. Collectively, divergent growth curves underscore the heterogeneous evolution of the cancer therapy market across continents.
Regulatory Landscape
Regulation of cancer therapeutics is shaped by accelerated and conditional approval pathways, with growing post-approval evidence requirements for immuno-oncology combinations, antibody-drug conjugates, and advanced modalities. In the United States, the FDA Oncology Center of Excellence continues to publish oncology approval notifications and related guidance, while 2026 novel drug approvals and ongoing label expansions reinforce a fast-moving indication-management environment. In Europe, EMA scientific work on updating evaluation guidance for anticancer medicinal products and CHMP activity on indication extensions highlight the continued emphasis on robust clinical endpoints, safety monitoring, and clearer expectations for combination regimens. Market access and reimbursement rules increasingly influence launch sequencing; the EU HTA Regulation began applying in January 2025 for oncology medicines containing new active substances, pushing more centralized clinical assessment across member states and raising the importance of comparative evidence packages and real-world data planning. Outside the US and EU, national policy actions also shape adoption; Brazil enacted Law 15.385 on 10 April 2026, setting principles and guidelines for development and sanitary regulation of new cancer technologies under its National Policy for Cancer Prevention and Control.
Value Chain Analysis
The cancer therapy value chain spans discovery and clinical development (including biomarker strategy and companion diagnostics), sourcing of critical inputs (small-molecule intermediates, biologics raw materials, viral vectors, and radioisotopes), manufacturing (in-house and CDMO-led), quality/regulatory release, and distribution into hospitals, specialty clinics, cancer centers, and increasingly home-care settings. Complexity rises for cell and gene therapies and radiopharmaceuticals, where chain-of-identity, cold-chain controls, and site readiness (apheresis capability, pharmacy handling, radiation safety) determine throughput. Advanced therapy commercialization also requires alignment with HTA bodies and payer rules, since approval alone does not secure uptake in high-cost regimens.
Upstream concentration and time-sensitive logistics remain key constraints. Radiotherapeutic supply chains are shaped by isotope half-life, with longer-lived isotopes such as actinium-225 (9.92 days) supporting global shipment, while shorter-lived isotopes such as yttrium-90 (64 hours) favor decentralized production nearer to treatment centers. Modeling work published in April 2026 (SAPIR-Net) highlights vulnerability in older, high-volume oncology agents such as methotrexate under upstream shocks tied to concentrated intermediate chemical sourcing. In parallel, 2026 reporting on logistics practices (for example, NorthStar Medical Technologies optimizing distribution around airport and trucking proximity) and conflict-driven rerouting of cold-chain air corridors underscores why many manufacturers prioritize redundant lanes and more direct-to-hospital distribution models for critical oncology products.
Competitive Landscape
The cancer therapy market exhibits moderate concentration, with the top pharmaceutical companies controlling roughly 38% of the revenue in 2025. However, biosimilar entrants and focused biotechs continue to fragment the market share. Patent cliffs on blockbuster antibodies compel incumbents to acquire or license late-stage assets, with deal values surpassing USD 10 billion in select cases. Bispecific antibodies, antibody-drug conjugates, and allogeneic cell platforms dominate pipeline investment. Technology partnerships marry multi-omic datasets with machine learning to accelerate biomarker-driven trial recruitment.
White-space opportunities in tumor-agnostic therapies lure specialist players, who secure FDA approvals for low-prevalence biomarkers through basket trials with limited patient numbers. Hypoimmune engineering of donor CAR-T cells promises to reduce the incidence of cytokine release syndrome and lower the cost of goods. Patent filings are increasingly covering delivery innovations—such as nanoparticle encapsulation, implantable depots, and microneedle arrays—that extend exclusivity beyond molecular composition claims.
Large-cap companies are restructuring their research portfolios, dropping small molecule programs with marginal differentiation and reallocating budgets to radioligand and cell therapy franchises. Smaller firms exploit regulatory arbitrage, launching products in Asia months ahead of Western approvals and using revenue to finance global expansion. Portfolio cloning through biosimilar development remains attractive, even at discounted price points, due to its volume scalability. Competitive intensity, therefore, rises as capital flows toward differentiated modalities and patient-centric delivery formats.
Cancer Therapy Industry Leaders
-
F. Hoffmann-La Roche AG
-
Bristol Myers Squibb
-
Johnson & Johnson (Janssen)
-
Merck & Co., Inc.
-
AstraZeneca PLC
- *Disclaimer: Major Players sorted in no particular order
Cancer Therapy Market Companies Covered in this Report
- Abbvie
- Amgen
- Astellas Pharma
- AstraZeneca
- BeiGene Ltd.
- Bristol-Myers Squibb
- Eli Lilly and Company
- Exelixis, Inc.
- Roche
- Gilead Sciences
- GlaxoSmithKline
- Johnson & Johnson Services Inc. (Janssen)
- Merck
- Novartis
- Pfizer
- Regeneron Pharmaceuticals
- Seagen
- Takeda Pharmaceuticals
Market Opportunities and Future Outlook
Radioligand therapies and ADCs require dedicated, safety-qualified infrastructure and reliable supplies of isotopes or highly potent payload-linkers, opening opportunities for CDMOs, isotope producers, and health systems that can qualify as administering sites. Evidence of this shift includes Novartis commencing construction in May 2026 on a 46,000-square-foot radioligand therapy manufacturing site in Denton, Texas, alongside its January 2026 announcement of a radioligand therapy facility in Winter Park, Florida, and Lonza announcing in July 2026 an expansion of HPAPI and ADC payload-linker manufacturing capacity at Visp, Switzerland.
Opportunity also expands in precision oncology ecosystems that connect therapies with testing and evidence generation, especially as regulators and HTA bodies tighten expectations on confirmatory evidence for expedited pathways. FDA actions in 2026 that included withdrawal of an accelerated-approval indication (Xpovio for DLBCL) reinforce the commercial value of sponsors that can operationalize confirmatory trials quickly and generate real-world evidence that supports access decisions. At the delivery end, payer pressure to shift appropriate regimens toward outpatient and home settings increases demand for subcutaneous reformulations, adherence and remote monitoring tools, and pathway-driven care coordination that reduces total cost while maintaining safety and outcomes.
Recent Industry Developments in Cancer Therapy Market
- July 2026: Merck announced the US FDA approved KEYTRUDA and KEYTRUDA QLEX, each in combination with Padcev, as treatment before and after surgery for adults with muscle-invasive bladder cancer. The perioperative label broadens the addressable treatment window beyond metastatic settings and reinforces the industry shift toward combination regimens across earlier lines of care.
- May 2026: Novartis commenced construction on a 46,000-square-foot radioligand therapy manufacturing site in Denton, Texas, strengthening near-term capacity for radioligand production alongside its January 2026 announcement of a radioligand therapy facility in Winter Park, Florida.
- June 2024: The European Medicines Agency advanced work to update its guideline framework for evaluating anticancer medicinal products through a revision concept that addresses evolving trial designs and evidence expectations. Clearer evaluation standards influence development planning for biomarker-defined and combination therapies, particularly when confirmatory evidence and comparators drive downstream HTA decisions.
Cancer Therapy Market Report Scope and Research Methodology
Market Definition and Coverage
This market covers the revenue generated from drug therapies used to treat cancer, including branded and generic medicines delivered through common care settings. It includes systemic and targeted treatments that are prescribed to slow, stop, or reverse malignant cell growth.
Scope exclusions: Diagnostics and screening tools, surgical instruments, and supportive care consumables are excluded from this sizing.
Segments Covered in This Report
- By Therapy Type
- Chemotherapy
- Targeted Therapy
- Immunotherapy
- Hormonal Therapy
- Other Treatment Types
- By Cancer Type
- Blood Cancer
- Breast Cancer
- Prostate Cancer
- Gastrointestinal Cancer
- Gynecologic Cancer
- Respiratory/Lung Cancer
- Other Cancer Types
- By Route of Administration
- Intravenous
- Oral
- Subcutaneous
- Intratumoral
- By End User
- Hospitals
- Specialty Clinics
- Cancer And Radiation Therapy Centers
- Homecare Settings
- Geography
- North America
- United States
- Canada
- Mexico
- Europe
- Germany
- United Kingdom
- France
- Italy
- Spain
- Rest Of Europe
- Asia-Pacific
- China
- Japan
- India
- South Korea
- Australia
- Rest Of Asia-Pacific
- Middle-East And Africa
- GCC
- South Africa
- Rest Of Middle East And Africa
- South America
- Brazil
- Argentina
- Rest Of South America
- North America
Data Sources, Market Sizing, and Validation
Desk Research
Desk research is used to build a fact base on cancer burden, treatment use, and medicine spending patterns before those assumptions are built into the model. In practice, we rely on public sources such as the World Health Organization and International Agency for Research on Cancer (GLOBOCAN), the US FDA and EMA public drug databases, and national health statistics releases such as CDC and NIH cancer statistics.
To link disease burden to market value, we add treatment context from peer reviewed oncology journals, clinical guideline bodies, and government reimbursement schedules where available. Company filings and investor presentations are also reviewed to understand oncology portfolio performance by therapy class. A paid subscription database is used in a limited way for company financials, major deal announcements, and patent searches to help confirm launch timing and therapy class momentum. This desk research list is illustrative only, and other public sources are reviewed for data collection, validation, and clarification.
Primary Interviews and Surveys
Primary work is used to pressure test the demand pool and the price logic that desk sources cannot fully explain, especially across therapy classes and geographies. We speak with manufacturers, distributors, oncology clinicians, and payer or reimbursement focused experts, along with hospital pharmacy stakeholders. Input is collected across APAC, EMEA, and the Americas to confirm assumptions on uptake, access, and treatment duration in a practical way.
Distribution of primary research fieldwork respondents
| Company type | Respondent position | Region |
|---|---|---|
| Top tier: 28% | CXOs: 17% | APAC: 52% |
| Mid tier: 55% | Functional/Unit leaders: 40% | EMEA: 29% |
| Smaller Players: 17% | Managers: 43% | Americas: 19% |
Market-Sizing & Forecasting
Sizing starts with a top-down build where incidence and prevalence by major tumor groups are converted into a treated patient pool, then filtered by diagnosis rates, therapy eligibility, and access to care across regions. Those patients are translated into therapy volumes using typical lines of therapy, average treatment duration, and the route of administration mix. Value is then created using class level average selling price ranges, adjusted for the branded versus generic share.
To keep the output realistic, selective bottom-up checks are run using supplier revenue anchors, public portfolio disclosures, and channel discussions on utilization and formulary dynamics. This supports adjustments where early modeling overstates uptake. Forecasting uses scenario analysis supported by near term indicators such as trial pipeline maturity, expected approval timelines, biosimilar entry timing, and guideline adoption. The base case is finalized after expert inputs converge. Where country level inputs are thin, gaps are handled by using proxy markets with similar access and epidemiology patterns, followed by a consistency check against regional spending signals.
Data Validation & Update Cycle
Validation is done through multiple passes where the outputs are compared against independent signals such as oncology medicine spending trends, known class level adoption patterns, and large country reimbursement changes. If a variance looks unusual, we recheck the drivers and revisit the relevant assumptions before sign off, including a re contact step when primary feedback is inconsistent.
The report is refreshed annually, and interim updates are triggered when material events occur, such as major regulatory approvals, safety warnings, or large pricing changes that can shift class level revenue. Before delivery, an analyst performs a fresh pass on key inputs so clients receive an updated view aligned with the latest public information.
Mordor Intelligence's Cancer Therapy Market Sizing Compared With Other Published Estimates
Published market numbers for cancer therapy can vary a lot because the market is easy to define in different ways, and each definition changes what revenue gets counted. Differences usually come from what therapy classes are included, whether prices are treated as list or net, and how fast uptake is assumed in newer modalities.
Supportive care medicines and consumables sit outside Mordor Intelligence's scope, which is one reason its value will not match figures that combine therapy revenue with broader oncology care spending. Other gaps often come from using list price spending without country mix adjustments, assuming uniform access across regions, or extending a short historic trend without checking patient eligibility, line of therapy duration, and biosimilar impact on pricing.
Benchmark comparison
| Source | Market Size | Gaps in Research Methodology |
|---|---|---|
| Mordor Intelligence | USD 269.55 B (2026) | |
| Industry Institute A | USD 252.00 B (2024) | Tracks cancer medicine spending at list prices, which can overstate realized revenues and does not reconcile therapy class mix with treated patient eligibility by region. |
| Global Consultancy B | USD 193.70 B (2024) | Uses a narrower therapeutics framing and a different starting year, and the public summary does not clearly state how newer modalities and pricing erosion from generics or biosimilars are handled. |
The spread across sources is mainly explained by scope and pricing treatment, followed by how uptake and access are modeled across regions. By keeping inputs tied to treated patients, therapy duration, and realistic price progression, our estimate stays traceable to clear steps that can be reviewed and repeated.
Key Questions Answered in the Report
How big is the cancer therapy industry?
The cancer therapy market size was USD 269.55 billion in 2026 and is forecast to reach USD 446.89 billion by 2031, growing at a 10.64% CAGR.
Which therapy type is expanding the quickest?
Cell and gene therapy is projected to grow at a 12.5% CAGR through 2031 as manufacturing scale and allogeneic platforms lower costs.
Which geographic region is advancing fastest?
Asia-Pacific leads growth with an 11.20% CAGR, driven by China's reimbursement expansions and India's biosimilar approvals.
What share do hospitals hold in delivery of oncology care?
Hospitals accounted for 62.40% of spending in 2025, though home-care channels are rising at 11.72% CAGR as payers push for lower-cost settings.
How significant are biosimilars to future pricing?
Biosimilars captured 29% of Avastin's U.S. volume within 18 months, and similar erosion across monoclonal antibody franchises is expected to intensify price competition.
Which companies dominate current sales?
Roche, Bristol Myers Squibb, Merck, AstraZeneca, and Novartis together held 38% of global revenue in 2025, reflecting moderate market concentration.