饲料粘合剂市场规模

|
|
研究期 | 2017 - 2029 |
|
|
市场规模 (2024) | USD 46.7亿美元 |
|
|
市场规模 (2029) | USD 58.4亿美元 |
|
|
市场集中度 | 低的 |
|
|
次添加剂所占份额最大 | 合成粘合剂 |
|
|
CAGR(2024 - 2029) | 4.57 % |
主要玩家 |
||
|
|
||
|
*免责声明:主要玩家排序不分先后 |
饲料粘合剂市场分析
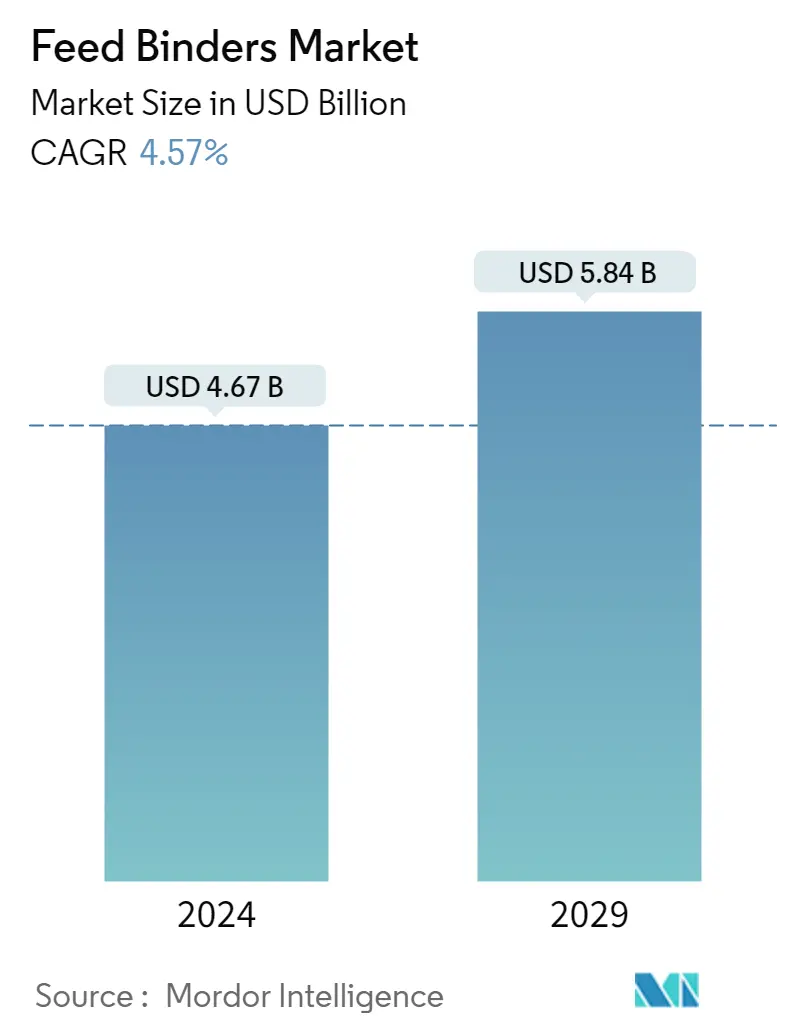
饲料粘合剂市场规模预计到 2024 年为 46.7 亿美元,预计到 2029 年将达到 58.4 亿美元,在预测期内(2024-2029 年)复合年增长率为 4.57%。
- 2022年,全球饲料添加剂市场中粘合剂占据13%的重要份额。配合饲料中使用粘合剂可提高饲料添加剂的功效。粘合剂是第二大饲料添加剂类型,广泛用于几乎所有饲料混合物中,这使其成为商业动物养殖者的基本要求。
- 在饲料粘合剂类型中,合成粘合剂在全球拥有最大的市场份额,预计到 2022 年将达到 26 亿美元。合成粘合剂是首选,因为它们有助于饲料制粒,改善动物的消化和营养摄入,从而预防疾病。
- 然而,由于天然粘合剂价格较低且能够生产优质颗粒,预计在预测期内将实现更高的增长率,即 4.8%。
- 2022年,亚太地区是全球饲料粘合剂市场最大的地区,市场份额为30.6%。该地区的高份额是由于其较高的饲料产量,这与生产的商业饲料成正比,估计 2022 年将达到近 50 万吨。
- 美国和加拿大等饲料产量和添加剂使用量较高的国家对粘合剂的需求较高。因此,北美饲料粘合剂市场预计将增长更快,预测期内复合年增长率为 4.9%。
- 在商业动物生产增加以及使用添加剂改善动物健康和生产力的推动下,饲料粘合剂市场预计将出现显着增长。预计该市场在预测期内的复合年增长率为 4.6%。

- 由于饲料粘合剂在商业动物养殖中发挥的关键作用,全球饲料粘合剂市场一直在高速增长。粘合剂用于将饲料添加剂与配合饲料粘合并提高其效率,到2022年将占全球饲料添加剂市场的13%,使其成为第二大饲料添加剂类型。粘合剂是每个商业动物养殖者的重要组成部分,因为它们几乎用于每种饲料混合物中。
- 亚太地区在全球饲料粘合剂市场中占据主导地位,由于其较高的渗透率和约 5 亿吨饲料的产量,2022 年市场价值将达到 13 亿美元。美国凭借高度发达的畜牧业生产流程,成为全球饲料粘合剂市场最大的国家,占据19.5%的市场份额,规模达到8亿美元。中国和巴西紧随其后,分别占据 13.8% 和 7.1% 的市场份额。
- 预计泰国将成为饲料粘合剂市场增长最快的国家,预测期内复合年增长率为 5.6%。这种增长得益于技术和遗传进步带来的畜牧业生产的可持续增长。 2022年,家禽市场主导饲料粘合剂市场,占44.5%,其次是生猪,市场份额为35.4%。
- 据估计,粘合剂使用的成本效益比可以为畜牧业节省资金,从而促进市场的增长。在商业动物养殖需求不断增长的推动下,全球饲料粘合剂市场预计在预测期内复合年增长率为 4.6%。预计未来几年饲料粘合剂市场将保持强劲,为市场参与者带来巨大的增长机会。
全球饲料粘合剂市场趋势
- 牛肉消费量的增加、食品和饮料行业的发展以及农场数量的增加正在推动全球反刍动物的生产
- 由于猪肉消费量高,生猪数量不断增加,亚太地区和欧洲是猪肉的重要生产国
- 由于对禽肉的高需求以及印度和沙特阿拉伯等新兴国家投资的增加,家禽饲料产量正在增加
- 亚太和北美地区对反刍动物饲料的需求量很大,美国 80% 的牛肉产量都用于出口,印度也出现了新的牛奶供应商
- 亚太地区是最大的猪饲料生产国,人均猪肉消费量很高,非洲猪瘟(ASF)影响了欧洲和非洲的养猪业
饲料粘合剂行业概况
饲料粘合剂市场较为分散,前五名企业占据16.71%。该市场的主要参与者包括安迪苏 (Adisseo)、奥特奇 (Alltech, Inc.)、Arvesta (Palital Feed Additives BV)、Borregaard AS 和嘉吉 (Cargill Inc.)(按字母顺序排列)。
饲料粘合剂市场领导者
Adisseo
Alltech, Inc.
Arvesta (Palital Feed Additives B.V)
Borregaard AS
Cargill Inc.

Other important companies include ALLWYN CHEM INDUSTRIES, Amlan International, Bentoli, Kemin Industries, Uniscope Inc..
*免责声明:主要玩家排序不分先后
饲料粘合剂市场新闻
- 2022 年 7 月:嘉吉扩大了与 Innovafeed 的合作关系,为水产养殖者提供创新和营养成分,包括添加剂。
- 2022 年 5 月:建明工业在墨西哥开设了新的办事处和分销中心,通过提供最优质的服务和定制解决方案为建明动物营养提供服务。
- 2022 年 4 月:嘉吉投资 5000 万美元扩建美国全球动物营养中心,以开发新的乳制品创新部门和研发 (RD) 中心。
饲料粘合剂市场报告 - 目录
执行摘要和主要发现
报告优惠
1. 介绍
1.1. 研究假设和市场定义
1.2. 研究范围
1.3. 研究方法论
2. 主要行业趋势
2.1. 动物总数
2.1.1. 家禽
2.1.2. 反刍动物
2.1.3. 猪
2.2. 饲料生产
2.2.1. 水产养殖
2.2.2. 家禽
2.2.3. 反刍动物
2.2.4. 猪
2.3. 监管框架
2.3.1. 澳大利亚
2.3.2. 巴西
2.3.3. 加拿大
2.3.4. 中国
2.3.5. 法国
2.3.6. 德国
2.3.7. 印度
2.3.8. 意大利
2.3.9. 日本
2.3.10. 墨西哥
2.3.11. 荷兰
2.3.12. 菲律宾
2.3.13. 俄罗斯
2.3.14. 南非
2.3.15. 西班牙
2.3.16. 泰国
2.3.17. 火鸡
2.3.18. 英国
2.3.19. 美国
2.3.20. 越南
2.4. 价值链和分销渠道分析
3. 市场细分(包括以美元计的市场规模和数量、截至 2029 年的预测以及增长前景分析)
3.1. 副添加剂
3.1.1. 天然粘合剂
3.1.2. 合成粘合剂
3.2. 动物
3.2.1. 水产养殖
3.2.1.1. 通过亚动物
3.2.1.1.1. 鱼
3.2.1.1.2. 虾
3.2.1.1.3. 其他水产养殖品种
3.2.2. 家禽
3.2.2.1. 通过亚动物
3.2.2.1.1. 肉鸡
3.2.2.1.2. 层
3.2.2.1.3. 其他家禽
3.2.3. 反刍动物
3.2.3.1. 通过亚动物
3.2.3.1.1. 肉用牛
3.2.3.1.2. 乳牛
3.2.3.1.3. 其他反刍动物
3.2.4. 猪
3.2.5. 其他动物
3.3. 地区
3.3.1. 非洲
3.3.1.1. 按国家/地区
3.3.1.1.1. 埃及
3.3.1.1.2. 肯尼亚
3.3.1.1.3. 南非
3.3.1.1.4. 非洲其他地区
3.3.2. 亚太
3.3.2.1. 按国家/地区
3.3.2.1.1. 澳大利亚
3.3.2.1.2. 中国
3.3.2.1.3. 印度
3.3.2.1.4. 印度尼西亚
3.3.2.1.5. 日本
3.3.2.1.6. 菲律宾
3.3.2.1.7. 韩国
3.3.2.1.8. 泰国
3.3.2.1.9. 越南
3.3.2.1.10. 亚太其他地区
3.3.3. 欧洲
3.3.3.1. 按国家/地区
3.3.3.1.1. 法国
3.3.3.1.2. 德国
3.3.3.1.3. 意大利
3.3.3.1.4. 荷兰
3.3.3.1.5. 俄罗斯
3.3.3.1.6. 西班牙
3.3.3.1.7. 火鸡
3.3.3.1.8. 英国
3.3.3.1.9. 欧洲其他地区
3.3.4. 中东
3.3.4.1. 按国家/地区
3.3.4.1.1. 伊朗
3.3.4.1.2. 沙特阿拉伯
3.3.4.1.3. 中东其他地区
3.3.5. 北美
3.3.5.1. 按国家/地区
3.3.5.1.1. 加拿大
3.3.5.1.2. 墨西哥
3.3.5.1.3. 美国
3.3.5.1.4. 北美其他地区
3.3.6. 南美洲
3.3.6.1. 按国家/地区
3.3.6.1.1. 阿根廷
3.3.6.1.2. 巴西
3.3.6.1.3. 智利
3.3.6.1.4. 南美洲其他地区
4. 竞争格局
4.1. 关键战略举措
4.2. 市场份额分析
4.3. 公司概况
4.4. 公司简介(包括全球概况、市场概况、核心业务部门、财务状况、员工人数、关键信息、市场排名、市场份额、产品和服务以及近期发展分析)。
4.4.1. Adisseo
4.4.2. Alltech, Inc.
4.4.3. ALLWYN CHEM INDUSTRIES
4.4.4. Amlan International
4.4.5. Arvesta (Palital Feed Additives B.V)
4.4.6. Bentoli
4.4.7. Borregaard AS
4.4.8. Cargill Inc.
4.4.9. Kemin Industries
4.4.10. Uniscope Inc.
5. 饲料添加剂首席执行官面临的关键战略问题
6. 附录
6.1. 全球概况
6.1.1. 概述
6.1.2. 波特的五力框架
6.1.3. 全球价值链分析
6.1.4. 全球市场规模和 DRO
6.2. 来源和参考文献
6.3. 表格和图表清单
6.4. 主要见解
6.5. 数据包
6.6. 专业术语
表格和图表列表
- 图 1:
- 全球家禽数量,数量,2017-2022 年
- 图 2:
- 全球反刍动物数量,数量,2017-2022 年
- 图 3:
- 全球猪存栏量,数量,2017-2022 年
- 图 4:
- 2017-2022 年全球水产养殖饲料产量(公吨)
- 图 5:
- 2017-2022 年全球家禽饲料产量(公吨)
- 图 6:
- 2017-2022 年全球反刍动物饲料产量(公吨)
- 图 7:
- 2017-2022 年全球猪饲料产量(公吨)
- 图 8:
- 全球饲料粘合剂产量(公吨),2017 - 2029 年
- 图 9:
- 全球饲料粘合剂价值(美元),2017 - 2029 年
- 图 10:
- 按添加剂类别划分的饲料粘合剂产量,公吨,全球,2017 - 2029 年
- 图 11:
- 2017 - 2029 年全球饲料粘合剂价值(按添加剂类别)(美元)
- 图 12:
- 2017、2023 和 2029 年全球饲料粘合剂产量份额(按添加剂类别划分,%)
- 图 13:
- 2017、2023 和 2029 年全球饲料粘合剂按添加剂类别的价值份额(%)
- 图 14:
- 全球天然粘合剂饲料粘合剂产量(公吨),2017 - 2029 年
- 图 15:
- 全球天然粘合剂饲料粘合剂价值(美元),2017 - 2029 年
- 图 16:
- 2022 年和 2029 年全球天然粘合剂饲料粘合剂的价值份额(按动物类型划分,%)
- 图 17:
- 全球合成粘合剂饲料粘合剂产量(公吨),2017 - 2029 年
- 图 18:
- 2017 - 2029 年全球合成粘合剂饲料粘合剂价值(美元)
- 图 19:
- 2022 年和 2029 年全球合成粘合剂饲料粘合剂按动物类型的价值份额(%)
- 图 20:
- 2017 - 2029 年全球按动物类型划分的饲料粘合剂用量(公吨)
- 图 21:
- 2017 - 2029 年全球饲料粘合剂价值(按动物类型)(美元)
- 图 22:
- 2017、2023 和 2029 年全球饲料粘合剂数量份额(按动物类型),%
- 图 23:
- 2017、2023 和 2029 年全球饲料粘合剂按动物类型的价值份额(%)
- 图 24:
- 2017 - 2029 年全球按亚动物类型划分的水产养殖饲料粘合剂用量(公吨)
- 图 25:
- 2017 - 2029 年全球水产养殖饲料粘合剂价值(按亚动物类型)(美元)
- 图 26:
- 2017、2023 和 2029 年全球水产养殖饲料粘合剂的销量份额,按亚动物类型划分,%
- 图 27:
- 2017、2023 和 2029 年全球水产养殖饲料粘合剂按亚动物类型划分的价值份额,%
- 图 28:
- 全球鱼饲料粘合剂产量(公吨),2017 - 2029 年
- 图 29:
- 2017 - 2029 年全球鱼饲料粘合剂的价值(美元)
- 图 30:
- 2022 年和 2029 年全球鱼饲料粘合剂按添加剂类别的价值份额(%)
- 图 31:
- 全球虾饲料粘合剂产量(公吨),2017 - 2029 年
- 图 32:
- 全球虾饲料粘合剂价值(美元),2017 - 2029
- 图 33:
- 2022 年和 2029 年全球虾饲料粘合剂按添加剂类别的价值份额(%)
- 图 34:
- 全球其他水产养殖物种饲料粘合剂的产量(公吨),2017 - 2029 年
- 图 35:
- 全球其他水产养殖物种饲料粘合剂的价值(美元),2017 - 2029
- 图 36:
- 2022 年和 2029 年全球其他水产养殖品种饲料粘合剂的价值份额(按添加剂子类别划分),%
- 图 37:
- 2017 - 2029 年全球按亚动物类型划分的家禽饲料粘合剂用量(公吨)
- 图 38:
- 2017 - 2029 年全球家禽饲料粘合剂价值(按亚动物类型)(美元)
- 图 39:
- 2017、2023 和 2029 年全球按亚动物类型划分的家禽饲料粘合剂的销量份额(%)
- 图 40:
- 2017、2023 和 2029 年全球按亚动物类型划分的家禽饲料粘合剂的价值份额,%
- 图 41:
- 全球肉鸡饲料粘合剂产量(公吨),2017 - 2029 年
- 图 42:
- 2017 - 2029 年全球肉鸡饲料粘合剂的价值(美元)
- 图 43:
- 2022 年和 2029 年全球肉鸡饲料粘合剂按添加剂类别的价值份额(%)
- 图 44:
- 全球蛋鸡饲料粘合剂产量(公吨),2017 - 2029 年
- 图 45:
- 全球蛋鸡饲料粘合剂价值(美元),2017 - 2029
- 图 46:
- 2022 年和 2029 年全球蛋鸡饲料粘合剂按添加剂类别划分的价值份额(%)
- 图 47:
- 全球其他家禽饲料粘合剂产量(公吨),2017 - 2029 年
- 图 48:
- 2017 - 2029 年全球其他家禽饲料粘合剂的价值(美元)
- 图 49:
- 2022 年和 2029 年全球其他家禽饲料粘合剂按添加剂子类别划分的价值份额(%)
- 图 50:
- 2017 - 2029 年全球反刍动物饲料粘合剂数量(按亚动物类型划分,公吨)
- 图 51:
- 2017 - 2029 年全球反刍动物饲料粘合剂价值(按亚动物类型)(美元)
- 图 52:
- 2017、2023 和 2029 年全球反刍动物饲料粘合剂的产量份额(按亚动物类型划分),%
- 图 53:
- 2017、2023 和 2029 年全球反刍动物饲料粘合剂的价值份额,按亚动物类型划分,%
- 图 54:
- 全球肉牛饲料粘合剂产量(公吨),2017 - 2029 年
- 图 55:
- 2017 - 2029 年全球肉牛饲料粘合剂价值(美元)
- 图 56:
- 2022 年和 2029 年全球肉牛饲料粘合剂按添加剂类别的价值份额(%)
- 图 57:
- 全球奶牛饲料粘合剂产量(公吨),2017 - 2029 年
- 图 58:
- 2017 - 2029 年全球奶牛饲料粘合剂价值(美元)
- 图 59:
- 2022 年和 2029 年全球奶牛饲料粘合剂按添加剂类别的价值份额(%)
- 图 60:
- 全球其他反刍动物饲料粘合剂的产量(公吨),2017 - 2029 年
- 图 61:
- 全球其他反刍动物饲料粘合剂的价值(美元),2017 - 2029 年
- 图 62:
- 2022 年和 2029 年全球其他反刍动物饲料粘合剂按添加剂子类别划分的价值份额(%)
- 图 63:
- 全球猪饲料粘合剂产量(公吨),2017 - 2029 年
- 图 64:
- 全球猪饲料粘合剂的价值(美元),2017 - 2029
- 图 65:
- 2022 年和 2029 年全球猪饲料粘合剂按添加剂类别的价值份额(%)
- 图 66:
- 全球其他动物饲料粘合剂的销量(公吨),2017 - 2029 年
- 图 67:
- 全球其他动物饲料粘合剂的价值(美元),2017 - 2029
- 图 68:
- 2022 年和 2029 年全球其他动物饲料粘合剂按添加剂类别的价值份额(%)
- 图 69:
- 2017 - 2029 年全球饲料粘合剂产量(按地区划分,公吨)
- 图 70:
- 2017 - 2029 年全球饲料粘合剂价值(按地区计算)(美元)
- 图 71:
- 2017、2023 和 2029 年全球饲料粘合剂产量份额(按地区划分)
- 图 72:
- 2017、2023 和 2029 年全球饲料粘合剂按地区划分的价值份额(%)
- 图 73:
- 2017 - 2029 年非洲各国饲料粘合剂产量(公吨)
- 图 74:
- 2017 - 2029 年按国家/地区划分的饲料粘合剂价值(美元)、非洲
- 图 75:
- 2017、2023 和 2029 年非洲饲料粘合剂数量份额(按国家/地区划分)
- 图 76:
- 2017、2023 和 2029 年非洲饲料粘合剂的价值份额(按国家/地区划分)
- 图 77:
- 埃及饲料粘合剂产量(公吨),非洲,2017 - 2029 年
- 图 78:
- 埃及饲料粘合剂的价值(美元),非洲,2017 - 2029 年
- 图 79:
- 2022 年和 2029 年非洲埃及饲料粘合剂按添加剂类别的价值份额(%)
- 图 80:
- 非洲肯尼亚饲料粘合剂产量(公吨),2017 - 2029 年
- 图 81:
- 非洲肯尼亚饲料粘合剂价值(美元),2017 - 2029 年
- 图 82:
- 2022 年和 2029 年非洲按添加剂类别划分的肯尼亚饲料粘合剂的价值份额(%)
- 图 83:
- 南非饲料粘合剂产量(公吨),非洲,2017 - 2029 年
- 图 84:
- 南非饲料粘合剂的价值(美元),非洲,2017 - 2029 年
- 图 85:
- 2022 年和 2029 年非洲按添加剂类别划分的饲料粘合剂的价值份额(%)
- 图 86:
- 非洲其他地区饲料粘合剂产量(公吨),2017 - 2029 年
- 图 87:
- 非洲其他地区饲料粘合剂的价值(美元),非洲,2017 - 2029 年
- 图 88:
- 非洲其他地区饲料粘合剂按添加剂子类别划分的价值份额,%,非洲,2022 年和 2029 年
- 图 89:
- 2017 - 2029 年亚太地区各国饲料粘合剂产量(公吨)
- 图 90:
- 2017 - 2029 年亚太地区饲料粘合剂价值(按国家/地区计算)(美元)
- 图 91:
- 2017 年、2023 年和 2029 年亚太地区各国饲料粘合剂的销量份额(%)
- 图 92:
- 2017、2023 和 2029 年亚太地区饲料粘合剂的价值份额(按国家/地区划分)
- 图 93:
- 澳大利亚饲料粘合剂产量(公吨),亚太地区,2017 - 2029 年
- 图 94:
- 澳大利亚饲料粘合剂价值(美元),亚太地区,2017 - 2029 年
- 图 95:
- 2022 年和 2029 年亚太地区澳大利亚饲料粘合剂按添加剂类别的价值份额(%)
- 图 96:
- 中国饲料粘合剂产量(公吨),亚太地区,2017 - 2029 年
- 图 97:
- 2017 - 2029 年亚太地区中国饲料粘合剂价值(美元)
- 图 98:
- 2022 年和 2029 年亚太地区中国饲料粘合剂按添加剂类别的价值份额(%)
- 图 99:
- 印度饲料粘合剂产量(公吨),亚太地区,2017 - 2029 年
- 图 100:
- 印度饲料粘合剂的价值(美元),亚太地区,2017 - 2029 年
- 图 101:
- 2022 年和 2029 年亚太地区印度饲料粘合剂按添加剂类别的价值份额(%)
- 图 102:
- 印度尼西亚饲料粘合剂产量(公吨),亚太地区,2017 - 2029 年
- 图 103:
- 印度尼西亚饲料粘合剂价值(美元),亚太地区,2017 - 2029 年
- 图 104:
- 2022 年和 2029 年亚太地区印度尼西亚饲料粘合剂按添加剂类别的价值份额(%)
- 图 105:
- 日本饲料粘合剂产量(公吨),亚太地区,2017 - 2029 年
- 图 106:
- 日本饲料粘合剂的价值(美元),亚太地区,2017 - 2029 年
- 图 107:
- 2022 年和 2029 年亚太地区日本饲料粘合剂按添加剂类别的价值份额(%)
- 图 108:
- 亚太地区菲律宾饲料粘合剂产量(公吨),2017 - 2029 年
- 图 109:
- 菲律宾饲料粘合剂价值(美元),亚太地区,2017 - 2029 年
- 图 110:
- 2022 年和 2029 年亚太地区菲律宾饲料粘合剂按添加剂类别的价值份额(%)
- 图 111:
- 韩国饲料粘合剂产量(公吨),亚太地区,2017 - 2029 年
- 图 112:
- 韩国饲料粘合剂的价值(美元),亚太地区,2017 - 2029 年
- 图 113:
- 2022 年和 2029 年亚太地区韩国饲料粘合剂按添加剂类别划分的价值份额(%)
- 图 114:
- 泰国饲料粘合剂产量(公吨),亚太地区,2017 - 2029 年
- 图 115:
- 泰国饲料粘合剂价值(美元),亚太地区,2017 - 2029 年
- 图 116:
- 2022 年和 2029 年亚太地区泰国饲料粘合剂按添加剂类别的价值份额(%)
- 图 117:
- 越南饲料粘合剂产量(公吨),亚太地区,2017 - 2029 年
- 图 118:
- 越南饲料粘合剂的价值(美元),亚太地区,2017 - 2029 年
- 图 119:
- 2022 年和 2029 年亚太地区越南饲料粘合剂按添加剂类别的价值份额(%)
- 图 120:
- 亚太地区其他饲料粘合剂产量,公吨,亚太地区,2017 - 2029 年
- 图 121:
- 亚太地区其他饲料粘合剂的价值(美元),2017 - 2029 年
- 图 122:
- 亚太地区其他饲料粘合剂按添加剂类别划分的价值份额,%,亚太地区,2022 年和 2029 年
- 图 123:
- 2017 - 2029 年欧洲各国饲料粘合剂产量(公吨)
- 图 124:
- 2017 - 2029 年饲料粘合剂价值(按国家/地区(美元)、欧洲)
- 图 125:
- 2017、2023 和 2029 年欧洲各国饲料粘合剂的销量份额(%)
- 图 126:
- 2017、2023 和 2029 年欧洲饲料粘合剂的价值份额(按国家/地区划分)
- 图 127:
- 法国饲料粘合剂产量(公吨),欧洲,2017 - 2029 年
- 图 128:
- 法国饲料粘合剂价值(美元),欧洲,2017 - 2029
- 图 129:
- 2022 年和 2029 年欧洲法国饲料粘合剂按添加剂类别的价值份额(%)
- 图 130:
- 德国饲料粘合剂产量(公吨),欧洲,2017 - 2029 年
- 图 131:
- 德国饲料粘合剂的价值(美元),欧洲,2017 - 2029 年
- 图 132:
- 德国饲料粘合剂按添加剂类别划分的价值份额,%,欧洲,2022 年和 2029 年
- 图 133:
- 意大利饲料粘合剂产量(公吨),欧洲,2017 - 2029 年
- 图 134:
- 意大利饲料粘合剂价值(美元),欧洲,2017 - 2029
- 图 135:
- 2022 年和 2029 年欧洲意大利饲料粘合剂按添加剂类别的价值份额(%)
- 图 136:
- 荷兰饲料粘合剂产量(公吨),欧洲,2017 - 2029 年
- 图 137:
- 荷兰饲料粘合剂的价值(美元),欧洲,2017 - 2029 年
- 图 138:
- 按添加剂类别划分的荷兰饲料粘合剂的价值份额,%,欧洲,2022 年和 2029 年
- 图 139:
- 俄罗斯饲料粘合剂产量(公吨),欧洲,2017 - 2029 年
- 图 140:
- 俄罗斯饲料粘合剂的价值(美元),欧洲,2017 - 2029
- 图 141:
- 2022 年和 2029 年欧洲俄罗斯饲料粘合剂按添加剂类别的价值份额(%)
- 图 142:
- 2017 - 2029 年欧洲西班牙饲料粘合剂产量(公吨)
- 图 143:
- 2017 - 2029 年西班牙饲料粘合剂价值(美元)、欧洲
- 图 144:
- 2022 年和 2029 年欧洲按添加剂类别划分的西班牙饲料粘合剂的价值份额(%)
- 图 145:
- 2017 - 2029 年欧洲火鸡饲料粘合剂产量(公吨)
- 图 146:
- 2017 - 2029 年欧洲火鸡饲料粘合剂的价值(美元)
- 图 147:
- 2022 年和 2029 年欧洲按添加剂类别划分的火鸡饲料粘合剂的价值份额(%)
- 图 148:
- 英国饲料粘合剂产量,公吨,欧洲,2017 - 2029 年
- 图 149:
- 英国饲料粘合剂的价值(美元),欧洲,2017 - 2029 年
- 图 150:
- 2022 年和 2029 年欧洲按添加剂类别划分的英国饲料粘合剂的价值份额(%)
- 图 151:
- 欧洲其他地区饲料粘合剂产量(公吨),欧洲,2017 - 2029 年
- 图 152:
- 欧洲其他地区饲料粘合剂的价值(美元),欧洲,2017 - 2029 年
- 图 153:
- 欧洲其他地区饲料粘合剂按添加剂子类别划分的价值份额,%,欧洲,2022 年和 2029 年
- 图 154:
- 2017 - 2029 年中东各国饲料粘合剂产量(公吨)
- 图 155:
- 2017 - 2029 年中东各国饲料粘合剂价值(美元)
- 图 156:
- 2017、2023 和 2029 年中东各国饲料粘合剂数量份额(%)
- 图 157:
- 2017、2023 和 2029 年中东饲料粘合剂的价值份额(按国家/地区划分)
- 图 158:
- 伊朗饲料粘合剂产量(公吨),中东,2017 - 2029 年
- 图 159:
- 中东伊朗饲料粘合剂价值(美元),2017 - 2029
- 图 160:
- 2022 年和 2029 年中东按添加剂类别划分的伊朗饲料粘合剂的价值份额(%)
- 图 161:
- 沙特阿拉伯饲料粘合剂产量,公吨,中东,2017 - 2029 年
- 图 162:
- 沙特阿拉伯饲料粘合剂的价值(美元),中东,2017 - 2029 年
- 图 163:
- 2022 年和 2029 年中东按添加剂类别划分的沙特阿拉伯饲料粘合剂的价值份额(%)
- 图 164:
- 中东其他饲料粘合剂产量,公吨,中东,2017 - 2029 年
- 图 165:
- 中东其他饲料粘合剂的价值(美元),中东,2017 - 2029 年
- 图 166:
- 2022 年和 2029 年中东其他饲料粘合剂按添加剂子类别划分的价值份额,%,中东
- 图 167:
- 2017 - 2029 年北美各国饲料粘合剂产量(公吨)
- 图 168:
- 2017 - 2029 年北美各国饲料粘合剂价值(美元)
- 图 169:
- 2017、2023 和 2029 年北美各国饲料粘合剂数量份额(%)
- 图 170:
- 2017 年、2023 年和 2029 年北美各国饲料粘合剂的价值份额(%)
- 图 171:
- 北美加拿大饲料粘合剂产量(公吨),2017 - 2029 年
- 图 172:
- 北美加拿大饲料粘合剂的价值(美元),2017 - 2029 年
- 图 173:
- 2022 年和 2029 年北美加拿大饲料粘合剂按添加剂类别的价值份额(%)
- 图 174:
- 北美墨西哥饲料粘合剂产量(公吨),2017 - 2029 年
- 图 175:
- 北美墨西哥饲料粘合剂价值(美元),2017 - 2029 年
- 图 176:
- 2022 年和 2029 年北美墨西哥饲料粘合剂按添加剂类别的价值份额(%)
- 图 177:
- 北美美国饲料粘合剂产量,公吨,2017 - 2029 年
- 图 178:
- 2017 - 2029 年北美美国饲料粘合剂价值(美元)
- 图 179:
- 2022 年和 2029 年北美美国饲料粘合剂按添加剂类别的价值份额(%)
- 图 180:
- 北美其他地区饲料粘合剂产量(公吨),北美,2017 - 2029 年
- 图 181:
- 北美其他地区饲料粘合剂的价值(美元),北美,2017 - 2029 年
- 图 182:
- 北美其他地区饲料粘合剂按添加剂类别的价值份额,%,北美,2022 年和 2029 年
- 图 183:
- 2017 - 2029 年南美洲各国饲料粘合剂产量(公吨)
- 图 184:
- 2017 - 2029 年南美洲各国饲料粘合剂价值(美元)
- 图 185:
- 2017、2023 和 2029 年南美洲各国饲料粘合剂数量份额(%)
- 图 186:
- 2017 年、2023 年和 2029 年南美洲各国饲料粘合剂的价值份额,%
- 图 187:
- 南美洲阿根廷饲料粘合剂产量,公吨,2017 - 2029 年
- 图 188:
- 南美洲阿根廷饲料粘合剂价值(美元),2017 - 2029 年
- 图 189:
- 2022 年和 2029 年南美洲阿根廷饲料粘合剂按添加剂类别的价值份额(%)
- 图 190:
- 巴西饲料粘合剂产量,公吨,南美洲,2017 - 2029 年
- 图 191:
- 南美洲巴西饲料粘合剂价值(美元),2017 - 2029 年
- 图 192:
- 2022 年和 2029 年南美洲巴西饲料粘合剂按添加剂类别的价值份额(%)
- 图 193:
- 南美洲智利饲料粘合剂产量(公吨),2017 - 2029 年
- 图 194:
- 2017 - 2029 年南美洲智利饲料粘合剂价值(美元)
- 图 195:
- 2022 年和 2029 年南美洲按添加剂类别划分的智利饲料粘合剂的价值份额(%)
- 图 196:
- 南美洲其他地区饲料粘合剂产量,公吨,南美洲,2017 - 2029 年
- 图 197:
- 南美洲其他地区饲料粘合剂的价值(美元),南美洲,2017 - 2029 年
- 图 198:
- 2022 年和 2029 年南美洲其他地区饲料粘合剂按添加剂类别的价值份额,%
- 图 199:
- 2017 年至 2023 年全球最活跃的公司(按战略举措数量计算)
- 图 200:
- 2017 - 2023 年全球最常采用的策略数量
- 图 201:
- 全球主要参与者的价值份额,%,2022 年
饲料粘合剂行业细分
天然粘合剂、合成粘合剂被细分为细分添加剂。动物涵盖了水产养殖、家禽、反刍动物、猪等细分领域。非洲、亚太地区、欧洲、中东、北美、南美按区域划分为细分市场。
- 2022年,全球饲料添加剂市场中粘合剂占据13%的重要份额。配合饲料中使用粘合剂可提高饲料添加剂的功效。粘合剂是第二大饲料添加剂类型,广泛用于几乎所有饲料混合物中,这使其成为商业动物养殖者的基本要求。
- 在饲料粘合剂类型中,合成粘合剂在全球拥有最大的市场份额,预计到 2022 年将达到 26 亿美元。合成粘合剂是首选,因为它们有助于饲料制粒,改善动物的消化和营养摄入,从而预防疾病。
- 然而,由于天然粘合剂价格较低且能够生产优质颗粒,预计在预测期内将实现更高的增长率,即 4.8%。
- 2022年,亚太地区是全球饲料粘合剂市场最大的地区,市场份额为30.6%。该地区的高份额是由于其较高的饲料产量,这与生产的商业饲料成正比,估计 2022 年将达到近 50 万吨。
- 美国和加拿大等饲料产量和添加剂使用量较高的国家对粘合剂的需求较高。因此,北美饲料粘合剂市场预计将增长更快,预测期内复合年增长率为 4.9%。
- 在商业动物生产增加以及使用添加剂改善动物健康和生产力的推动下,饲料粘合剂市场预计将出现显着增长。预计该市场在预测期内的复合年增长率为 4.6%。
| 副添加剂 | |
| 天然粘合剂 | |
| 合成粘合剂 |
| 动物 | |||||||
| |||||||
| |||||||
| |||||||
| 猪 | |||||||
| 其他动物 |
| 地区 | ||||||||||||||
| ||||||||||||||
| ||||||||||||||
| ||||||||||||||
| ||||||||||||||
| ||||||||||||||
|
市场定义
- 功能 - 在这项研究中,饲料添加剂被认为是商业生产的产品,当以适当的比例饲喂时,用于增强增重、饲料转化率和采食量等特性。
- 经销商 - 从事转售无增值饲料添加剂的公司已被排除在市场范围之外,以避免重复计算。
- 最终消费者 - 复合饲料制造商被认为是所研究市场的最终消费者。范围不包括农民购买饲料添加剂直接用作补充剂或预混料。
- 公司内部消耗 - 研究的一部分是从事配合饲料生产以及饲料添加剂制造的公司。但是,在估算市场规模时,这些公司对饲料添加剂的内部消耗被排除在外。
研究方法
Mordor Intelligence在所有报告中都遵循四步方法。
- 步骤1:识别关键变量: 从一组相关变量和因素中,基于桌面研究和文献综述,选择与特定产品细分和国家相关的可量化关键变量(行业和外部);以及主要专家输入。这些变量进一步通过回归建模(如有必要)进行确认。
- 步骤2:建立市场模型: 为了建立一个强大的预测方法,将在第1步中确定的变量和因素与可用的历史市场数字进行测试。通过迭代过程,设置了市场预测所需的变量,并且该模型是基于这些变量构建的。
- 步骤3:验证和完成: 在这一重要步骤中,通过对所研究市场的广泛初级研究专家网络,验证了所有市场数字,变量和分析师呼叫。受访者被选中跨级别和功能,以产生所研究市场的整体画面。
- 步骤4:研究产出: 辛迪加报告,定制咨询任务,数据库和订阅平台。


