Market Overview
| Study Period | 2020 - 2030 |
|---|---|
| Base Year For Estimation | 2024 |
| Forecast Data Period | 2025 - 2030 |
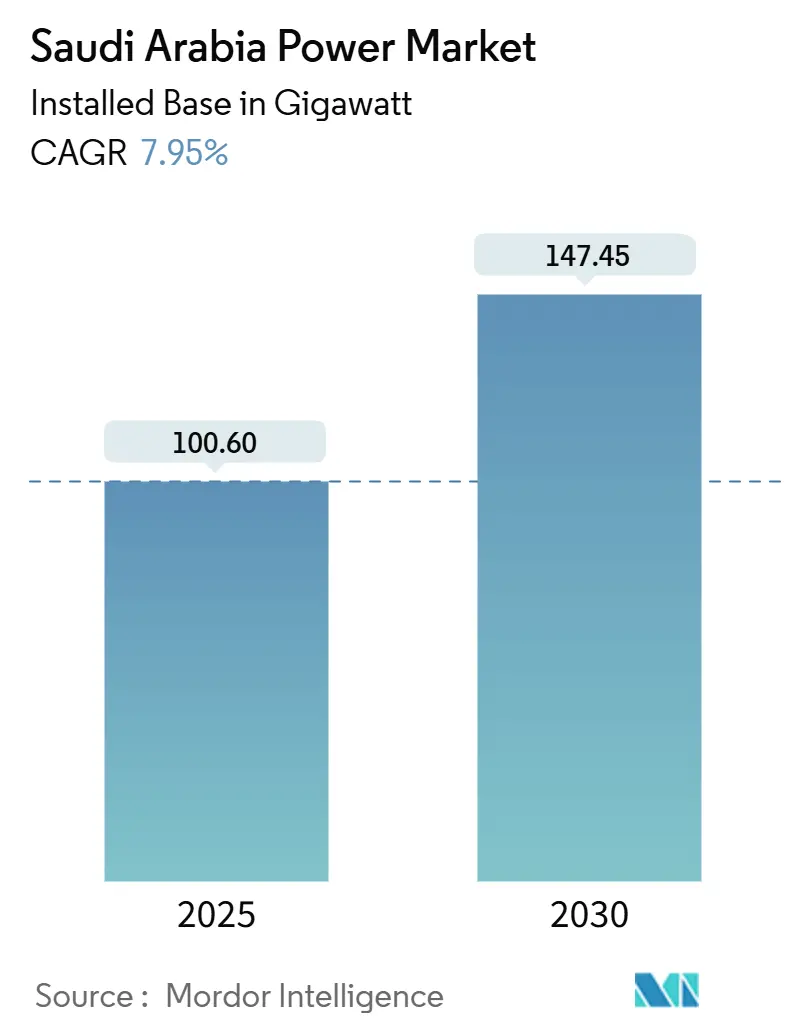
| Market Volume (2025) | 100.60 gigawatt |
| Market Volume (2030) | 147.45 gigawatt |
| Growth Rate (2025 - 2030) | 7.95% CAGR |
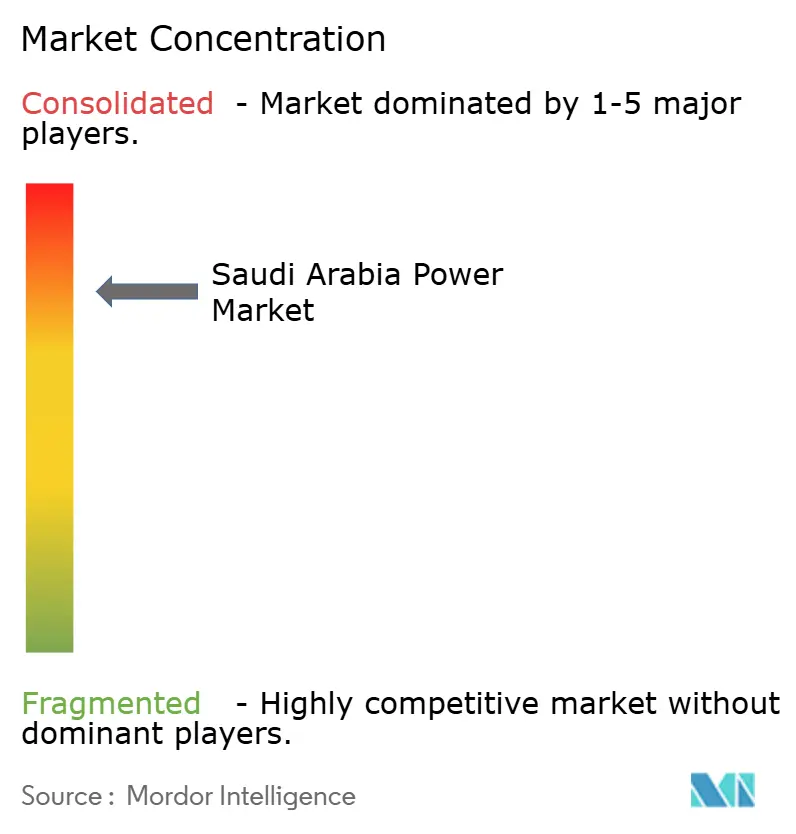
| Market Concentration | High |
Major Players
*Disclaimer: Major Players sorted in no particular order Image © Mordor Intelligence. Reuse requires attribution under CC BY 4.0. |
|
Saudi Arabia Power Market Analysis by Mordor Intelligence
The Saudi Arabia Power Market size in terms of installed base is expected to grow from 100.60 gigawatt in 2025 to 147.45 gigawatt by 2030, at a CAGR of 7.95% during the forecast period (2025-2030).
Vision 2030’s requirement that renewables supply half of the Kingdom’s electricity by decade-end is accelerating procurement, while the Liquid Fuel Displacement Programme is freeing oil for export by switching generation toward gas and clean energy.(1)Ministry of Energy, “Saudi Energy Statistical Yearbook 2025,” energy.gov.sa Cooling loads that create 70% of summer peaks continue to pull demand upward, yet tariff reforms have already made industrial and commercial customers active investors in on-site generation and efficiency. Independent power producer (IPP) participation is expanding rapidly because streamlined licensing now clears projects in six months for plants below 500 MW, a quarter of the previous timeline. Grid bottlenecks persist, but a USD 20 billion modernization plan anchored in high-voltage direct-current (HVDC) links and smart meters is underway to integrate the fast-growing renewable fleet.
Key Report Takeaways
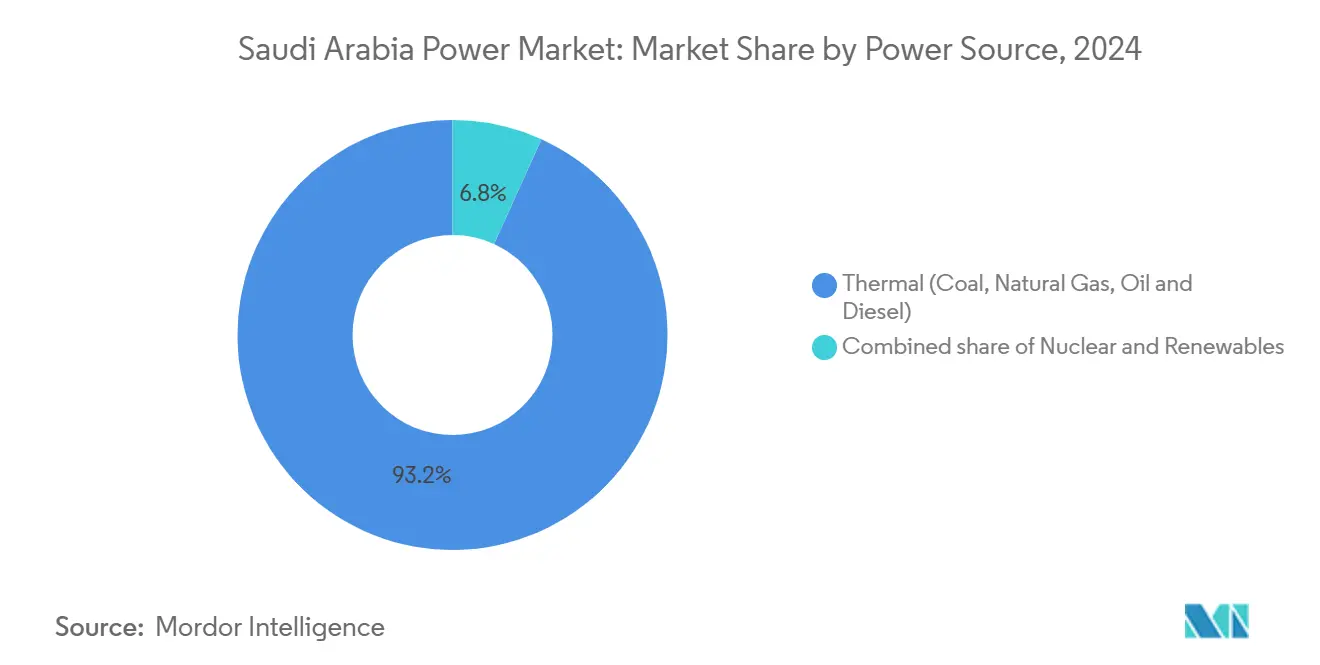
- By power source, thermal generation led with 93.2% of the Saudi Arabian power market share in 2024, while renewables are forecast to expand at a 39.6% CAGR through 2030.
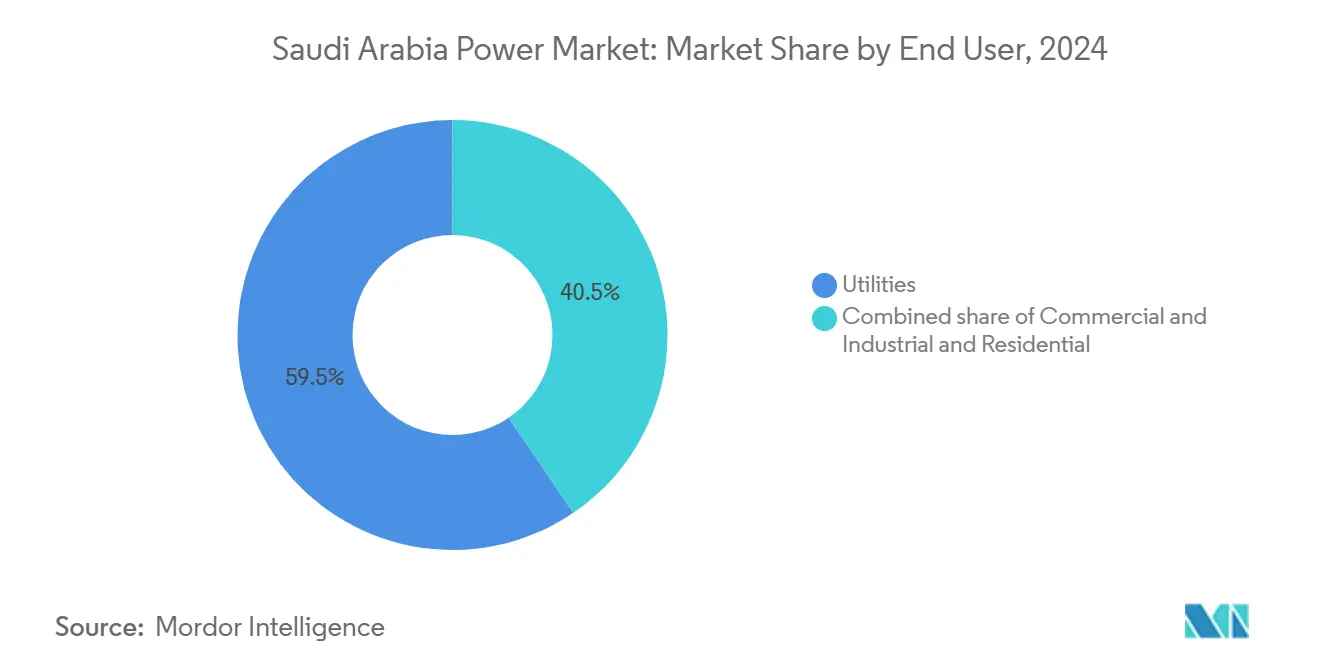
- By end user, utilities held a 59.5% share of the Saudi Arabian power market size in 2024, whereas the commercial and industrial segment is projected to grow at an 11.5% CAGR to 2030.
- The Public Investment Fund, through Badeel and ACWA Power, is expected to supply 70% of renewable additions scheduled for commissioning by 2030.
Saudi Arabia Power Market Trends and Insights
Drivers Impact Analysis
| Driver | (~) % Impact on CAGR Forecast | Geographic Relevance | Impact Timeline |
|---|---|---|---|
| Vision 2030 renewable-mix mandate | +2.8% | National, with concentration in Northern Border, Tabuk, and Eastern Province solar/wind zones | Long term (≥ 4 years) |
| Electricity-tariff reforms spur efficiency spending | +1.2% | National, strongest in urban centers (Riyadh, Jeddah, Dammam) with high C&I density | Medium term (2-4 years) |
| Rapid population & cooling-load growth | +1.5% | National, peak impact in Western and Central regions | Medium term (2-4 years) |
| Power-sector privatization & IPP pipeline | +1.3% | National, early gains in Makkah, Riyadh, and Eastern Province | Medium term (2-4 years) |
| Liquid-Fuel-Displacement Programme to free 1 Mb/d oil | +0.9% | National, prioritizing gas-grid expansion in Eastern Province and renewable zones | Long term (≥ 4 years) |
| Local-content (>75%) rules create domestic OEM demand | +0.3% | National, manufacturing hubs in Dammam, Jubail, and Yanbu | Long term (≥ 4 years) |
| Source: Mordor Intelligence | |||
Vision 2030 Renewable-Mix Mandate
The National Renewable Energy Program has awarded 21 projects totaling 19 GW, and seven of these plants, equal to 4.1 GW, were operating by late 2024.(2)Renewable Energy Project Development Office, “NREP Round 6 Tender Documents,” repdo.gov.sa Grid-connected renewables climbed to 6.5 GW in 2024 and are scheduled to double to 12.7 GW in 2025. Single-buyer concentration inside the Public Investment Fund simplifies permitting, which enabled Sakaka Solar to close at 2.32 cents /kWh and Dumat Al Jandal Wind at 2.13 cents /kWh, among the world’s lowest tariffs. Resource-mapping campaigns covering 850,000 km² have confirmed annual solar irradiation above 2,200 kWh/m² in the Eastern Province and class-II wind speeds across Northern Border and Tabuk, guiding developers to the most bankable sites. Renewables already displace 50,000 barrels per day of crude burn, and each added gigawatt increases that benefit in direct proportion to its capacity factor.
Electricity-Tariff Reforms Spur Efficiency Spending
The 2018 rate restructuring moved residential prices to a 5–32 halala/kWh tier and industrial tariffs to 18 halala/kWh, removing long-standing subsidies and linking quarterly adjustments to Brent and Henry Hub benchmarks. Large factories in Jubail and Yanbu have since signed behind-the-meter solar power-purchase agreements over 100 MW each, achieving delivered costs below two cents /kWh. Energy-service companies now retrofit commercial towers with variable-speed drives and smart controls that cut cooling consumption by 20%, and those savings provide payback periods under four years at the new tariff regimes. The same price signals lifted commercial and industrial demand for software-based load management that flattens peak curves and reduces demand penalties on utility bills. C&I demand is therefore rising faster than population growth because electrification of process heat and data-center loads more than offset incremental efficiency.
Rapid Population & Cooling-Load Growth
The population is on track to jump from 32.2 million in 2022 to 39 million by 2030, adding eight million residents in one decade. Cooling already accounts for 70% of summer peaks, and in Riyadh, that percentage exceeds 80% when outside temperatures top 45 °C. Peak demand hit 82 GW in 2023 and is expanding 3–4% yearly, faster than the national average. Saudi Electricity Company will deploy 3 GW of battery storage by 2030 to shift excess solar output into evening ramps where air conditioning remains heavy. District cooling now under construction at NEOM and Diriyah Gate couples absorption chillers with thermal storage that removes 30% of electrical load compared with standalone split-units.
Power-Sector Privatization & IPP Pipeline
Saudi Electricity Company has begun separating generation, transmission, and distribution, and will finish in 2025, creating ring-fenced businesses that can benchmark performance against global utilities. More than 60 IPP projects worth over USD 80 billion have moved into feasibility or construction, covering renewables, combined-cycle gas, and cogeneration plants paired with desalination. Streamlined licensing now clears sub-500 MW projects in six months, stimulating mid-scale solar and wind farms in secondary cities. ACWA Power’s 1.5 GW Sudair Solar, commissioned in 2024, demonstrated that standardized contracts and pre-qualified vendor lists shorten execution to 24 months from notice to proceed. Foreign equity is capped at 49% for generation assets but unrestricted for construction and O&M, a structure that preserves domestic ownership yet channels international expertise where local supply chains remain thin.
Restraints Impact Analysis
| Restraint | (~) % Impact on CAGR Forecast | Geographic Relevance | Impact Timeline |
|---|---|---|---|
| Hydrocarbon lock-in & stranded-asset risk | -0.7% | National, concentrated in oil-fired plants in Western and Southern regions | Long term (≥ 4 years) |
| Grid bottlenecks and limited inter-regional redundancy | -0.5% | National, acute in Northern Border and Tabuk renewable zones lacking transmission | Short term (≤ 2 years) |
| Desalination-driven baseload inflates capacity needs | -0.4% | Coastal regions (Eastern Province, Makkah, Madinah) with co-located desalination | Medium term (2-4 years) |
| Local-content compliance raises foreign project CAPEX | -0.3% | National, impacting projects with high imported-equipment ratios | Medium term (2-4 years) |
| Source: Mordor Intelligence | |||
Grid Bottlenecks and Limited Inter-Regional Redundancy
The 90,000 km transmission grid rests on a 380 kV backbone that can transfer only 15 GW across major regions, leaving renewable clusters in Tabuk and Northern Border exposed to curtailment until new HVDC corridors enter service after 2027. A 2024 transformer failure in the Eastern Province cut 2 GW of industrial load for six hours and highlighted vulnerability to single-point outages, especially during high-temperature periods when cooling demand is highest. Smart-meter rollout covering 10 million customers by 2026 will enable demand response, yet adoption in rural districts lags and still relies on manual billing.
Hydrocarbon Lock-In & Stranded-Asset Risk
Installed thermal plants represent over USD 100 billion of sunk capital and still account for 93.2% of capacity, so bringing renewables to 50% by 2030 will leave 40–50 GW of gas and oil capacity under-utilized. Private IPPs that financed those plants on 25-year power-purchase agreements could face write-downs because there is no formal compensation mechanism for stranded assets. Gas turbines keep some value as a flexible reserve, but oil-fired steam plants around coastal desalination sites risk outright retirement unless hydrogen or carbon-capture retrofits become commercial. Saudi Electricity Company can absorb losses through its balance sheet, yet smaller sponsors may renegotiate tariffs, slowing financial closes on upcoming projects.
Segment Analysis
By Power Source: Renewables Surge From a Small Base
Renewables held 6.5 GW, or 6.8%, of installed capacity in 2024 but are forecast to add 12.7 GW by 2025 and exceed 40 GW by 2030, lifting their share of the Saudi Arabia power market size to more than one-quarter within the outlook period. Solar photovoltaic dominates the pipeline, benefiting from annual irradiation above 2,200 kWh/m² across the Eastern Province and Northern Border, while wind growth centers on Dumat Al Jandal and upcoming projects in Yanbu and Al Ghat, where hub-height speeds average seven meters per second. Hydro, geothermal, and biomass remain negligible due to geography and scarce feedstock, limiting diversification beyond solar and wind.
Natural gas anchors 60 % of thermal generation and will stay essential for grid stability even as renewables climb. The Ras Al Khair LNG terminal, which opened in 2024, lifted gas availability for western plants and can expand to supply hydrogen-ready turbines in Madinah and Makkah.(3)Saudi Aramco, “Master Gas System Expansion Update,” aramco.com The Liquid Fuel Displacement Programme seeks to cut oil-fired capacity below 10% by 2030, yet remote desalination plants will need transitional diesel until pipelines or storage arrive. Nuclear power, scheduled for a 2.8 GW first phase by 2030, offers a long-term option for firm zero-carbon capacity once site selection and vendor agreements are finalized.
Note: Segment shares of all individual segments available upon report purchase
Get Detailed Market Forecasts at the Most Granular Levels
Download PDF
By End User: Commercial & Industrial Growth Outpaces Utilities
Utilities commanded 59.5% of the Saudi Arabian power market share in 2024, thanks to the Saudi Electricity Company’s monopoly on residential and small-commercial supply, but the segment will shrink as tariff reforms encourage self-generation among large consumers. Commercial and industrial demand is rising at an 11.5% CAGR, faster than the overall market, because petrochemicals, data centers, and logistics hubs contract directly for solar-plus-storage or cogeneration that lowers delivered costs.
Data-center operators linked to NEOM and Riyadh’s smart-city plans have signed 24/7 renewable supply deals that combine on-site storage with grid-tied PPAs, a structure already common in Europe but still new to the Gulf. Residential consumption grows more slowly in per-capita terms as new building codes enforce higher insulation standards and appliance labeling steers buyers toward efficient air-conditioning and LED lighting. Net-metering rules that take effect in 2025 will allow homes and small businesses to export rooftop solar surplus at 75% of retail tariffs, unlocking one gigawatt of distributed generation by 2028.
Note: Segment shares of all individual segments available upon report purchase
Get Detailed Market Forecasts at the Most Granular Levels
Download PDF
Geography Analysis
The Eastern Province accounts for about 35% of national electricity demand because petrochemical complexes in Jubail and Ras Tanura operate energy-intensive processes and desalination units near the coast. Direct access to the Master Gas System lets combined-cycle turbines in the province run at high load factors, reinforcing its role as the anchor for baseload generation. The Central Province, centered on Riyadh, consumes 30% of national electricity and registers summer peaks above 25 GW driven by cooling inside a metropolitan population that now exceeds 7.5 million.
The Western Province, including Jeddah, Makkah, and Madinah, represents 25% of demand and sees temporary increases of 3–4 GW during Hajj and Umrah seasons that require fast-start capacity.(4)Ministry of Hajj and Umrah, “Pilgrimage Services Report 2024,” hajj.gov.sa Northern Border and Tabuk host most greenfield renewable projects because solar irradiation and wind resources rank among the best nationwide, yet their weak transmission connection to Riyadh and Jeddah increases curtailment until HVDC corridors come online after 2027. The Southern Province holds 10% of demand across mountainous terrain that challenges grid reliability; mini-grids powered by solar-plus-storage are being trialed to cut outages.
NEOM covers 26,500 km² in the northwest and will run on 100% renewable power, including 4 GW dedicated to green hydrogen for export, making the project a test bed for islanded high-penetration grids. Cross-border interconnections remain limited to a 1.8 GW Gulf Cooperation Council link that is rarely used because neighboring states also peak in summer, though a 3 GW line with Egypt under study could enable daytime solar exports and evening hydro imports once commercial terms are settled. Liberalized rules for distributed generation up to 2 MW now allow factories in Riyadh and Jeddah to install rooftops without lengthy grid-impact studies, accelerating adoption in urban load pockets.
Competitive Landscape
Saudi Electricity Company is unbundling into separate businesses, yet procurement remains concentrated because the Public Investment Fund mandates that Badeel and ACWA Power deliver 70% of renewables through 2030. Siemens Energy and GE Vernova supply H-class turbines featuring 64% combined-cycle efficiency, while Mitsubishi Power is commercializing burners that can co-fire up to 30% green hydrogen, aligning with the Kingdom’s hydrogen export roadmap. Hitachi Energy holds contracts for HVDC converter stations that will move 3 GW from Tabuk to Riyadh, reducing curtailment risk in the northern renewable cluster.
Battery storage stands out as an open field because SEC’s 3 GW target by 2030 is still largely untendered, providing entry points for CATL, Samsung SDI, and domestic integrators. Green-hydrogen ambition stretches beyond the USD 8.4 billion NEOM project as Air Products, Masdar, and Aramco evaluate additional electrolysis sites near coastal industrial zones where desalinated water and renewable power already co-locate. Smaller EPC specialists such as AlFanar Energy and Desert Technologies gain share in balance-of-plant contracts because In-Kingdom Total Value Add scoring rewards local manufacturing commitments over the lowest headline bid.
Grid digitalization is another competitive segment; Schneider Electric and Siemens Energy deploy advanced metering and distribution-automation systems that aim to cut technical losses from 7% to under 5% by 2028, freeing the equivalent of 2 GW of effective capacity without adding new plants. Market participants, therefore, differentiate on local-content depth, technology readiness, and the ability to integrate renewable assets with storage and smart-grid platforms.
Saudi Arabia Power Industry Leaders
-
ACWA Power Co
-
Saudi Electricity Company (SEC) SJSC
-
Marafiq
-
Engie SA
-
EDF SA
- *Disclaimer: Major Players sorted in no particular order
Need More Details on Market Players and Competitors?
Download PDF
Recent Industry Developments
- May 2025: GE Vernova announced initiatives worth up to USD 14.2 billion that deploy advanced turbines and grid stability solutions in partnership with Saudi Electricity Company, ACWA Power, and Aramco.
- May 2025: Maaden and MP Materials signed a pact to build a full rare-earth magnet value chain that supports renewable equipment manufacturing.
- April 2025: The Ministry of Energy and SEC broke ground on a 2.5 GW grid-scale storage project exceeding SAR 6.73 billion to reinforce reserves.
- March 2025: Public Investment Fund and Hyundai formed a USD 500 million joint venture to assemble 50,000 vehicles annually, including electric models that will raise grid load.
Saudi Arabia Power Market Report Scope
Power generation is electricity generated through various primary sources such as coal, hydro, solar, thermal, etc. In utilities, it’s a step before its delivery to its end users. Then, the process is followed by transmission and distribution. Under this, the power generated is distributed via high-voltage lines (transmission lines) and low-voltage lines (distribution lines) as per the requirement of the end user. The Saudi Arabian power market report includes:
By Power Source
| Thermal (Coal, Natural Gas, Oil and Diesel) |
| Nuclear |
| Renewables (Solar, Wind, Hydro, Geothermal, Biomass & Waste, Tidal) |
By End User
| Utilities |
| Commercial and Industrial |
| Residential |
By T&D Voltage Level (Qualitative Analysis only)
| High-Voltage Transmission (Above 230 kV) |
| Sub-Transmission (69 to 161 kV) |
| Medium-Voltage Distribution (13.2 to 34.5 kV) |
| Low-Voltage Distribution (Up to 1 kV) |
| By Power Source | Thermal (Coal, Natural Gas, Oil and Diesel) |
| Nuclear | |
| Renewables (Solar, Wind, Hydro, Geothermal, Biomass & Waste, Tidal) | |
| By End User | Utilities |
| Commercial and Industrial | |
| Residential | |
| By T&D Voltage Level (Qualitative Analysis only) | High-Voltage Transmission (Above 230 kV) |
| Sub-Transmission (69 to 161 kV) | |
| Medium-Voltage Distribution (13.2 to 34.5 kV) | |
| Low-Voltage Distribution (Up to 1 kV) |
Need A Different Region or Segment?
Customize Now
Key Questions Answered in the Report
What will be the installed capacity be in Saudi Arabia by 2030?
Forecasts place total installed capacity at 147.45 GW, up from 100.60 GW in 2025; reflecting a 7.95% CAGR over 2025-2030.
What capacity will Saudi Arabia add from renewables by 2030?
Awarded and announced projects point to more than 57 GW of renewable additions, lifting clean-energy share above one-quarter of the Saudi Arabia power market by 2030.
How fast is commercial and industrial demand growing?
Commercial and industrial electricity consumption is rising at an 11.5% CAGR between 2025 and 2030, faster than the overall market expansion.
How fast is solar PV capacity growing?
Solar PV records the fastest 8.3% CAGR through 2030, buoyed by record-low tariffs and high irradiation.
What role does natural gas play in the generation mix?
Natural gas supplies 60% of current thermal generation and remains pivotal for grid flexibility even as renewables expand.
How will the grid handle large renewable clusters in Tabuk?
Two 3 GW HVDC links scheduled for completion in 2027 will move surplus power from northern solar and wind farms to central demand centers.
When will net-metering standards take effect?
New regulations allowing rooftop solar systems up to 2 MW to export at 75% of retail tariffs begin in January 2025.
Page last updated on:


