Market Overview
| Study Period | 2020 - 2031 |
|---|---|
| Forecast Data Period | 2026 - 2031 |
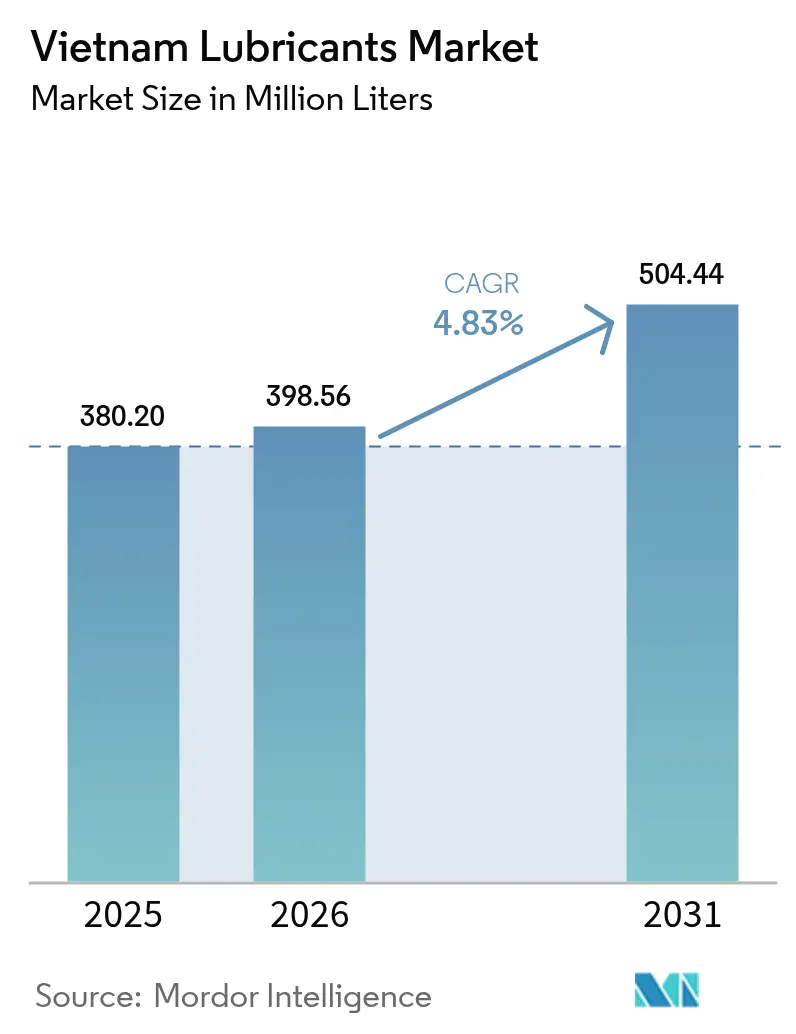
| Base Year Market Size (2025) | 380.20 Million liters |
| Market Volume (2026) | 398.56 Million liters |
| Market Volume (2031) | 504.44 Million liters |
| Growth Rate (2026 - 2031) | 4.83% CAGR |
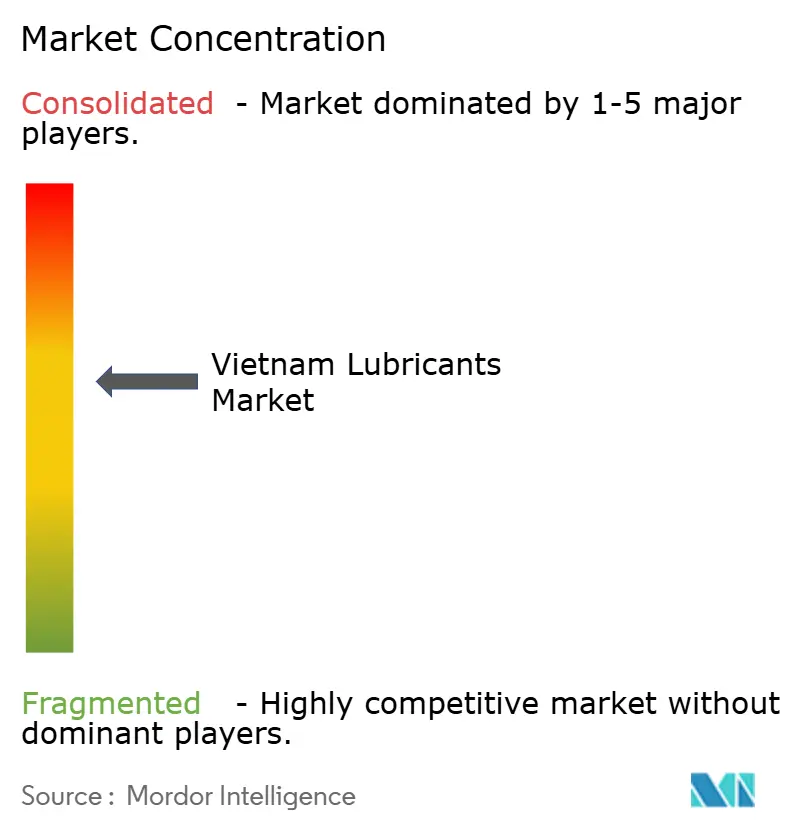
| Market Concentration | Medium |
Major Players *Disclaimer: Major Players sorted in no particular order Image © Mordor Intelligence. Reuse requires attribution under CC BY 4.0. | |
Vietnam Lubricants Market Analysis by Mordor Intelligence
Vietnam Lubricants Market size in 2026 is estimated at 398.56 million liters, growing from 2025 value of 380.20 million liters with 2031 projections showing 504.44 million liters, growing at 4.83% CAGR over 2026-2031. This growth persists even as electrification advances, because two-wheelers continue to dominate mobility, and new manufacturing investments keep industrial activity rising. An expanding vehicle parc sustains momentum, a shift toward higher-performance formulations, and steady foreign direct investment that lifts machinery demand across industrial zones. Market participants emphasize premium drain-interval products, broad distribution, and localized blending to protect margins against base-oil cost fluctuations. At the same time, looming environmental taxes and Extended Producer Responsibility (EPR) rules are steering producers toward synthetic and bio-based lines that command higher price points yet trim lifecycle emissions. These intersecting trends frame a resilient near-term outlook for the Vietnam lubricants market even as electric vehicles (EVs) gradually erode conventional engine oil volumes.
Key Report Takeaways
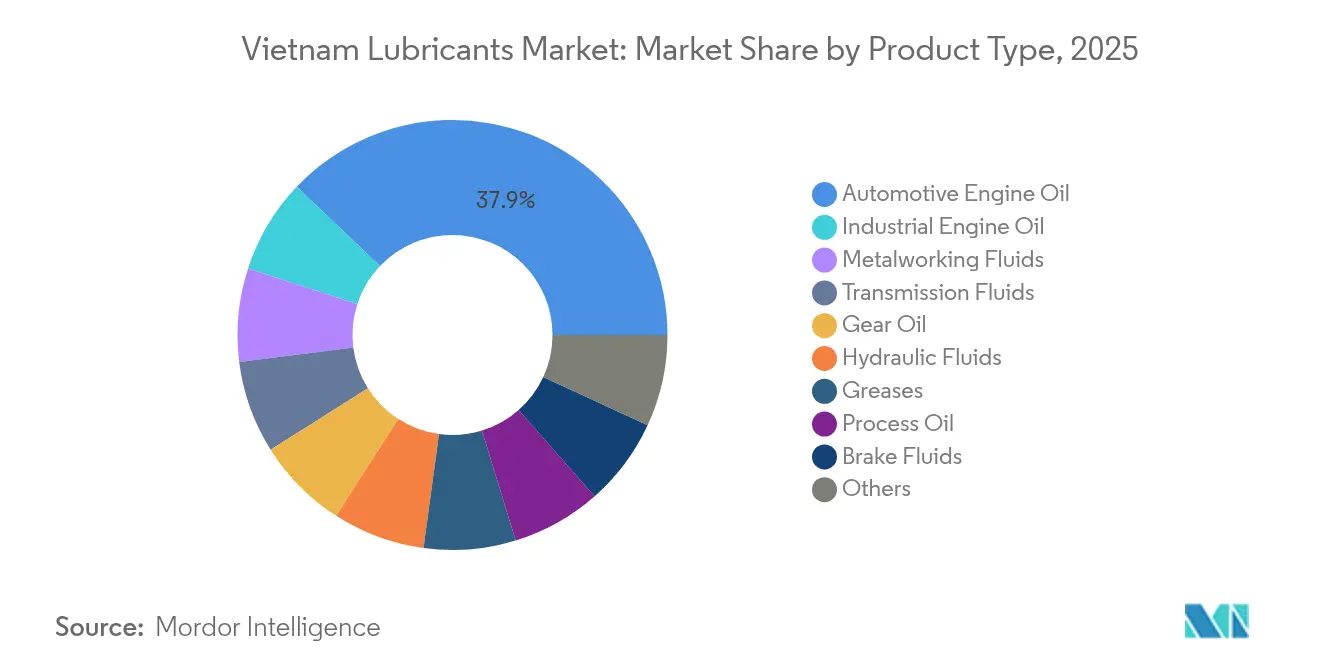
- By product type, automotive engine oil led with 37.90% revenue in 2025, while industrial engine oil is projected to advance at a 5.22% CAGR through 2031.
- By end-user industry, automotive applications accounted for 70.05% of the Vietnam lubricants market share in 2025; however, industrial users are projected to expand at a 5.08% CAGR through 2031.
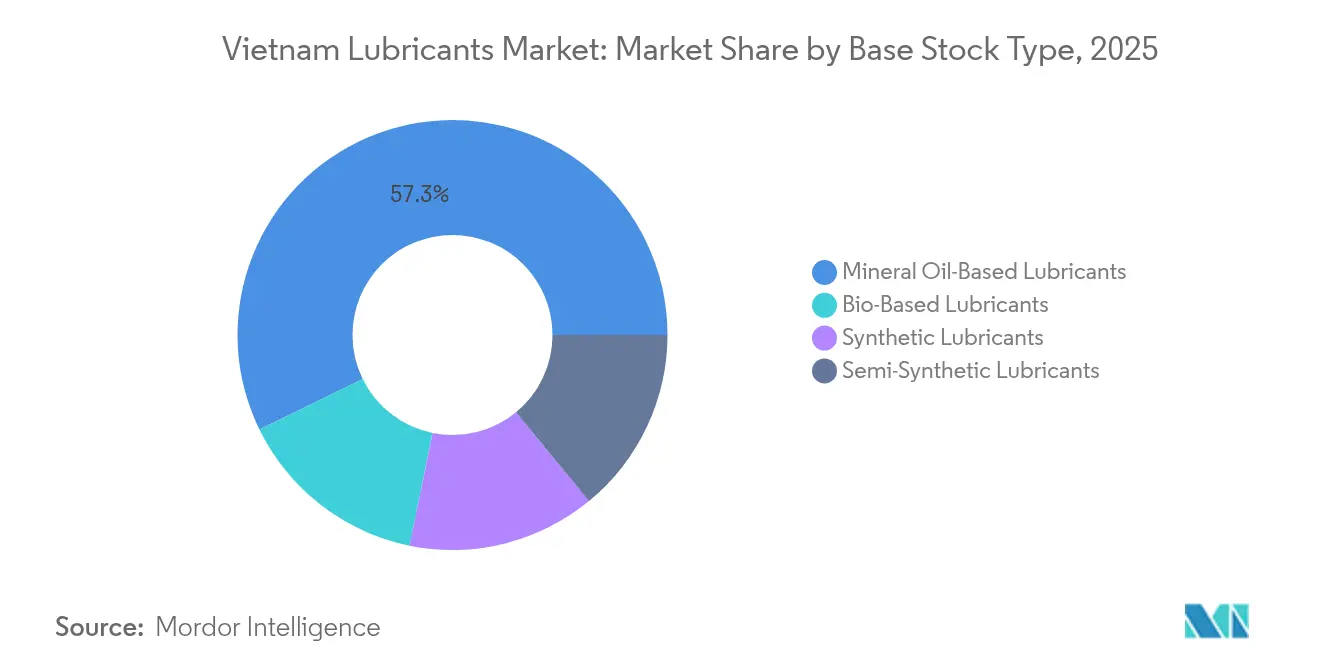
- By base stock, mineral-oil formulations retained 57.25% of the Vietnam lubricants market size in 2025; bio-based alternatives recorded the fastest 5.52% CAGR over the forecast horizon.
Note: Market size and forecast figures in this report are generated using Mordor Intelligence’s proprietary estimation framework, updated with the latest available data and insights as of 2026.
Vietnam Lubricants Market Trends and Insights
Driver Impact Analysis*
| Drivers | (~) % Impact on CAGR Forecast | Geographic Relevance | Impact Timeline |
|---|---|---|---|
| Rising vehicle parc and two-wheeler dominance | +1.8% | Ho Chi Minh City, Hanoi | Medium term (2-4 years) |
| Accelerating industrialization and FDI manufacturing growth | +1.2% | Northern and southern industrial zones | Long term (≥ 4 years) |
| Shift toward synthetic/higher-performance lubricants | +0.9% | Urban centers | Medium term (2-4 years) |
| Growth of foreign-invested auto-component plants | +0.6% | Thai Binh, Hai Duong clusters | Long term (≥ 4 years) |
| Expansion of cross-border e-commerce logistics fleets | +0.4% | Border provinces, logistics corridors | Short term (≤ 2 years) |
| Source: Mordor Intelligence | |||


Rising Vehicle Parc and Two-Wheeler Dominance
Vietnam’s industrial policy aims to achieve annual passenger-car and two-wheeler sales of approximately 1.0–1.1 million units by 2030. Two-wheelers still account for the majority of the vehicle fleet, preserving a large base of internal-combustion engines that require frequent oil changes. Although electric motorcycles accounted for a significant portion of new two-wheeler registrations in 2024, range anxiety outside urban cores continues to underpin sustained demand for mineral oil and semi-synthetic products. Regular maintenance cycles associated with motorcycles, combined with rising disposable incomes, continue to anchor volume growth for engine oils and transmission fluids[1]International Energy Agency, “Global EV Outlook 2024,” iea.org.
Accelerating Industrialization and FDI Manufacturing Growth
Manufacturing FDI reached USD 15.2 billion in the first six months of 2024, with processing and electronics plants accounting for more than two-thirds of the inflows. These capital injections translate into machinery installations that demand hydraulic, gear, and metalworking fluids engineered for longer drain intervals and lower downtime. Industrial parks in Hai Phong, Bac Ninh, and Dong Nai require OEM-approved lubricants that comply with global supply-chain audit standards. The resulting pull for synthetic and bio-based lubricants helps lift overall premium-product penetration through the forecast window.
Shift Toward Synthetic and Higher-Performance Lubricants
Emission regulations aligned with Euro 5 standards came into effect in 2025, accelerating customer migration from straight-grade mineral oils to low-SAPS synthetics that protect exhaust after-treatment systems. International brands introduced re-refined and bio-based ranges, such as Motul’s NGEN line, catering to fleet operators focused on reducing the total cost of ownership. Industrial users are also shifting toward poly-alpha-olefin-based hydraulic oils that can withstand elevated operating temperatures, thereby extending service intervals and reducing unplanned downtime in high-output factories.
Growth of Foreign-Invested Auto-Component Plants
Automotive component localization targets of 55–60% domestic value-add by 2030 are prompting Japanese and Korean OEMs to establish engine, transmission, and drivetrain facilities in Thai Binh and Hai Duong. These factories require specialized cutting fluids and stamping oils that meet stringent cleanliness benchmarks. They also create demand for dielectric and thermal-management fluids used in EV battery modules and inverter assemblies, which represent nascent but high-value lubricant niches.
Restraint Impact Analysis*
| Restraints | (~) % Impact on CAGR Forecast | Geographic Relevance | Impact Timeline |
|---|---|---|---|
| Base-oil import price volatility | -0.8% | Nationwide | Short term (≤ 2 years) |
| Rapid rise of electric motorcycles | -1.1% | Hanoi, Ho Chi Minh City | Medium term (2-4 years) |
| Stricter used-oil disposal rules | -0.3% | Industrial zones | Long term (≥ 4 years) |
| Source: Mordor Intelligence | |||
Base-Oil Import Price Volatility
Vietnam imports the majority of its base-oil requirement, exposing local blenders to global crude swings. A spike in Group II base-oil spot prices in 2024 compressed margins and led to retail price hikes across most viscosity grades. Independent blenders with limited inventory credit struggled to pass on costs, risking volume losses to heavily promoted international brands. As a result, some distributors trimmed rural stock levels, causing sporadic shortages in tier-3 cities until supply contracts normalized.
Rapid Rise of Electric Motorcycles
The share of electric two-wheelers in new sales increased in 2024, driven by government incentives and the development of urban charging networks. Each electrified motorcycle reduces annual engine oil demand by approximately 2–3 liters, directly eroding volume growth in densely populated cities. Battery-swapping ecosystems pioneered by VinFast also reduce friction for rural adoption, accelerating the displacement curve of lubricants in secondary towns.
*Our forecasts treat driver/restraint impacts as directional, not additive. The impact forecasts reflect baseline growth, mix effects, and variable interactions.
Segment Analysis
By Product Type: Industrial Engine Oil Drives Premium Growth
In 2025, automotive engine oil commands a 37.90% share of the market, underscoring Vietnam's transportation landscape, which is heavily skewed towards motorcycles. Here, both 2-stroke and 4-stroke engine oils cater to a staggering 77 million registered two-wheelers. Industrial engine oil is the fastest-growing product category, expanding at a 5.22% CAGR through 2031, driven by new gas-fired and renewable power projects. The demand is driven by OEM requirements for low-ash formulations that enable longer maintenance intervals. Transmission fluids are expected to benefit from increased automatic-transmission penetration in passenger cars, while gear oil demand is expected to align with the expansion of light-commercial and logistics fleets.
Metalworking fluids escalate in tandem with precision-machining investments by Samsung and Foxconn suppliers, and Master Fluid Solutions’ localized distribution underscores this trend. Turbine and transformer oils are experiencing steady growth as Vietnam’s Power Development Plan targets a 29% renewable capacity by 2030, creating specialty-fluid opportunities that offer attractive margins. Overall, the product mix is tilting toward higher-performance synthetics that accommodate high-load, high-temperature operating conditions in modern equipment.


By End-User Industry: Manufacturing Industrialization Accelerates Demand
Automotive applications still accounted for 70.05% of the Vietnam lubricants market share in 2025, anchored by the sizeable two-wheeler parc. Yet, industrial consumption is scaling faster, growing at a 5.08% CAGR amid sustained FDI inflows. Factories producing electronics, textiles, and metal components require ISO-grade hydraulic and gear oils that maintain viscosity stability over extended operating shifts.
Power generation growth, both conventional and renewable, adds steady volume for turbine, transformer, and compressor oils. The marine sector is benefiting from increased port capacity and cargo throughput, which is spurring demand for trunk-piston engine oils and environmentally friendly greases supplied by TotalEnergies at key harbors. Aerospace lubricant volumes remain minimal but show promise as maintenance, repair, and overhaul (MRO) facilities in Da Nang look to capture Southeast Asian airline contracts.
By Base Stock Type: Bio-Based Alternatives Gain Environmental Traction
Mineral-oil formulations accounted for 57.25% of total consumption in 2025, as price sensitivity remains high among motorcycle users and small workshops. Nonetheless, synthetics and semi-synthetics are gaining ground in urban centers where emission standards and fleet efficiency considerations override upfront costs. The Vietnam lubricants market's demand for synthetic grades is growing, reflecting a shift toward Group III and poly-alpha-olefin blends that extend drain intervals.
Bio-based and re-refined options, although starting from a small base, post the highest 5.52% CAGR. MOTUL’s NGEN range demonstrates commercial feasibility for re-refined base oils, while domestic blenders explore palm-oil esters derived from local agricultural feedstocks. Government tax incentives tied to lower carbon footprints further enhance the value proposition for these greener options.
Geography Analysis
Ho Chi Minh City, Binh Duong, and Dong Nai collectively accounted for a significant portion of national lubricant demand in 2025, due to the dense vehicle ownership and heavy industrialization in the southern growth corridor. Continuous infrastructure upgrades, including ring-road expansions and metro line construction, support the use of off-highway lubricants for excavators and concrete pumps in the region.
Northern provinces such as Hai Phong, Bac Ninh, and Thai Binh are emerging as the fastest-growing cluster, thanks to new electronics and automotive component plants that demand high-grade metalworking and hydraulic fluids. Hai Phong’s deep-water port upgrades, coupled with PETEC’s storage-capacity expansion, streamline lubricant logistics for both export and domestic distribution.
Central Vietnam, centered on Da Nang, experiences moderate growth driven by tourism and expanding maritime services. The Mekong Delta maintains resilient demand for agricultural-equipment oils, while border provinces capture incremental volumes from rising cross-border freight with China and Cambodia. Altogether, spatial consumption patterns reflect Vietnam’s broader economic rebalancing, as the northern and central regions narrow the historical gap with the south.
Competitive Landscape
The Vietnam lubricants market is moderately consolidated. International majors utilize sophisticated brand marketing, OEM partnerships, and multi-grade synthetic portfolios to target premium segments. Domestic champions capture the national market share through their extensive state-affiliated distribution network and competitive pricing. Mid-tier players pursue white-space opportunities in specialty synthetics and EV-thermal fluids. Players are investing in localized research and development to tailor formulations for Vietnam’s hot-humid climate and variable fuel quality. Market success is increasingly dependent on technical service capabilities, inventory agility, and compliance with tightening EPR and emission regulations.
Vietnam Lubricants Industry Leaders
BP p.l.c.
Petrolimex (PLX)
Shell plc
TotalEnergies
Mekong Petrochemical JSC
- *Disclaimer: Major Players sorted in no particular order

Recent Industry Developments
- June 2025: BP p.l.c. announced plans to divest its Castrol lubricants division, valued at up to USD 10 billion, as part of a broader USD 20 billion asset-rotation strategy aimed at funding upstream projects.
- May 2025: Lubrizol appoints IMCD Group as its channel partner for lubricant and fuel-additive distribution in Vietnam, enabling broader access to specialty technology for domestic blenders.


Vietnam Lubricants Market Report Scope
By Product Type
| Automotive Engine Oil |
| Industrial Engine Oil |
| Transmission Fluids |
| Gear Oil |
| Brake Fluids |
| Hydraulic Fluids |
| Greases |
| Process Oil (Including Rubber Process Oil and White Oil) |
| Metalworking Fluids |
| Turbine Oil |
| Transformer Oil |
| Other Product Types |
By End-user Industry
| Automotive | Passenger Vehicles |
| Commercial Vehicles | |
| Two-Wheelers | |
| Marine | |
| Aerospace | |
| Heavy Equipment | Construction |
| Mining | |
| Agriculture | |
| Industrial | Power Generation |
| Metallurgy and Metalworking | |
| Textiles | |
| Oil and Gas | |
| Other End-Use Industries |
By Base Stock Type
| Mineral Oil-Based Lubricants |
| Synthetic Lubricants |
| Semi-Synthetic Lubricants |
| Bio-Based Lubricants |
| By Product Type | Automotive Engine Oil | |
| Industrial Engine Oil | ||
| Transmission Fluids | ||
| Gear Oil | ||
| Brake Fluids | ||
| Hydraulic Fluids | ||
| Greases | ||
| Process Oil (Including Rubber Process Oil and White Oil) | ||
| Metalworking Fluids | ||
| Turbine Oil | ||
| Transformer Oil | ||
| Other Product Types | ||
| By End-user Industry | Automotive | Passenger Vehicles |
| Commercial Vehicles | ||
| Two-Wheelers | ||
| Marine | ||
| Aerospace | ||
| Heavy Equipment | Construction | |
| Mining | ||
| Agriculture | ||
| Industrial | Power Generation | |
| Metallurgy and Metalworking | ||
| Textiles | ||
| Oil and Gas | ||
| Other End-Use Industries | ||
| By Base Stock Type | Mineral Oil-Based Lubricants | |
| Synthetic Lubricants | ||
| Semi-Synthetic Lubricants | ||
| Bio-Based Lubricants | ||


Key Questions Answered in the Report
How large is the Vietnam lubricants market in 2026?
The volume reached 398.56 million liters in 2026, and the Vietnam lubricants market size is projected to grow at a 4.83% CAGR through 2031.
Which segment grows fastest through 2031?
Industrial engine oil is expected to record the highest 5.22% CAGR as new power plants and factories demand long-drain, high-performance formulations.
What drives the adoption of bio-based lubricants in Vietnam?
EPR recycling mandates and environmental-protection taxes, effective from 2026, encourage blenders to introduce palm-oil-based and re-refined products that qualify for lower levies.
How is electrification affecting lubricant demand?
Electric motorcycles account for a significant portion of new two-wheeler sales, reducing engine oil volumes in large cities but leaving industrial and commercial-vehicle demand largely intact for now.
Page last updated on:


