
United States Inland Water Freight Transport Market Size and Share
Market Overview
| Study Period | 2021 - 2032 |
|---|---|
| Forecast Data Period | 2027 - 2032 |
| Base Year Market Size (2026) | USD 9.80 Billion |
| Market Size (2027) | USD 10.32 Billion |
| Market Size (2032) | USD 13.06 Billion |
| Growth Rate (2027 - 2032) | 4.84 % |
| Market Concentration | Medium |
Major Players *Disclaimer: Major Players sorted in no particular order Image © Mordor Intelligence. Reuse requires attribution under CC BY 4.0. | |
United States Inland Water Freight Transport Market Analysis by Mordor Intelligence
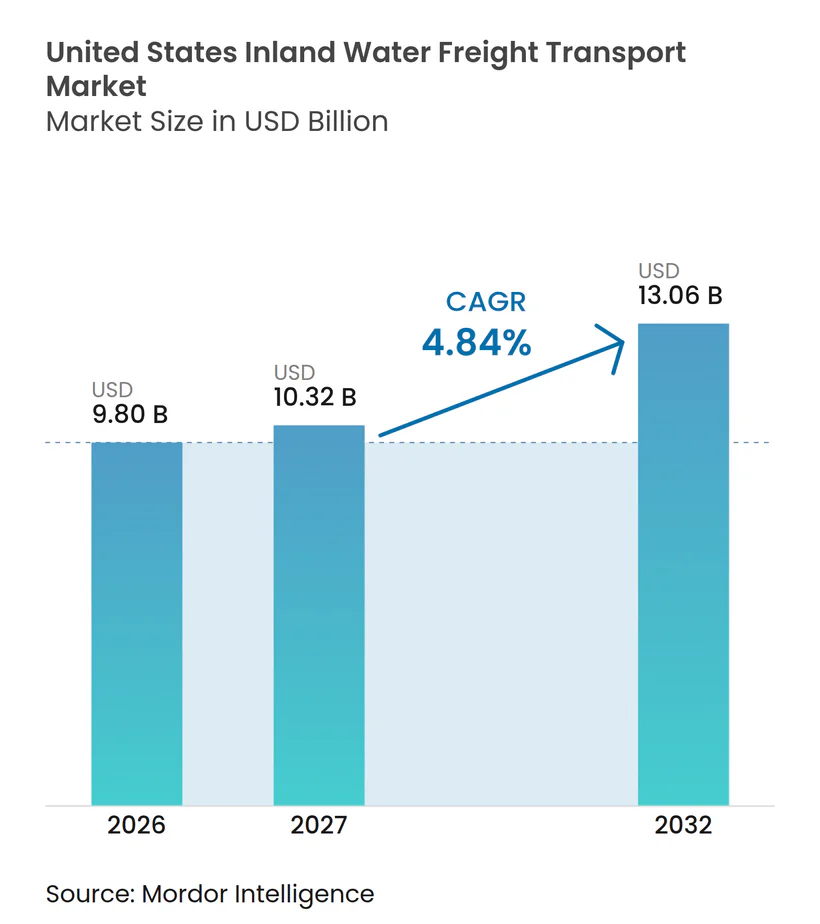
The United States inland water freight transport market size is valued at USD 9.80 billion in 2026 and is estimated to grow from USD 10.32 billion in 2027 to reach USD 13.06 billion by 2032, at a CAGR of 4.84% during the forecast period (2027-2032).
The United States inland water freight transport market benefits from the cost and fuel efficiency of barge services on the Mississippi, Ohio, and Gulf Intracoastal Waterway corridors. A barge can move 1 ton of cargo 576 miles on 1 gallon of fuel, compared with 413 miles by rail and 155 miles by truck. Grain barge volumes through the Mississippi River System increased 11% in 2025 from 2024, despite high water, ice accumulation, and lock closures.[1] Federal funding also supports capacity, including USD 200 million for inland waterway construction and USD 205 million for Cumberland River Basin navigation improvements. Aging locks and volatile water levels remain material constraints for the United States inland water freight transport market, but their effect does not remove the underlying cost advantage of waterborne bulk freight.
Key Report Takeaways
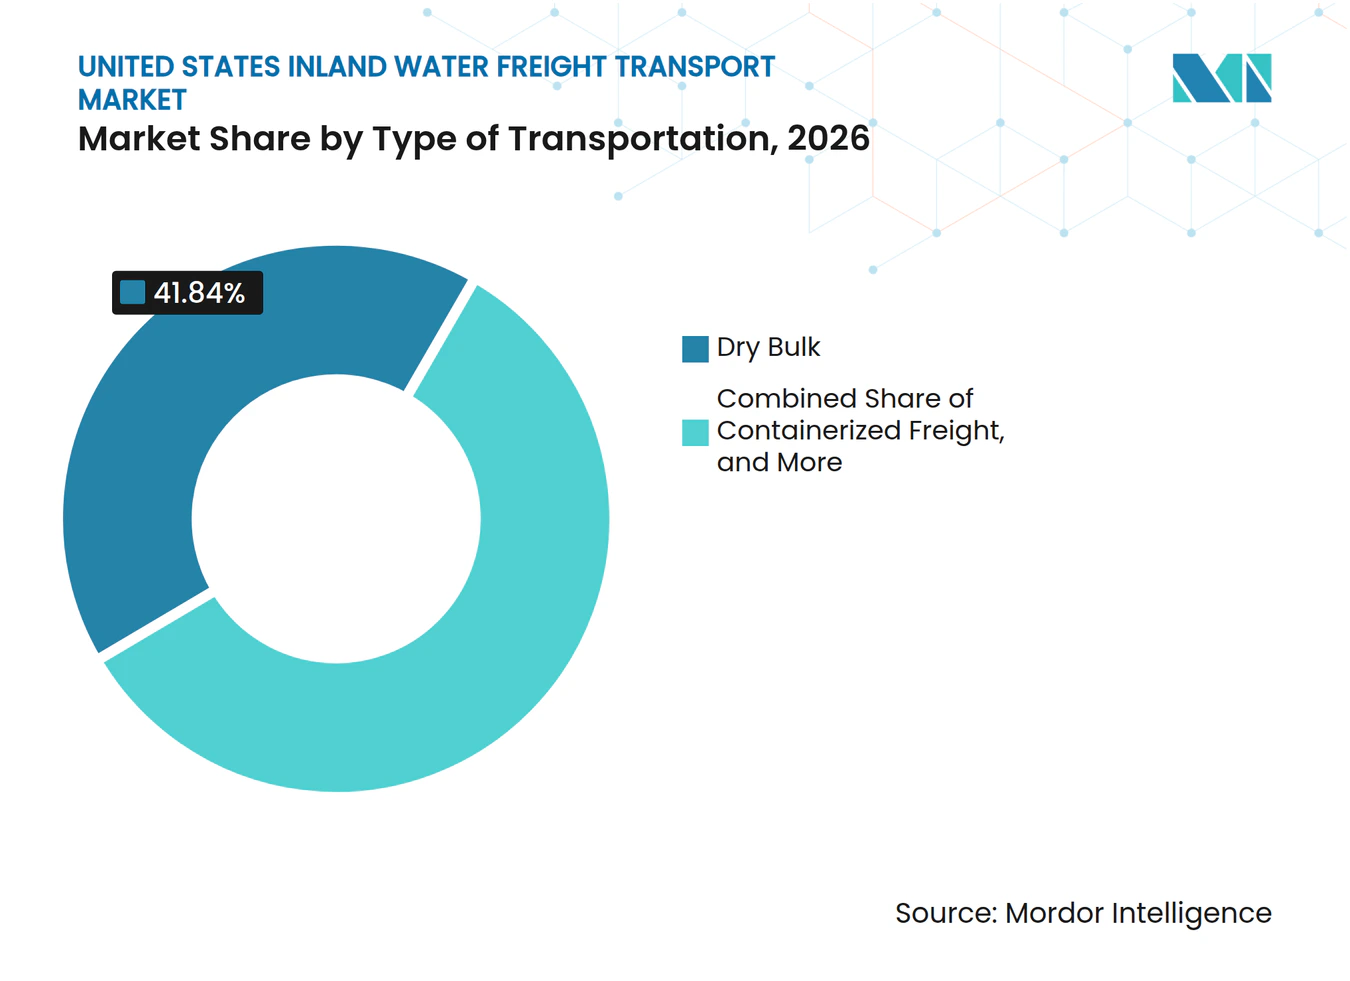
- By type of transportation, dry bulk held 41.84% of the United States inland water freight transport market share in 2026, while containerized freight is projected to register a 5.85% CAGR through 2032.
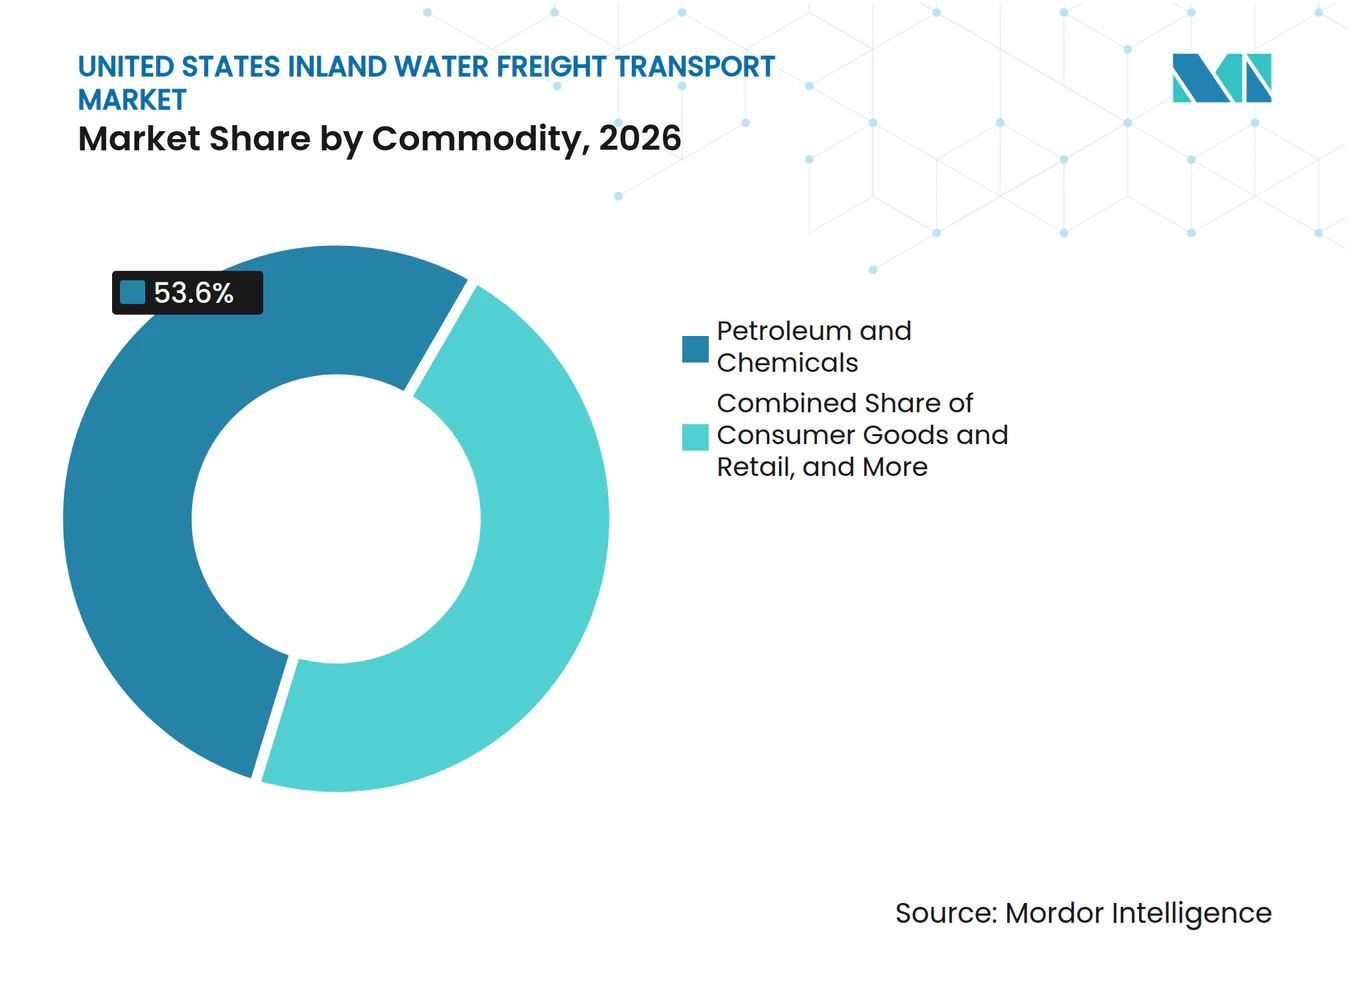
- By commodity or application, petroleum and chemicals accounted for 53.55% of the United States inland water freight transport market size in 2026, while consumer goods and retail are projected to expand at a 6.16% CAGR through 2032.
- By geography, the Midwest held 34.22% of revenue in 2026 within the United States inland water freight transport market, while the Southeast is forecast to register a 5.43% CAGR through 2032.
Note: Market numbers in this report are based on Mordor Intelligence's proprietary estimation framework, which combines nine months of actuals with Q4 projections for base year 2026.
Market Trends and Insights
Drivers Impact Analysis of United States Inland Water Freight Transport Market*
| Driver | (~) % Impact on CAGR Forecast | Geographic Relevance | Impact Timeline |
|---|---|---|---|
| Cost and Fuel Efficiency Versus Road and Rail | +1.3% | National, all major river corridors | Short term (≤ 2 years) |
| Agricultural Export Flows Through the Mississippi River System | +1.1% | Midwest and South, with spillover to Gulf Coast export terminals | Short term (≤ 2 years) |
| Federal Lock, Dam and Inland Navigation Modernization Funding | +0.9% | National, with priority on the Ohio River, Tennessee River, and Illinois Waterway | Medium term (2-4 years) |
| Renewable Diesel, Biofuel Feedstock and Low-Carbon Bulk Flows | +0.6% | Midwest, Gulf Coast, and Mid-South | Medium term (2-4 years) |
| Underutilized Container-on-Barge and River-Port Intermodal Capacity | +0.4% | Gulf Coast, Southeast, and Great Lakes | Long term (≥ 4 years) |
| Predictive Navigation and Cargo Visibility Adoption | +0.2% | National, concentrated on the Lower Mississippi and Ohio systems | Medium term (2-4 years) |
| Source: Mordor Intelligence | |||
Cost and Fuel Efficiency Versus Road and Rail
Barge freight costs USD 0.01 per ton-mile, compared with USD 0.04 by rail and USD 0.12 by diesel truck. This gap gives the United States inland water freight transport market a durable role in moving heavy, lower-value cargo over long distances. A 15-barge tow can carry 875,000 bushels, which equals 216 rail cars or 1,000 trucks. When barge capacity tightens, competing road and rail services have less room to adjust prices without losing traffic. Barge transport also produces 29% fewer nitrogen oxide emissions per ton-mile than rail and 36% fewer than trucks. This combination of lower fuel use, lower transport cost, and lower emissions supports repeat demand from bulk commodity shippers.
Agricultural Export Flows Through the Mississippi River System
Grain barge volumes on the Mississippi River System rose 11% in 2025 and reached their highest annual level since 2022. The increase occurred despite flooding, high water, ice accumulation, and lock closures that interrupted individual shipping periods. USDA estimated corn exports to rise 15% and wheat exports to rise 9% in FY 2026. Barges carry nearly half of United States grain headed for export, including 48% of corn and soybeans. This makes river access central to agricultural export logistics across the upper Mississippi, Ohio, and Illinois systems. Reliability matters because draft restrictions can weaken the ability of United States exporters to serve overseas buyers consistently.
Federal Lock, Dam and Inland Navigation Modernization Funding
The FY 2025 Work Plan allocated USD 200 million to inland waterway construction, including USD 122.9 million for T.J. O'Brien Lock, USD 44 million for Montgomery Lock, and USD 32.19 million for Chickamauga Lock. The USACE Nashville District also received USD 205 million for lock operations, dam safety, and infrastructure improvements in the Cumberland River Basin. The Infrastructure Investment and Jobs Act also committed USD 4 billion to USACE operations and maintenance. Each completed project can reduce delays and support larger tow configurations without requiring operators to add vessels. These improvements can raise effective capacity on routes that already serve established freight demand.
Renewable Diesel, Biofuel Feedstock and Low-Carbon Bulk Flows
Soybean crush capacity linked to renewable diesel and sustainable aviation fuel is creating additional waterway freight demand. Plants located near inland waterways can direct oilseed movements to barge-served terminals and add density to existing river loading networks. New York City delivered its first barge shipment of renewable diesel, totaling 336,000 gallons, to the Staten Island Ferry fleet in 2025.[2] The shipment marked the start of the ferry fleet's transition to a cleaner fuel supply by barge. Low-carbon fuel policies are also encouraging feedstock processing in barge-accessible Midwestern and Gulf Coast locations. These flows broaden the cargo base for the United States inland water freight transport market beyond conventional grain exports.
Restraints Impact Analysis of United States Inland Water Freight Transport Market*
| Restraint | (~) % Impact on CAGR Forecast | Geographic Relevance | Impact Timeline |
|---|---|---|---|
| Aging Locks, Dams and Towboat Fleets | -1.1% | National, highest severity on the Mississippi, Ohio, and Tennessee Rivers | Short term (≤ 2 years) |
| Drought, Flooding and Draft-Restriction Volatility | -0.8% | Lower Mississippi River, Ohio River, and Columbia-Snake System | Short term (≤ 2 years) |
| Schedule Uncertainty from Lock Closures and Maintenance Delays | -0.6% | National, concentrated on upper Mississippi and Ohio River corridors | Medium term (2-4 years) |
| High Capital Cost of Low-Emission Propulsion Retrofits | -0.3% | National, with pressure concentrated among Gulf Coast and Midwest operators | Long term (≥ 4 years) |
| Source: Mordor Intelligence | |||
Aging Locks, Dams and Towboat Fleets
According to ASCE's 2025 Infrastructure Report Card, 80% of inland waterway locks and dams exceeded their 50-year design life.[3] ASCE also identified a USD 13 billion funding gap for inland waterways and ports over 2024-2033. Older locks extend voyage times, while aging towboats require more maintenance and reduce available operating time. Together, these constraints limit throughput across the United States inland water freight transport market.
Drought, Flooding and Draft-Restriction Volatility
Water-level extremes can reduce usable capacity across major inland corridors. In September 2025, low water on the lower Mississippi required southbound traffic to observe 10.5 ft draft limits and tow widths of no more than 6 barges.[4] The Memphis gauge reached negative 5.5 ft in September 2025. High water and flooding near St. Louis also delayed the reopening of key locks during spring 2025, when corn export demand was rising. Drought can constrain the release of water from tributary reservoirs, which limits the scope for operational responses to low river levels. These interruptions raise scheduling uncertainty for cargo owners and restrict the volume carried by each tow.
*Our forecasts treat driver/restraint impacts as directional, not additive. The impact forecasts reflect baseline growth, mix effects, and variable interactions.
United States Inland Water Freight Transport Market Segment Analysis
By Type Of Transportation:
Dry Bulk Leads While Containerized Freight Gains SpeedDry bulk accounted for 41.84% of the United States inland water freight transport market size in 2026. Grain, coal, fertilizer, sand, and gravel are well suited to open hopper barges because they move in large volumes and have relatively low value per unit of weight. The segment is concentrated in the Midwest and Mid-South, where commodity production and river access are closely aligned. Barge service remains difficult to replace for high-tonnage cargo moving several hundred miles. This operating fit gives dry bulk a stable role in the United States inland water freight transport market.
Containerized freight is forecast to register a 5.85% CAGR from 2027 to 2032 as ports and operators develop container-on-barge networks. These services can connect inland shippers with ocean terminals and reduce dependence on highway movements where cargo can be consolidated, handled in containers, and moved through suitable river ports. The other category serves smaller flows such as general cargo and heavy-lift goods, while Ports of Indiana reported a 40% expansion in steel barge-handling capacity at Jeffersonville in December 2025.


By Commodity/Application:
Petroleum and Chemicals Anchor Volume as Consumer Goods Reshape DemandPetroleum and chemicals represented 53.55% of the United States inland water freight transport market share in 2026. Gulf Coast refineries and the Gulf Intracoastal Waterway support this position through established tank-barge demand. Refinery activity sustained inland tank barge utilization above 90% for much of 2025. This route network gives liquid cargo operators meaningful exposure to refined products and petrochemical distribution. The category remains central to operator utilization and pricing.
Consumer goods and retail are projected to register a 6.16% CAGR from 2027 to 2032. Its growth reflects wider use of container-on-barge services for packaged goods that previously moved by truck or intermodal rail. Agriculture and food remained the second-largest commodity group, supported by USD 170.5 billion in United States agricultural exports for FY 2025. Metallurgy and mining, construction, and energy provide recurring volumes, although activity in these groups depends on industrial capital spending. Forest products, specialty chemicals, and waste-derived materials add route-specific demand across the United States inland water freight transport industry.

Geography Analysis
The Midwest held 34.22% of revenue in 2026, giving it the leading position in the United States inland water freight transport market. Grain elevators, ethanol plants, fertilizer terminals, and steel facilities create dense freight demand across the Ohio, upper Mississippi, and Illinois river corridors. The region also links agricultural origin points to Gulf export terminals. This combination supports regular movements of dry bulk and liquid bulk cargo.
The Southeast is forecast to register a 5.43% CAGR from 2027 to 2032. In March 2025, a USD 12.9 million improvement project was announced for Yellow Creek State Inland Port, including USD 9 million in funding from the Appalachian Regional Commission, and is intended to improve barge, rail, and truck connections on the Tennessee-Tombigbee system. The project strengthens a route that links Gulf Coast access with markets in Alabama and Mississippi. Tennessee also established a USD 33 million public-private partnership with Ingram Marine Group for Ashland City River Port in May 2025. The port is planned as a dry-goods gateway for central Tennessee and is intended to reduce reliance on truck corridors. These projects support cargo transfers between water, rail, and road services in the Southeast.
The Northeast, Southwest, and West account for the remaining regional activity in the United States inland water freight transport market. The Northeast handles bulk petroleum and general cargo. New York City's 2025 renewable diesel barge delivery showed the role of waterborne supply in cleaner marine fuel logistics. The Columbia-Snake River system in the West recorded a 137% year-over-year increase in wheat movements in the first quarter of 2025 following the end of an extended lock closure. The Southwest contributes Gulf Intracoastal Waterway traffic tied to petrochemicals and related liquid cargoes.
Competitive Landscape
Market Concentration
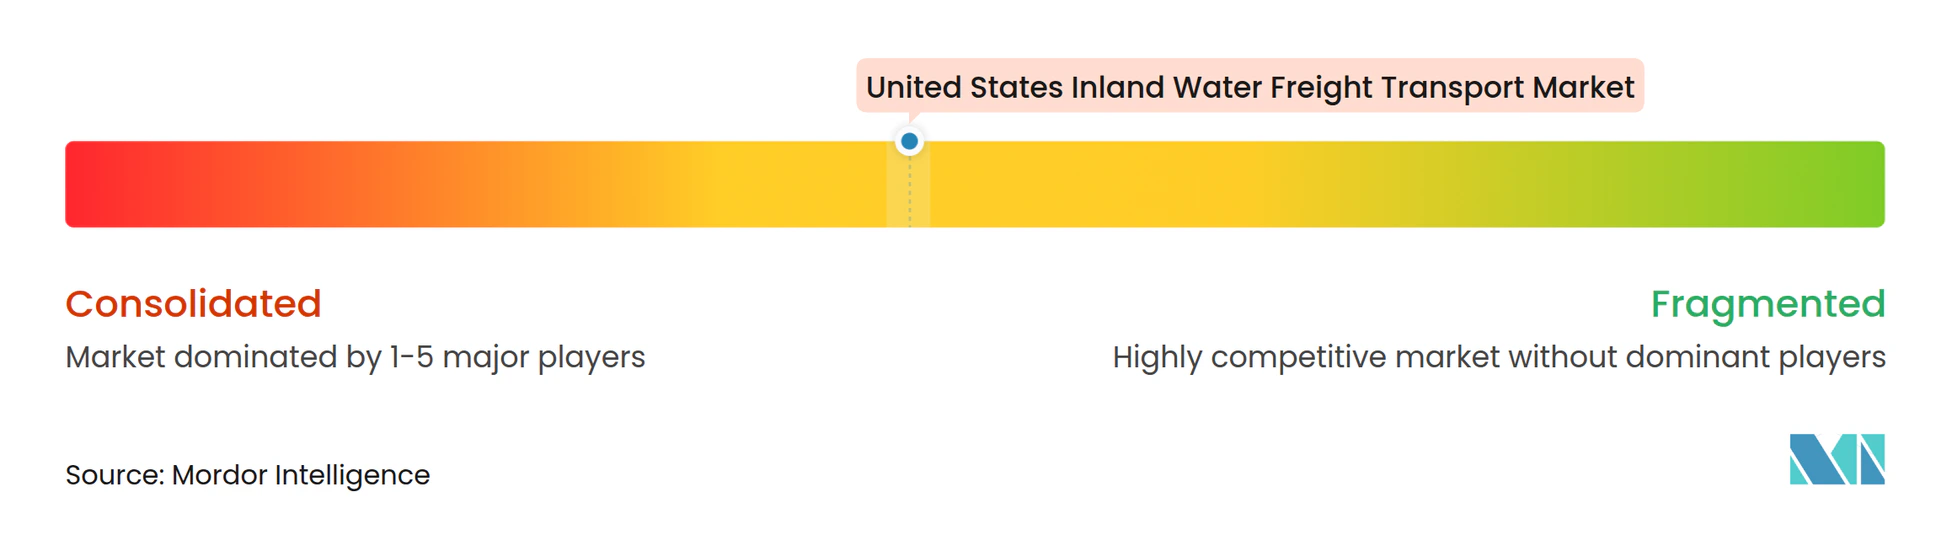
The United States inland water freight transport market is moderately concentrated among leading liquid-cargo operators and regional and specialist providers. Large tank barge operators influence pricing because high newbuild costs have limited additions to the specialized vessel supply. Kirby Corporation operates more than 1,100 inland barges and reported USD 354.6 million in net earnings for FY 2025. The company also reported USD 1.94 billion in marine transportation revenue for FY 2025. Its planned 2026 capital spending of USD 220 million to USD 260 million includes up to USD 65 million in growth capital.
Consolidation is changing ownership across the middle tier of the United States inland water freight transport market. Hines Furlong Line announced an agreement in December 2025 to acquire Campbell Transportation Company's River Division. On completion, Hines Furlong Line will own or manage 870 hopper and tank barges, 64 inland towboats, 1,000 fleeting spaces, and 2 shipyards. These transactions can give larger operators wider route coverage and more assets to allocate among customer contracts. Smaller companies continue to compete through local relationships, specialized services, and proximity to particular waterways.
Operational specialization also shapes competitive choices in the United States inland water freight transport market. USCG operating requirements and USACE lock monitoring create a continuing compliance burden for all operators. These requirements raise the capital and operating capability needed to enter or expand in established corridors. They also favor companies that can maintain vessels, crews, safety processes, and customer service across a broad operating network.
United States Inland Water Freight Transport Industry Leaders
-
American Commercial Barge Line LLC
-
Ingram Barge Company
-
Kirby Corporation
-
Campbell Transportation Company, Inc.
-
Marquette Transportation Company, LLC
- *Disclaimer: Major Players sorted in no particular order
United States Inland Water Freight Transport Market Companies Covered in this Report
- American Commercial Barge Line LLC
- Ingram Barge Company
- Kirby Corporation
- Campbell Transportation Company, Inc.
- Marquette Transportation Company, LLC
- Canal Barge Company, Inc.
- Florida Marine Transporters, LLC
- Genesis Energy, L.P.
- Magnolia Marine Transport Company
- Tidewater Transportation and Terminals, LLC
- Savage Inland Marine LLC
- Blessey Marine Services, Inc.
- Turn Services, LLC
- Crounse Corporation
- Southern Devall
- LeBeouf Brothers Towing, LLC
- Golding Barge Line, Inc.
- Chem Carriers, LLC
- Central Boat Rentals, Inc.
- Inland Marine Service, Inc.
Recent Industry Developments in United States Inland Water Freight Transport Market
- September 2026: Heartland Fabrication, LLC announced a USD 60 million phased expansion of its Brownsville, Pennsylvania shipyard on the Monongahela River, designed to increase annual hopper barge production capacity from 180 to as many as 280 units once fully complete in 2028. The program adds four new buildings, automated structural and robotic welding lines, and river infrastructure improvements, driven by an aging United States inland hopper barge fleet requiring an estimated 800 to 1,000 retirements annually over the next five years.
- July 2026: The Mid TN Riverport, part of the USD 33 million public-private partnership between TDOT and Ingram Marine Group on the Cumberland River at Ashland City, Tennessee, has completed pier construction and is expected to open in December 2026. The 40-acre facility offers 400 ft of river frontage and 40,000 ft² of indoor storage, designed for breakbulk and bulk cargoes, including wire rod, rebar, aluminum, and cement.
- May 2026: American Commercial Barge Line (ACBL) entered into an agreement with the Port of Houston Authority to lease and develop 28 acres of submerged land along the Houston Ship Channel for dedicated barge fleeting operations, with development plans including new mooring structures and dredging to expand Gulf Coast liquid and petrochemical logistics capacity.
- May 2026: Kirby Corporation acquired 23 inland barges and 3 high-horsepower towboats for USD 95.8 million, expanding its active inland fleet to 1,134 tank barges. The transaction, substantially completed in Q1 2026, supported Kirby's low-90% utilization target for the full year amid limited industry-wide newbuild activity.
United States Inland Water Freight Transport Market Report Scope
Segmentation Overview
| Liquid Bulk |
| Dry Bulk |
| Containerized Freight |
| Others |
| Agriculture and Food |
| Petroleum and Chemicals |
| Metallurgy and Mining |
| Construction |
| Energy |
| Consumer Goods and Retail |
| Others |
| Northeast |
| Southwest |
| West |
| Southeast |
| Midwest |
| By Type of Transportation | Liquid Bulk |
| Dry Bulk | |
| Containerized Freight | |
| Others | |
| By Commodity / Application | Agriculture and Food |
| Petroleum and Chemicals | |
| Metallurgy and Mining | |
| Construction | |
| Energy | |
| Consumer Goods and Retail | |
| Others | |
| By Geography | Northeast |
| Southwest | |
| West | |
| Southeast | |
| Midwest |
Key Questions Answered in the Report
What is the forecast growth rate for United States inland water freight transport?
The sector is projected to expand at a 4.84% CAGR from 2027 to 2032, rising from USD 9.8 billion in 2026 to USD 13.06 billion by 2032. This outlook reflects the continuing cost advantage of barge services for bulk cargo.
Which freight type leads United States inland water freight transport?
Dry bulk leads with a 41.84% revenue share in 2026. Grain, coal, fertilizer, sand, and gravel support the segment because they are suitable for high-volume barge movements.
Which cargo category is growing the fastest on United States inland waterways?
Consumer goods and retail are forecast to register a 6.16% CAGR from 2027 to 2032. Growth is linked to wider use of container-on-barge services for packaged goods distribution.
Why do shippers use barges instead of rail or trucks?
Barge freight costs USD 0.01 per ton-mile, compared with USD 0.04 by rail and USD 0.12 by diesel truck. A 15-barge tow can carry the equivalent of 216 rail cars or 1,000 trucks.
Which United States region has the largest inland water freight base?
The Midwest holds the largest share at 34.22% in 2026. Its river corridors connect grain elevators, ethanol plants, fertilizer terminals, and steel facilities with domestic and export destinations.
What are the main operating risks for inland waterway carriers?
Aging locks and dams, lock delays, drought, flooding, and draft restrictions can reduce capacity and disrupt shipment schedules. In September 2025, low water on the lower Mississippi limited southbound draft to 10.5 ft and tow width to 6 barges.