Market Overview
| Study Period | 2021 - 2031 |
|---|---|
| Forecast Data Period | 2026 - 2031 |
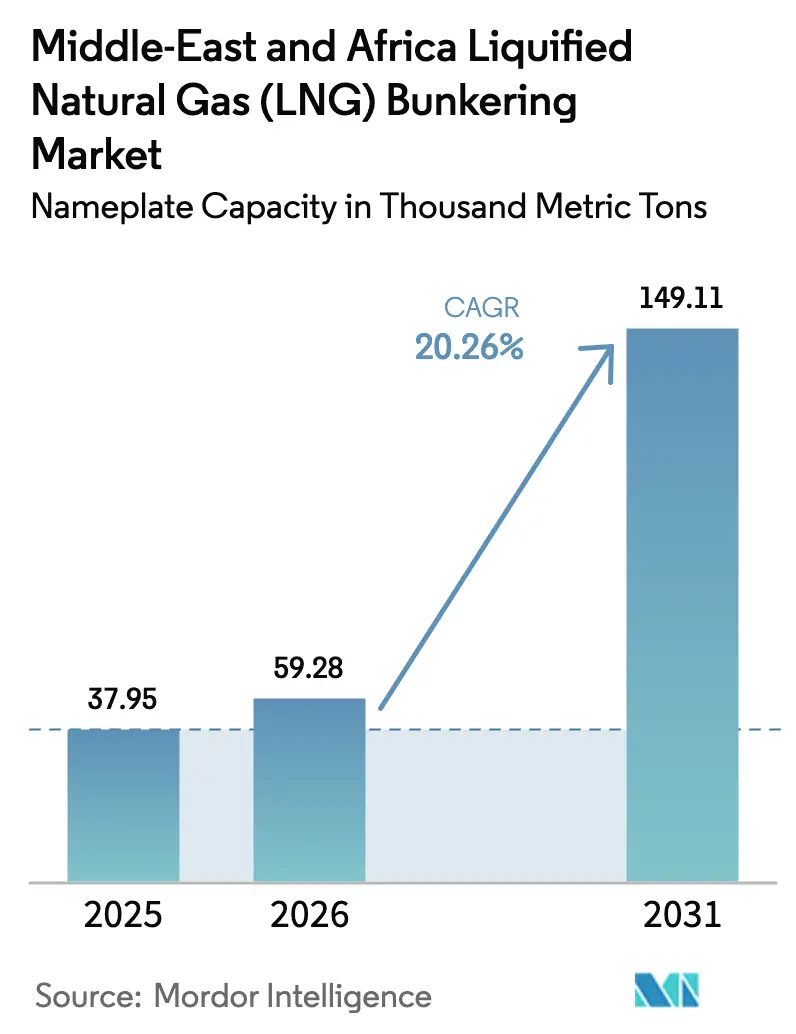
| Base Year Market Size (2025) | 37.95 Thousand metric tons |
| Market Volume (2026) | 59.28 Thousand metric tons |
| Market Volume (2031) | 149.11 Thousand metric tons |
| Growth Rate (2026 - 2031) | 20.26% CAGR |
| Market Concentration | Medium |
Major Players *Disclaimer: Major Players sorted in no particular order Image © Mordor Intelligence. Reuse requires attribution under CC BY 4.0. | |
Middle-East And Africa Liquified Natural Gas (LNG) Bunkering Market Analysis by Mordor Intelligence
The Middle-East And Africa Liquified Natural Gas Bunkering Market size in terms of nameplate capacity is expected to grow from 37.95 Thousand metric tons in 2025 to 59.28 Thousand metric tons in 2026 and is forecast to reach 149.11 Thousand metric tons by 2031 at 20.26% CAGR over 2026-2031.
This growth rests on progressively tighter IMO emissions rules, surging Middle-East liquefaction capacity, and a security-driven resurgence of Cape-route traffic that together drive unprecedented demand at Gulf and African ports. The IMO 2020 sulphur cap and its 2023 greenhouse-gas strategy have made LNG the most practical compliance option for shipowners unwilling to retrofit scrubbers or pay a premium for bio-methanol. Qatar’s North Field expansion alone will lift national nameplate liquefaction output to 142 million tpa by 2030, ensuring abundant supply and muting price volatility for regional bunker hubs. Vessel operators also view LNG bunkering as a hedge against the EU Emissions Trading System, whose inclusion of maritime emissions in 2024 materially raised the cost of high-sulphur fuels on Europe-bound routes. Finally, the rise in Red Sea security threats has rerouted Asia-Europe traffic around the Cape of Good Hope, raising African port calls and expanding the LNG bunkering market footprint at Durban, Mombasa, and Richards Bay.
Key Report Takeaways
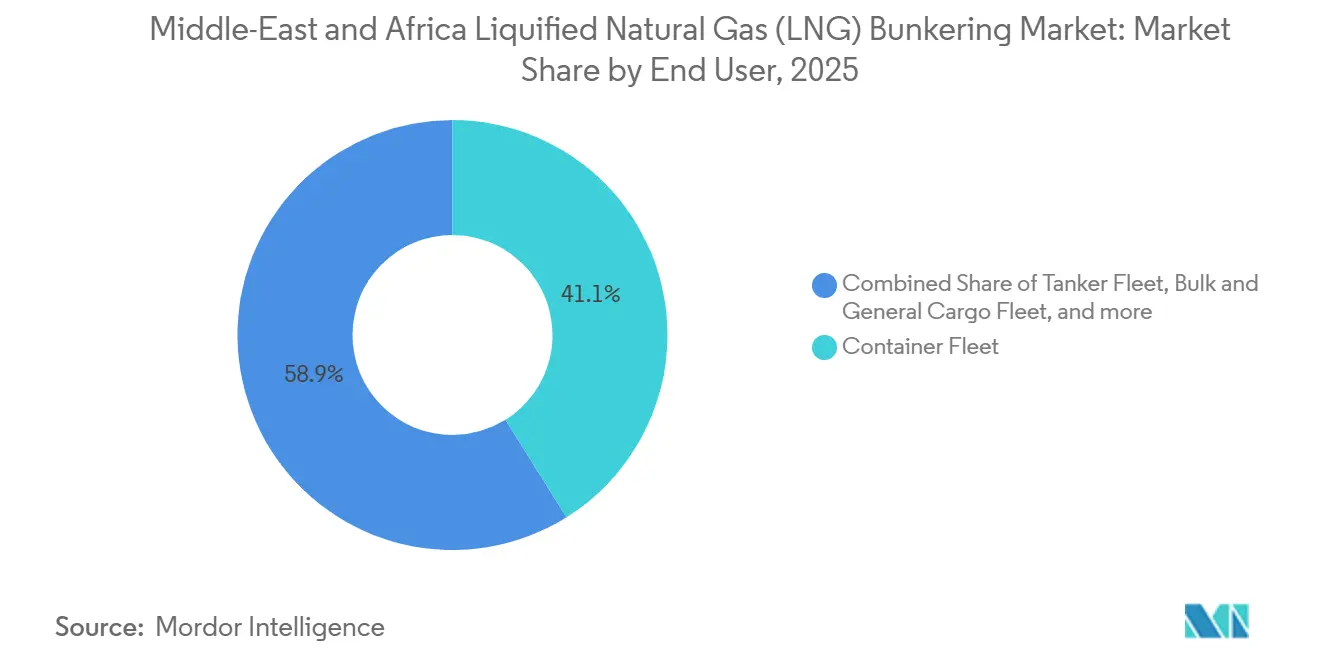
- By end user, the container fleet led with a 41.1% share in 2025, and it is forecast to expand at a 23.4% CAGR through 2031.
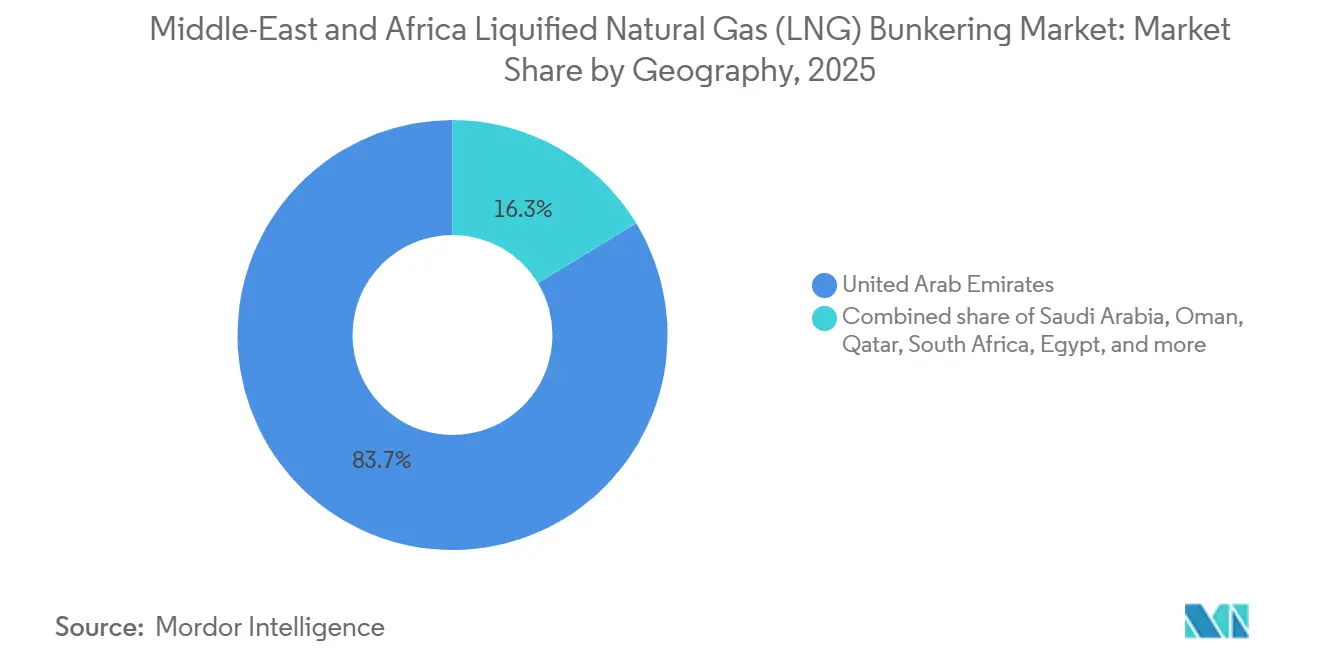
- By geography, the United Arab Emirates commanded 83.7% capacity in 2025, while South Africa is projected to register the fastest growth at a 24.7% CAGR through 2031.
Note: Market size and forecast figures in this report are generated using Mordor Intelligence’s proprietary estimation framework, updated with the latest available data and insights as of January 2026.
Middle-East And Africa Liquified Natural Gas (LNG) Bunkering Market Trends and Insights
Drivers Impact Analysis*
| Driver | (~) % Impact on CAGR Forecast | Geographic Relevance | Impact Timeline |
|---|---|---|---|
| Stricter IMO sulphur and GHG mandates accelerate LNG adoption | 4.5% | Global, with early enforcement in EU and North America | Short term (≤ 2 years) |
| Mega Middle-East liquefaction additions lower bunker prices and boost supply | 3.8% | Middle East core, spillover to Africa and South Asia | Medium term (2-4 years) |
| Regional LNG bunkering hubs (Sohar, Fujairah, Durban) backed by incentives | 3.2% | UAE, Oman, South Africa | Medium term (2-4 years) |
| Security-driven Cape route shift raises demand at African ports | 2.1% | South Africa, Kenya, Egypt | Short term (≤ 2 years) |
| ESG-driven preference for low-carbon LNG (CCUS, e-drive trains) | 2.5% | Global, led by EU and Middle East | Long term (≥ 4 years) |
| Modular small-scale FSRU and LNGBV roll-outs enable secondary-port supply | 1.9% | Africa and secondary Middle East ports | Medium term (2-4 years) |
| Source: Mordor Intelligence | |||
Stricter IMO Sulphur and GHG Mandates Accelerate LNG Adoption
The IMO reduced the global sulphur limit in marine fuels from 3.5% to 0.5% in 2020, forcing operators to choose between costly scrubbers, low-sulphur fuel oil, or LNG. By 2025, more than 600 ships were running on LNG, and the IMO 2023 greenhouse-gas strategy, targeting net-zero shipping by 2050, cemented LNG as the most accessible compliance pathway until ammonia or hydrogen supply chains mature. The finalized life-cycle assessment credits LNG with a 20% lower well-to-wake carbon intensity versus heavy fuel oil, driving CMA CGM, MSC, and others to place large dual-fuel orders. The EU placed maritime emissions under its ETS in 2024, and prices climbed to EUR 85 per t, making high-sulphur fuels uneconomic on long Europe-bound voyages. Consequently, shipowners increasingly lock in LNG bunkering contracts to mitigate their carbon cost exposure.
Mega Middle-East Liquefaction Additions Lower Bunker Prices and Boost Supply
Qatar’s North Field East, South, and West phases will collectively add 88 billion m³ per year of liquefaction by 2027, lifting the nation to 142 million tpa and reinforcing its leadership in the LNG bunkering market. Saudi Arabia’s planned Ras Al-Khair terminal and the UAE’s Ruwais project together contribute a further 20 million tpa by 2029. Oversupply has already compressed spot LNG prices; the Platts JKM averaged USD 11.20 per MMBtu in H1 2025 against USD 17.50 in 2024, undercutting VLSFO on a per-voyage basis. Hub operators such as ADNOC and Shell now offer multi-year fixed-price bunker deals, reducing owners’ fuel-cost uncertainty and encouraging dual-fuel fleet expansion.
Regional LNG Bunkering Hubs Backed by Incentives
Fujairah delivered more than 700,000 m³ of LNG bunker fuel in 2025, ranking third worldwide after Singapore and Rotterdam.[1]Fujairah Port Authority statistics, fujairahport.ae The port authority earmarked USD 200 million for extra cryogenic storage and jetties, enabling simultaneous refueling of ultra-large container ships. Sohar Marsa LNG facility entered service in 2024 with a 1 million tpa nameplate and enjoys a 10-year tax holiday that cuts breakeven by 18%.[2]Oman LNG, omanlng.co.om South Africa's Transnet launched front-end engineering in 2025 for Durban and Richards Bay, targeting a combined 300,000 t throughput by 2028. Incentive programs reduce capital burden and accelerate facility completion, broadening the LNG bunkering market coverage across secondary ports.
ESG-Driven Preference for Low-Carbon LNG
Institutional investors and cargo owners embed carbon metrics into charter contracts, rewarding operators who use certified low-carbon LNG. TotalEnergies began offering carbon-neutral LNG in 2024, adding a 15% price premium via offsets and CCS credits. Shell’s Quest project captures 1.4 million t of CO₂ per year and underpins low-carbon supply contracts for marine customers. QatarEnergy plans 11 million tpa of CO₂ capture by 2030, lowering its life-cycle emissions and attracting forward bunker commitments. Engine makers respond with methane-slip reductions, evidenced by Wärtsilä’s 31DF at sub-3 g/kWh in 2025 sea trials.[3]Wärtsilä press release, wartsila.com These advances strengthen LNG’s green credentials amid tightening IMO methane rules expected in 2027.
Restraints Impact Analysis*
| Restraint | (~) % Impact on CAGR Forecast | Geographic Relevance | Impact Timeline |
|---|---|---|---|
| High capex for cryogenic storage and bunkering assets | -2.3% | Africa and secondary Middle East ports | Short term (≤ 2 years) |
| LNG price volatility versus VLSFO undermines cost savings | -1.8% | Global, with acute impact in Asia-Pacific and Africa | Short term (≤ 2 years) |
| Incoming methane-slip rules may erode LNG's green advantage | -1.2% | EU and North America, spillover to global fleet | Medium term (2-4 years) |
| Skilled-labor shortage for LNG handling in several African ports | -0.9% | Sub-Saharan Africa | Medium term (2-4 years) |
| Source: Mordor Intelligence | |||
High Capex for Cryogenic Storage and Bunkering Assets
A shore-based LNG bunker terminal typically costs USD 100 million to USD 150 million, covering tanks, vaporization, and safety systems, which deters investment at ports with unclear demand.[4]World Bank, “Port Infra Cost Benchmarking,” worldbank.org A dedicated LNG bunkering vessel ranges from USD 50 million to USD 80 million, and financiers often insist on offtake commitments for 70% capacity before funding. Durban’s 2025 feasibility study projected an extra 18 months for land acquisition and permitting, delaying revenue and inflating interest costs. Lagos postponed its bunker project after failing to secure 10-year customer contracts. Smaller East-African ports also lack throughput to justify standalone terminals, reinforcing the chicken-and-egg dilemma that slows the LNG bunkering market rollout.
LNG Price Volatility Versus VLSFO Undermines Cost Savings
LNG spot prices track regional gas markets and heating demand, resulting in swings that exceed those of oil-linked VLSFO. JKM fell 36% from USD 17.50 per MMBtu in early 2024 to USD 11.20 in mid-2025, compressing cost advantages. Bulk and tanker owners operating on thin margins hesitate to lock into long LNG contracts while VLSFO remains available at relatively steady USD 580 per t. The absence of a deep LNG bunker derivatives market further limits hedging, and fuel-cost adjustment clauses in charters transfer risk to cargo owners, who may then prefer conventional fuel vessels.
*Our forecasts treat driver/restraint impacts as directional, not additive. The impact forecasts reflect baseline growth, mix effects, and variable interactions.
Segment Analysis
By End User: Container Fleet Dominates Amid Liner Commitment to Dual-Fuel Newbuilds
Container vessels held 41.1% of demand in 2025, while the tanker and bulk carrier categories lag. Within the container segment, CMA CGM’s 22-ship LNG program and MSC’s retrofit plan underscore long-term confidence in the fuel. This segment commands the highest LNG bunkering market share because liner operators can pass bunker costs through in freight rates and face strict ESG requirements from cargo owners. The container fleet is projected to grow at 23.4% annually to 2031, making it the largest contributor to the LNG bunkering market size through the forecast period.
Tankers and bulkers remain cautious. DHT Holdings and Euronav ordered LNG-ready VLCCs in 2024, yet widespread uptake is limited by freight-rate volatility and fragmented ownership. Ferries and OSVs trail even further; regional voyages rarely recoup the capital required for cryogenic tanks, though Norway’s Fjord Line demonstrates technical feasibility with its LNG-powered ferry delivered in 2024. Cruise operators such as Carnival already run 11 LNG-powered ships and could accelerate adoption once more ports add bunker capability. Overall, the LNG bunkering industry remains container-centric, but progressive infrastructure roll-outs and carbon-pricing signals may broaden participation across vessel classes later in the decade.


Geography Analysis
The UAE accounted for 83.7% of bunkering capacity in 2025 and is expected to expand at 22.1% annually through 2031, anchored by Fujairah’s strategic Strait-of-Hormuz location and ADNOC’s integrated supply chain. Fujairah handled over 700,000 m³ in 2025 and benefits from proximity to Qatar’s Ras Laffan, ensuring a steady supply regardless of spot price swings. Saudi Arabia plans to position Jeddah as a Red Sea hub with USD 120 million in cryogenic investments targeting 2027 service. Oman’s Sohar Marsa LNG commenced operations in 2024 at 1 million tpa and may be complemented by a Duqm facility, widening the LNG bunkering market footprint along the Indian Ocean corridor.
South Africa emerged as the African anchor as Cape-route traffic surged. Durban recorded a 40% rise in container calls in Q1 2025, and bunker sales jumped 28%, validating Transnet’s USD 150 million infrastructure plan. Richards Bay is evaluating an FSRU to serve both industry and marine clients by 2028. Egypt’s Suez Canal Authority accelerated LNG bunker plans at Ain Sokhna and Port Said to capture demand once Red Sea security improves. Nigeria shelved Lagos Port infrastructure due to customer shortfalls, yet the Train 7 liquefaction expansion could revive interest if domestic pricing becomes competitive. Kenya’s Mombasa is eyeing a 200,000 tpa FSRU for 2027, underlining how security-driven route changes have dispersed the LNG bunkering market across sub-Saharan Africa.
Competitive Landscape
The value chain remains moderately concentrated. Upstream supply is in the hands of national oil companies, QatarEnergy, ADNOC, and Saudi Aramco, whose combined liquefaction expansions will exceed 180 million tpa by 2030. Midstream logistics is dominated by specialized players such as Nakilat, BW Group, and Mitsui O.S.K. Lines, each operating purpose-built LNG carriers and bunkering vessels. TotalEnergies acquired 25% of Sohar Marsa in 2025 and ordered two 18,000 m³ LNGBVs to secure downstream delivery margins. ADNOC mirrors this vertical integration at Fujairah, pairing Ruwais feedstock with its own LNGBV fleet.
Technology competition hinges on methane-slip reduction. Wärtsilä reported sub-3 g/kWh emissions in 2025 31DF trials, while MAN Energy Solutions delivered high-pressure gas injection systems that halve slip compared to previous designs. Barriers to entry remain steep: shore terminals cost up to USD 150 million, and an LNGBV costs as much as USD 80 million. Yet government co-financing, such as Oman’s tax holiday, mitigates capital hurdles for secondary players. White space persists in sub-Saharan Africa, where fixed infrastructure is limited, and floating solutions can leapfrog traditional terminal development, fostering new entrants in the LNG bunkering market.
Middle-East And Africa Liquified Natural Gas (LNG) Bunkering Industry Leaders
QatarEnergy
Royal Dutch Shell plc
TotalEnergies SE
ADNOC Logistics & Services plc
DNG Energy
- *Disclaimer: Major Players sorted in no particular order


Recent Industry Developments
- November 2025: AD Ports Group, a terminal operator based in the UAE, has inked two long-term agreements with Nimex Terminals, a subsidiary of the global trading entity Nimex Petroleum Group.
- September 2025: Peninsula, a marine fuel supplier, has broadened its physical supply operations to Algoa Bay, South Africa. Partnering with Linsen Nambi, a South African logistics service provider and bunker barge operator, Peninsula aims to leverage local expertise for its services in Algoa Bay.
- May 2025: TotalEnergies and OQ Exploration and Production (OQEP) broke ground on the USD 1.6 billion Marsa LNG plant. Drawing from the Mabrouk North-East field in onshore Block 10, the Marsa LNG project will harness an upstream gas production of 150 million cubic feet per day. With Marsa holding a 33.19 percent stake in the field, the LNG plant enjoys a consistent and reliable feedstock supply.
- January 2025: Monjasa, a marine fuels supplier, has successfully executed the region's inaugural LNG bunkering operation. This milestone, achieved on January 4, 2025, at Dubai Harbour Cruise Terminal B, saw Monjasa-operated Green Zeebrugge delivering LNG to Costa Smeralda.


Middle-East And Africa Liquified Natural Gas (LNG) Bunkering Market Report Scope
Driven by stricter environmental regulations, the maritime industry is increasingly turning to LNG bunkering, a process that refuels ships with Liquefied Natural Gas (LNG). As a cleaner alternative to heavy fuel oil, LNG significantly curbs emissions of sulfur oxides (SOx) and nitrogen oxides (NOx). The LNG bunkering process transfers LNG to ships from shore-based facilities, dedicated bunker vessels, or trucks. Specialized equipment, such as dry-break couplings, ensures safe and efficient delivery. Transfer methods include truck-to-ship (TTS), ship-to-ship (STS), and terminal-to-ship (PTS).
The Middle East and Africa liquefied natural gas (LNG) bunkering market is segmented by end user and geography. By end user, the market is segmented into tanker fleet, container fleet, bulk and general cargo fleet, ferries and offshore support vessels (OSV), and other end users. For each segment, the market sizing and forecasts have been carried out on the basis of volume (thousand metric tons).
By End User
| Tanker Fleet |
| Container Fleet |
| Bulk and General Cargo Fleet |
| Ferries and OSV |
| Other End-Users |
By Geography
| Middle East | United Arab Emirates |
| Saudi Arabia | |
| Oman | |
| Qatar | |
| Bahrain | |
| Rest of Middle East | |
| Africa | South Africa |
| Egypt | |
| Nigeria | |
| Kenya | |
| Rest of Africa |
| By End User | Tanker Fleet | |
| Container Fleet | ||
| Bulk and General Cargo Fleet | ||
| Ferries and OSV | ||
| Other End-Users | ||
| By Geography | Middle East | United Arab Emirates |
| Saudi Arabia | ||
| Oman | ||
| Qatar | ||
| Bahrain | ||
| Rest of Middle East | ||
| Africa | South Africa | |
| Egypt | ||
| Nigeria | ||
| Kenya | ||
| Rest of Africa | ||


Key Questions Answered in the Report
How large is the LNG bunkering market in the Middle-East and Africa today?
It reached 59.28 thousand metric tons in 2026 and is projected to climb to 149.11 thousand metric tons by 2031.
Which vessel category consumes the most LNG bunker fuel?
Container ships accounted for 41.1% of demand in 2025 and are projected to grow at 23.4% annually through 2031.
Why is Fujairah considered the leading regional bunkering hub?
Fujairah handles more than 700,000 m³ of LNG bunker fuel annually and benefits from integrated ADNOC supply and a strategic Strait-of-Hormuz location.
What is driving LNG infrastructure investment in South Africa?
Security-related shifts to Cape-route traffic increased port calls at Durban and Richards Bay, prompting Transnet to invest USD 150 million in bunkering facilities.
How do methane-slip regulations affect LNG’s attractiveness?
New IMO limits expected in 2027 make low-slip engines like Wärtsilä’s 31DF essential, preserving LNG’s 20% carbon-intensity advantage over heavy fuel oil.
Page last updated on:


