United Kingdom Electric Vehicle Charging Equipment Market Size and Share
Market Overview
| Study Period | 2021 - 2031 |
|---|---|
| Forecast Data Period | 2026 - 2031 |
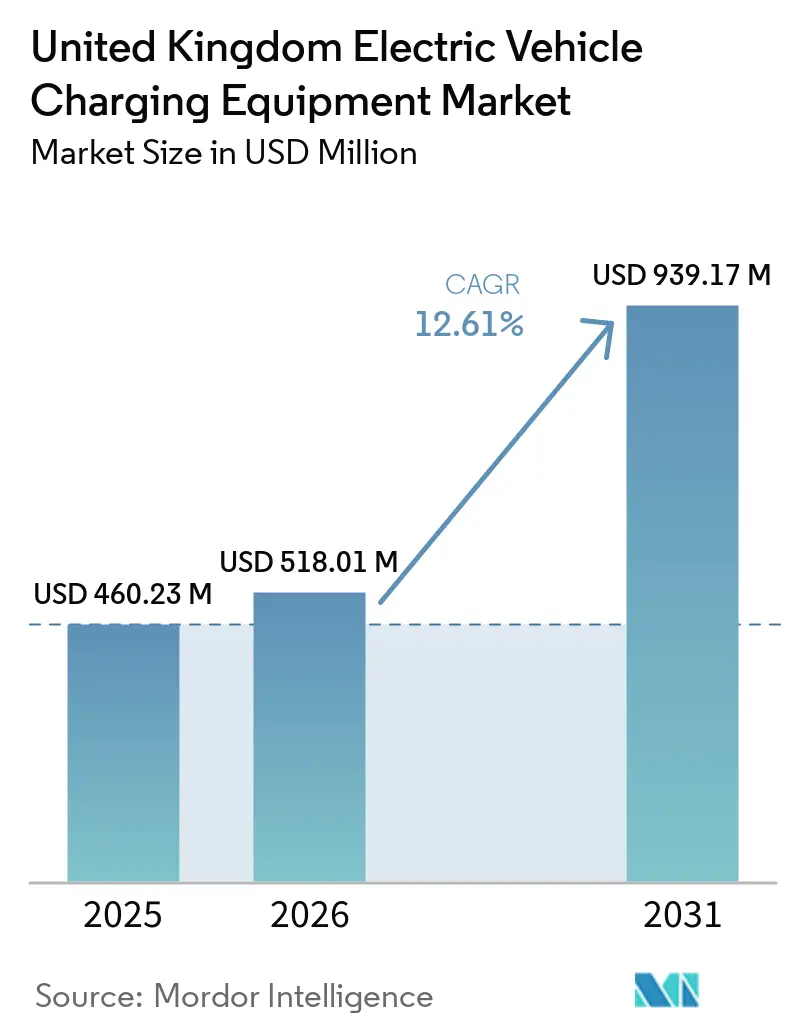
| Base Year Market Size (2025) | USD 460.23 Million |
| Market Size (2026) | USD 518.01 Million |
| Market Size (2031) | USD 939.17 Million |
| Growth Rate (2026 - 2031) | 12.61% CAGR |
| Market Concentration | Medium |
Major Players *Disclaimer: Major Players sorted in no particular order Image © Mordor Intelligence. Reuse requires attribution under CC BY 4.0. | |
United Kingdom Electric Vehicle Charging Equipment Market Analysis by Mordor Intelligence
The United Kingdom Electric Vehicle Charging Equipment Market size is expected to grow from USD 460.23 million in 2025 to USD 518.01 million in 2026 and is forecast to reach USD 939.17 million by 2031 at 12.61% CAGR over 2026-2031. Residential installations continue to dominate early volumes because homeowners leverage overnight tariffs as low as 7 pence per kWh, while ultra-fast corridor charging commands premium tariffs, sustaining operator margins [1]Octopus Energy, “Intelligent Octopus Go Tariff Details,” octopusenergy.com. Fleet-electrification commitments from logistics, bus, and government fleets accelerate depot deployments, yet Distribution Network Operator queue delays and transformer shortages create a two-speed rollout across regions. Meanwhile, competitive dynamics show energy majors using forecourt footprints to scale rapid chargers, pure-play networks forming retail partnerships, and innovators adding solar canopies and second-life batteries to buffer grid demand.
Key Report Takeaways
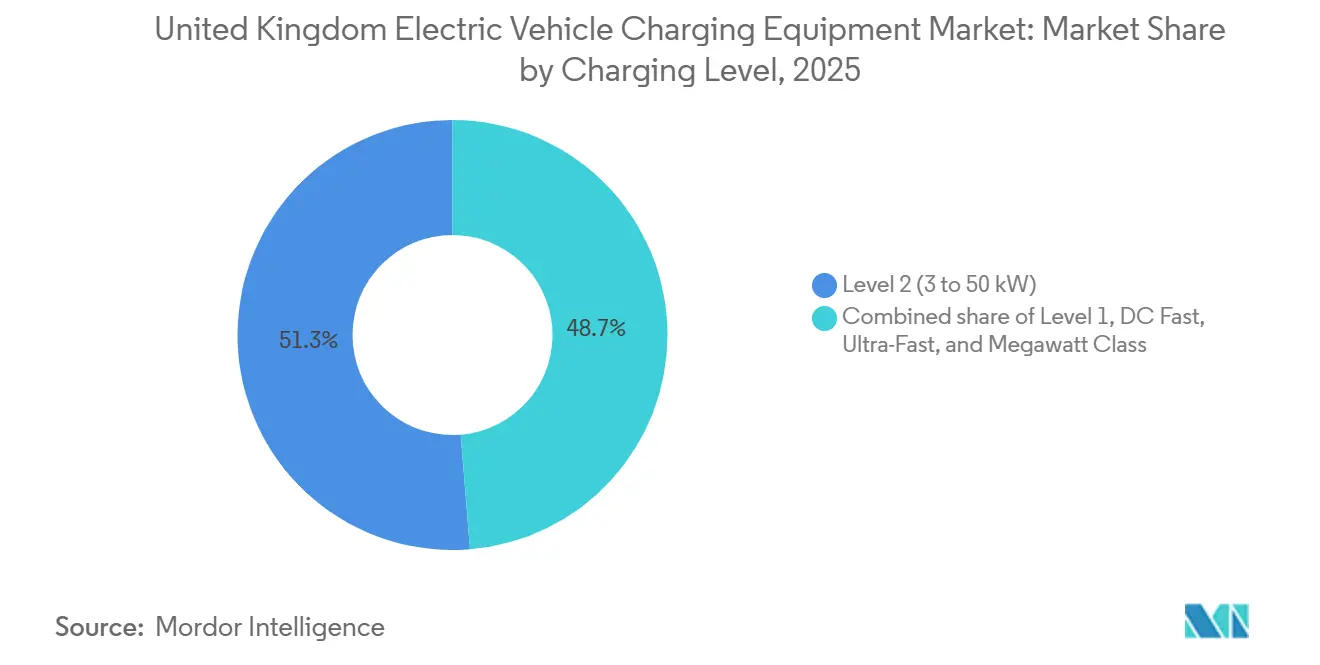
- By charging level, Level 2 units held 51.30% of the United Kingdom electric vehicle charging equipment market share in 2025; Megawatt Class chargers are forecast to expand at a 24.9% CAGR through 2031.
- By installation site, residential locations accounted for 75.10% of 2025 deployments, whereas transportation hubs will grow at a 29.4% CAGR to 2031.
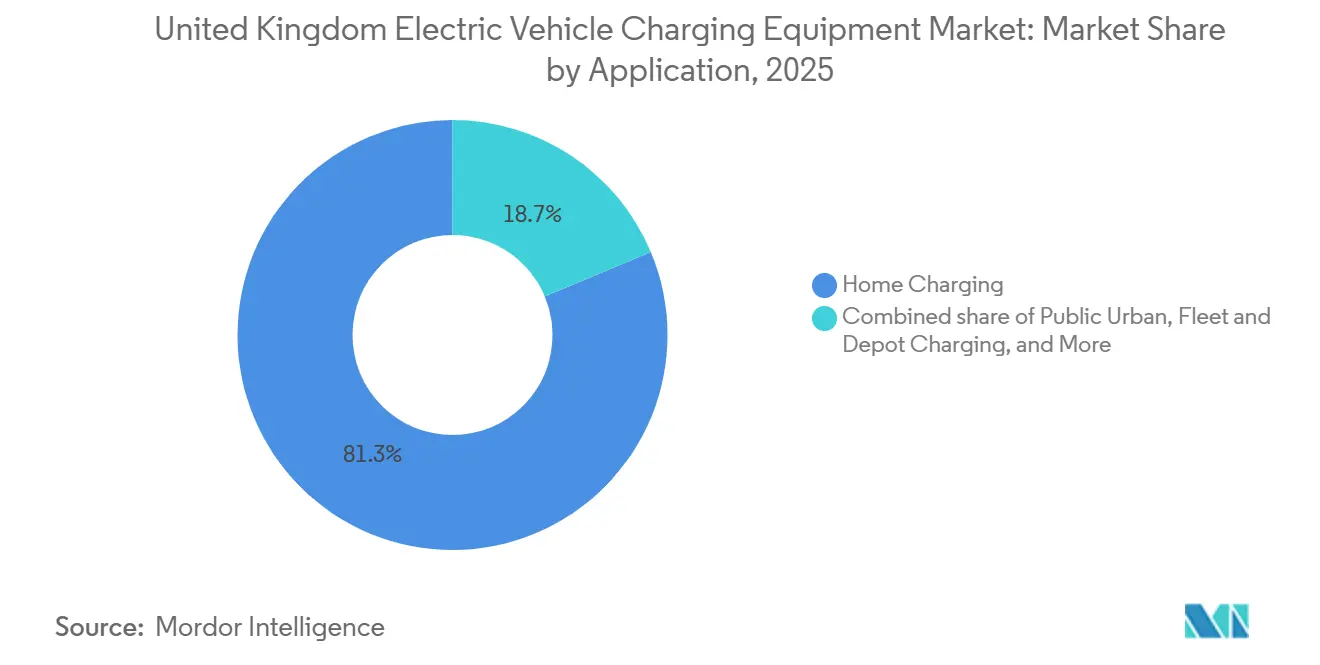
- By application, home charging represented 81.30% of the United Kingdom electric vehicle charging equipment market size in 2025, and fleet and depot charging is advancing at a 32.6% CAGR through 2031.
Note: Market size and forecast figures in this report are generated using Mordor Intelligence’s proprietary estimation framework, updated with the latest available data and insights as of January 2026.
United Kingdom Electric Vehicle Charging Equipment Market Trends and Insights
Drivers Impact Analysis*
| Driver | (~) % Impact on CAGR Forecast | Geographic Relevance | Impact Timeline |
|---|---|---|---|
| EV adoption & ZEV mandate timelines | +3.20% | England, Scotland, Wales; Northern Ireland lagging | Medium term (2-4 years) |
| OZEV grants & tax incentives | +1.80% | National, concentrated in urban England | Short term (≤ 2 years) |
| Public-sector funding (LEVI & Rapid Charging Fund) | +2.40% | England (LEVI), Scotland (ChargePlace expansion) | Medium term (2-4 years) |
| Corporate fleet electrification targets | +2.60% | National, early gains in London, Manchester, Birmingham | Medium term (2-4 years) |
| Dynamic tariffs enabling profitable smart charging | +1.50% | England, pilot rollouts in Scotland | Long term (≥ 4 years) |
| Second-life batteries integrated with chargers | +0.90% | England (Gridserve sites), limited Scotland uptake | Long term (≥ 4 years) |
| Source: Mordor Intelligence | |||
EV Adoption and ZEV Mandate Timelines
The Zero Emission Vehicle sales mandate requires 28% of new cars to be zero-emission by 2025, and 80% by 2030, escalating infrastructure demand as every percentage point rise in battery-electric penetration historically drives a 1.4-fold jump in public chargepoints within 18 months [2]Department for Transport, “Vehicle Emission Regulations,” gov.uk. Automakers face GBP 15,000 fines per non-compliant vehicle, prompting bundled home-charger offers with new EV sales. Scotland’s earlier 2030 phase-out target triggered a 22% annual rise in ChargePlace installations in 2024. The mandate’s flex-credit mechanism lets manufacturers bank surplus ZEV sales, creating uneven yearly installation spikes. Manufacturers, therefore, collaborate with charge-point operators to ensure capacity scales with vehicle deliveries, smoothing supply chain peaks [3]Ofgem, “Connections Action Plan 2024,” ofgem.gov.uk.
OZEV Grants and Tax Incentives
The Office for Zero Emission Vehicles offers up to GBP 350 per residential chargepoint and covers 75% of workplace-charger costs to GBP 15,000, cutting the payback period on workplace hardware from 4.2 years to 2.8 years in 2024. Company-car benefit-in-kind rates remain at 2% for battery electrics through 2025, boosting corporate demand that comprised 54% of new EV registrations last year. Yet the grant excludes detached-home owners with private driveways, concentrating public funds in multi-unit dwellings and widening a rural-urban gap. Salary-sacrifice schemes further tip economics, saving employers nearly GBP 4,800 annually per vehicle. Combined, these incentives accelerate uptake but skew deployment toward high-density postcodes.
Public-Sector Funding (LEVI and Rapid Charging Fund)
The LEVI Fund awarded GBP 185 million to 39 English authorities in 2024, bankrolling on-street chargers in neighborhoods where 40% of homes lack driveways. Birmingham’s GBP 15.6 million grant finances 1,000 lamppost units by 2026; Manchester’s GBP 12.3 million supports 800 installs. The GBP 950 million Rapid Charging Fund underwrites motorway grid upgrades, reducing operator capital by up to 40% and enabling sub-18-month paybacks at Electric Forecourt sites. Scotland’s GBP 60 million extension to ChargePlace fills rural gaps, while Northern Ireland’s smaller allocation trails adoption rates. These programs collectively reduce connection costs and derisk projects in lower-utilization zones.
Corporate Fleet Electrification Targets
Royal Mail, DPD, and other fleets have pledged to convert 50% of last-mile vans by 2028, installing 22 kW–50 kW depot hardware that shifts charging to off-peak windows and cuts energy bills 40%. Transport for London’s zero-emission bus objective creates 300 kW–450 kW pantograph demand across 50 depots. Government fleet mandates add 2,500 workplace chargers by 2027, preferring suppliers with ISO 15118 plug-and-charge security. Lease firms bundle chargers in contracts, moving installation risk away from operators and speeding uptake by mid-sized enterprises. These commitments create predictable multi-year hardware orders, helping manufacturers scale production.
Restraints Impact Analysis*
| Restraint | (~) % Impact on CAGR Forecast | Geographic Relevance | Impact Timeline |
|---|---|---|---|
| High installation & grid-connection CAPEX | -2.10% | England urban centers, Scotland cities | Short term (≤ 2 years) |
| Power-electronics supply-chain constraints | -1.40% | National, affecting 150 kW+ units | Short term (≤ 2 years) |
| DNO queue delays at urban substations | -1.80% | London, Manchester, Birmingham, Edinburgh | Medium term (2-4 years) |
| Payment-system interoperability gaps | -0.70% | Scotland (ChargePlace), Wales, Northern Ireland | Medium term (2-4 years) |
| Source: Mordor Intelligence | |||
High Installation and Grid-Connection CAPEX
Rapid chargers cost GBP 40,000–80,000 installed in urban zones because grid upgrades absorb 50%–60% of budgets. Ultra-fast units climb to GBP 180,000 due to dedicated 11 kV feeds and DNO-mandated transformers [4]Society of Motor Manufacturers and Traders, “EV Market Data 2024,” smmt.co.uk. Civil works add GBP 15,000–40,000, where congested utilities complicate trenching in historic centers such as Westminster. Residential units cost GBP 800–1,500, but multi-unit dwellings need GBP 3,000–8,000 load-management systems that grant only partial offset. These economics deter private investment in lower-traffic areas, skewing installations toward motorway corridors with higher utilization.
Power-Electronics Supply-Chain Constraints
Silicon-carbide shortages stretched lead times for 150 kW+ chargers to 26 weeks in 2024, postponing 4,000 UK units. Transformer wait times reached 12 months as domestic firms prioritized grid-scale storage projects, leaving charge-point operators at the back of the queue. Major vendors adopted allocation policies favoring bulk orders, disadvantaging small independents. Heavy import reliance exposes operators to shipping disruptions, as Red Sea diversions in early 2025 delayed deliveries by four weeks. These bottlenecks risk slowing the United Kingdom's electric vehicle charging equipment market during peak compliance years.
*Our forecasts treat driver/restraint impacts as directional, not additive. The impact forecasts reflect baseline growth, mix effects, and variable interactions.
Segment Analysis
By Charging Level: Megawatt Ambitions Meet Residential Realities
Megawatt-class chargers exceeding 350 kW will expand at a 24.9% CAGR through 2031 as the ZEHID program funds heavy-duty depots and motorway hubs, enabling 500 kWh trucks to recharge in under 30 minutes. Level 2 hardware accounted for 51.30% of 2025 deployments, driven by 1.2 million home units utilizing 7 pence night rates under Intelligent Octopus Go. DC fast units between 50 kW and 150 kW dominate motorway services, balancing throughput with connection costs and hitting 20-plus daily sessions at prime sites. Ultra-fast chargers cluster along the M25 and M6 where Tesla and Ionity anchor long-distance corridors. Level 1 sockets now account for under 2% of new installs because 12-hour charge times cannot match modern 60 kWh packs.
Battery chemistries accepting 3C charge rates promote higher-power adoption, and IEC 61851 compliance became mandatory in public tenders during 2024, driving refresh cycles among incumbents. Level 2’s future growth depends on LEVI-funded lamppost conversions delivering 5.5 kW to apartment streets where 40% of households lack driveways. Modular power-stack designs let operators upgrade 75 kW cabinets to 150 kW as utilization rises without full replacement, protecting ROI. Ultra-fast hubs add retail partners that monetize 20-minute dwell times, earning GBP 4–6 ancillary spend per session. Together, these dynamics sustain a layered power portfolio within the United Kingdom electric vehicle charging equipment market.


By Installation Site: Depots Disrupt Residential Dominance
Residential properties captured 75.10% of installations in 2025, but growth is flattening as detached-home saturation nears in the Southeast. Transportation hubs will outpace other categories at a 29.4% CAGR, leveraging airport ground-power capacity to avoid costly transformers and serving ride-hail fleets at Heathrow and Gatwick. Commercial and retail destinations such as Tesco and Sainsbury’s add 22 kW–50 kW chargers aligned with 90-minute shopping windows, achieving 12-plus weekly sessions. Public municipal lamppost programs improve equitable access yet average only six weekly sessions, complicating revenue recovery.
Fleet depots drive the sharpest near-term jump, with DPD outfitting 45 sites that each need up to 2 MW overnight load and software scheduling that cuts peak demand 35%. Workplace charging is shifting from free perks to paid amenities; 68% of Pod Point’s corporate units now charge use-based fees to avoid taxable benefits. Transportation hub growth rests on capturing multiple segments employee commuting, rental returns, passenger vehicles within a single grid connection, maximizing capital efficiency. The result is a redistribution of volume: residential share erodes while depots and hubs grow, diversifying revenue sources for operators within the United Kingdom electric vehicle charging equipment market.
By Application: Fleet Economics Rewrite Home-Charging Playbook
Home charging led with 81.30% of 2025 installations, underpinned by OZEV subsidies and cheap overnight tariffs. Fleet and depot charging is projected to climb 32.6% annually as Royal Mail electrifies 5,000 vans and London bus depots upgrade to 300 kW-plus pantographs. Highway corridor fast charging maintains critical support for long-distance travel, where operators need 20 daily sessions to break even within four years. Public urban charging focuses on 40% of households without driveways, but low weekday utilization still hampers private investment, prompting councils to trial dynamic pricing.
Managed charging algorithms shift fleet loads to off-peak periods when wholesale prices average 8 pence versus 25 pence during day peaks, saving GBP 1,200 annually per van. Bus garages require 2 MW-plus grid upgrades costing GBP 500,000–1.5 million, funded through Transport for London contracts that bundle charging with vehicle procurement. Highway hubs integrate solar and batteries for 30% on-site generation, reducing energy costs by 25% and shielding profits from spot-price swings. Workplace charging revenue grows as employers monetize daytime energy, aided by clearer tax guidance published in 2024. These shifts mean fleets will reshape demand patterns, moving the locus of growth away from private driveways toward centralized depots in the United Kingdom electric vehicle charging equipment market.
Geography Analysis
London alone hosts 18,000 public units, equal to 24% of the national total, underpinned by the Ultra Low Emission Zone and a 16.5% EV penetration rate. Southeast counties boast 22–28 home chargers per 1,000 households, double the national mean, whereas rural Cornwall averages four chargers per 100 sq km, illustrating widening disparities. Birmingham's 1,000-unit lamppost plan aims to close gaps where half of households lack off-street parking.
Scotland operates 2,200 public chargers, and a GBP 60 million expansion targets island and rural A-roads, yet EV adoption stands at 8.7%, lagging England. Glasgow and Edinburgh host 60% of Scottish rapid units because Central Belt substations can accept 150 kW hardware without reinforcement, saving 20% on connections. Wales maintains 1,800 public chargepoints, focusing on tourist routes that hit 24 sessions weekly during summer, though winter usage falls below eight, stressing operator revenue. Northern Ireland has 850 chargers and an 8.2% EV share, hindered by absent LEVI funding and higher per-site connection fees due to sparse substations.
England's industrial legacy supports easier upgrades, while devolved administrations rely more on public subsidies to ensure coverage. Scotland's model ensures geographic equity but yields lower utilization, six sessions weekly versus 14 in England, raising cost-recovery concerns. Northern Ireland's lag reflects policy gaps and lower incomes, risking a two-tier infrastructure landscape. These regional contrasts illustrate how the United Kingdom's electric vehicle charging equipment market splits along economic and policy lines.
Competitive Landscape
The United Kingdom Electric Vehicle Charging Equipment Market is semi consolidated. Energy majors BP Pulse and Shell Recharge exploit existing petrol forecourts to cut site acquisition costs by 60%, scaling to 3,500 and 2,000 chargepoints respectively by 2024. Pure-plays InstaVolt and Osprey emphasize uptime, with InstaVolt reporting 99.2% availability and leveraging supermarket dwell times to earn steady throughput.
Tesla opened 1,800 UK Supercharger stalls to other brands in late 2024, forcing interoperability upgrades across the market and pushing rivals to match CCS2 connectors and open-protocol billing. Gridserve’s Electric Forecourt model integrates solar canopies and second-life batteries, achieving 30% self-generation and lowering annual energy bills by 25%. Technology innovation centers on smart-charging algorithms that trim grid costs; Wallbox and Zap-Tech provide AI load-balancing that reduces transformer size needs by 25%.
Consolidation remains limited, EDF bought Pod Point’s commercial arm, and Macquarie invested in Osprey, indicating organic growth still trumps acquisitions. White-space opportunities persist in rural Scotland, Wales, and Northern Ireland, plus urban apartment blocks lacking off-street parking. Automaker investment will intensify competition as Volkswagen’s Ionity joint venture expands its 50-site footprint by 2026. Overall, operator differentiation now rests on reliability, cost-efficient grid integration, and value-added energy services.
United Kingdom Electric Vehicle Charging Equipment Industry Leaders
ABB Ltd
Siemens AG
Delta Electronics Inc.
ChargePoint Inc
Tesla Inc.
- *Disclaimer: Major Players sorted in no particular order

Recent Industry Developments
- January 2025: Gridserve committed GBP 150 million to build 100 Electric Forecourt sites by 2027, featuring 350 kW chargers, solar roofs, and battery storage.
- December 2024: BP Pulse partnered with Tesco to install 3,000 rapid chargers at 600 supermarkets by 2026, integrating loyalty-program discounts.
- November 2024: Tesla opened its Supercharger network to non-Tesla cars, granting app-based access to 1,800 stalls at a 10% premium over Tesla-owner rates.
- October 2024: Shell Recharge formed a joint venture with National Grid to deploy 500 ultra-fast chargers at motorway service areas by 2028, leveraging substation assets to cut connection times.


United Kingdom Electric Vehicle Charging Equipment Market Report Scope
Electric vehicle (EV) charging equipment refers to the infrastructure used to charge electric vehicles. The EV charging equipment plays a crucial role in the widespread adoption of electric vehicles. The availability of robust EV charging infrastructure is essential for overcoming range anxiety, a primary concern for potential EV buyers. It helps in reducing carbon emissions and improving air quality.
The United Kingdom electric vehicle charging equipment market is segmented by charging level, installation site, and application. By charging level, the market is segmented into level 1, level 2, DC fast, ultra-fast, and megawatt-class. By installation site, the market is segmented by residential, commercial and retail, public municipal, and transportation hubs. By application, the market is segmented into home, workplace, public urban, highway corridor, fleet, and depot charging. For each segment, the market sizing and forecasts have been provided based on value (USD).
| Level 1 (Up to 3 kW) |
| Level 2 (3 to 50 kW) |
| DC Fast (50 to 150 kW) |
| Ultra-Fast (150 to 350 kW) |
| Megawatt Class (Above 350 kW) |
| Residential |
| Commercial and Retail |
| Public Municipal |
| Transportation Hubs (Airports, Ports) |
| Home Charging |
| Workplace Charging |
| Public Urban Charging |
| Highway Corridor/En-Route Fast Charging |
| Fleet and Depot Charging |
| By Charging Level | Level 1 (Up to 3 kW) |
| Level 2 (3 to 50 kW) | |
| DC Fast (50 to 150 kW) | |
| Ultra-Fast (150 to 350 kW) | |
| Megawatt Class (Above 350 kW) | |
| By Installation Site | Residential |
| Commercial and Retail | |
| Public Municipal | |
| Transportation Hubs (Airports, Ports) | |
| By Application | Home Charging |
| Workplace Charging | |
| Public Urban Charging | |
| Highway Corridor/En-Route Fast Charging | |
| Fleet and Depot Charging |


Key Questions Answered in the Report
What is the forecast value of the United Kingdom electric vehicle charging equipment market in 2031?
The market is projected to reach USD 939.17 million by 2031.
Which charging level is growing fastest toward 2031?
Megawatt Class hardware above 350 kW is growing at a 24.9% CAGR to 2031.
What share of 2025 installations occurred at residential sites?
Residential properties accounted for 75.10% of installations in 2025.
How much can home-charging consumers save using dynamic tariffs?
Drivers on Intelligent Octopus Go can save around GBP 600 per year compared with flat-rate tariffs.
How many public chargepoints does London have in 2025?
London hosts 18,000 public chargepoints, equal to 24% of the national total.
Page last updated on:


