Market Overview
| Study Period | 2020 - 2031 |
|---|---|
| Forecast Data Period | 2026 - 2031 |
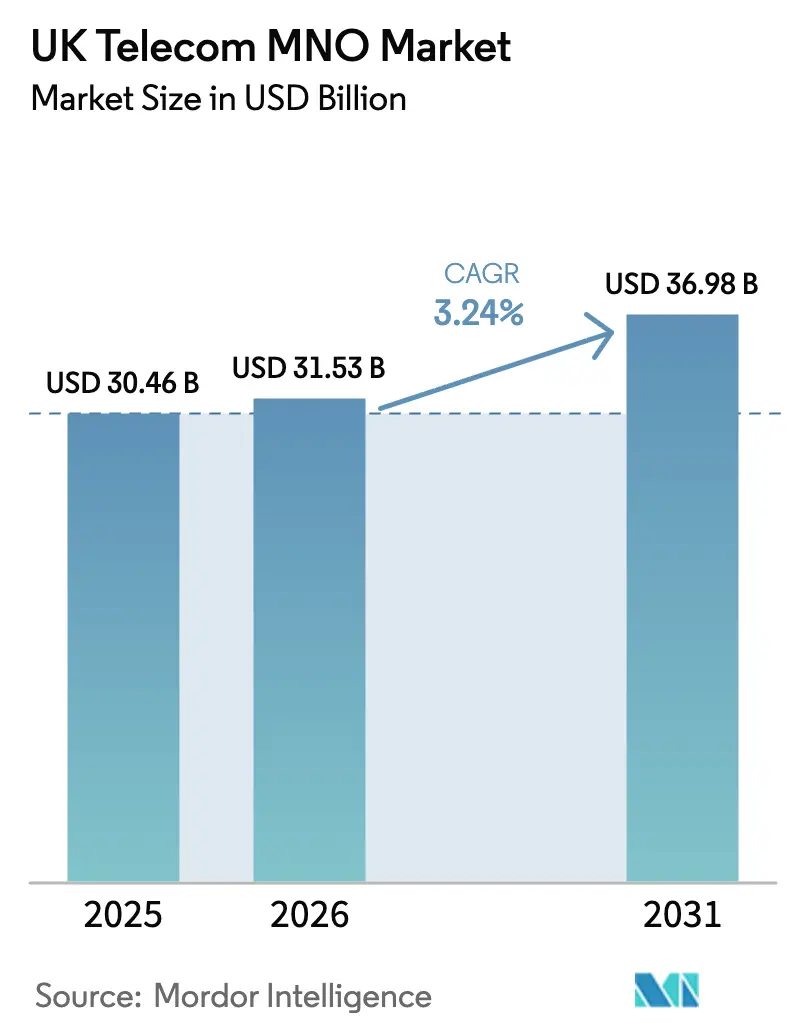
| Base Year Market Size (2025) | USD 30.46 Billion |
| Market Size (2026) | USD 31.53 Billion |
| Market Size (2031) | USD 36.98 Billion |
| Growth Rate (2026 - 2031) | 3.24% CAGR |
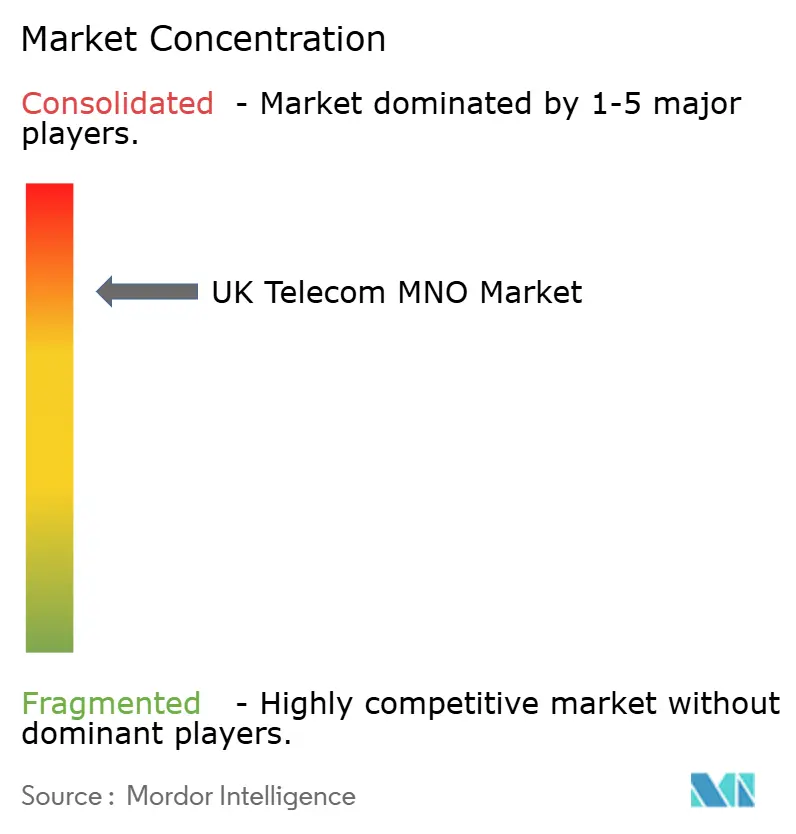
| Market Concentration | High |
Major Players
*Disclaimer: Major Players sorted in no particular order Image © Mordor Intelligence. Reuse requires attribution under CC BY 4.0. |
|
UK Telecom MNO Market Analysis by Mordor Intelligence
The UK Telecom MNO Market size is expected to grow from USD 30.46 billion in 2025 to USD 31.53 billion in 2026 and is forecast to reach USD 36.98 billion by 2031 at 3.24% CAGR over 2026-2031. In terms of subscriber volume, the market was valued at 101.57 million subscribers in 2025 and is expected to grow from 103.93 million subscribers in 2026 to 115.62 million subscribers by 2031, at a CAGR of 2.13% during the forecast period (2026-2031). Rapid 5G-stand-alone deployment, mounting demand for fixed-mobile convergence bundles, and proactive rural-coverage schemes are widening revenue pools even as headline growth rates appear modest. Consolidation following the 2025 Vodafone-Three merger unlocked scale efficiencies that immediately pushed average 4G speeds up by 40% for 7 million customers and set a foundation for dense 5G roll-outs. Enterprise appetite for network slicing and multi-access edge computing is beginning to translate into premium contract wins, while stringent Ofcom rules against inflation-linked price rises are forcing operators to lean on transparent tariffs and value-added services. Capital intensity remains high because millimeter-wave spectrum fees, energy tariffs, and net-zero commitments are advancing in parallel with traffic volumes.
Key Report Takeaways
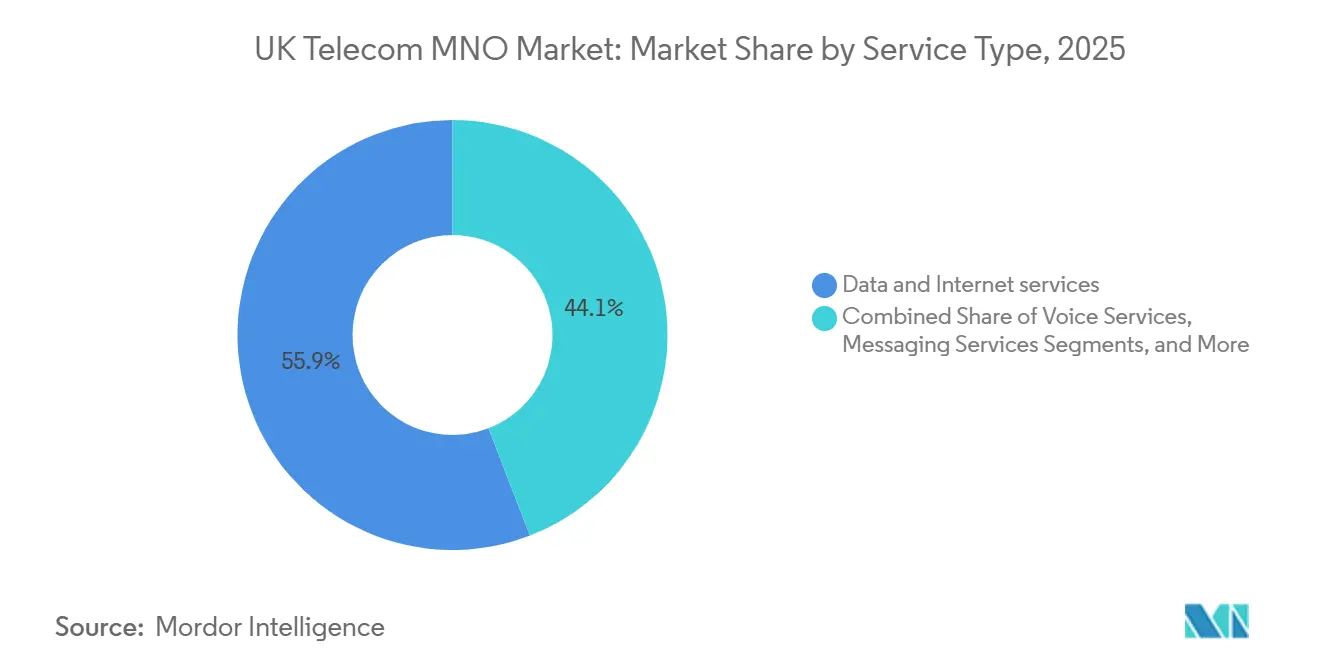
- By service type, data and internet services captured 55.87% of UK Telecom MNO Market share in 2025, whereas IoT and M2M services are forecast to post a 4.42% CAGR through 2031.
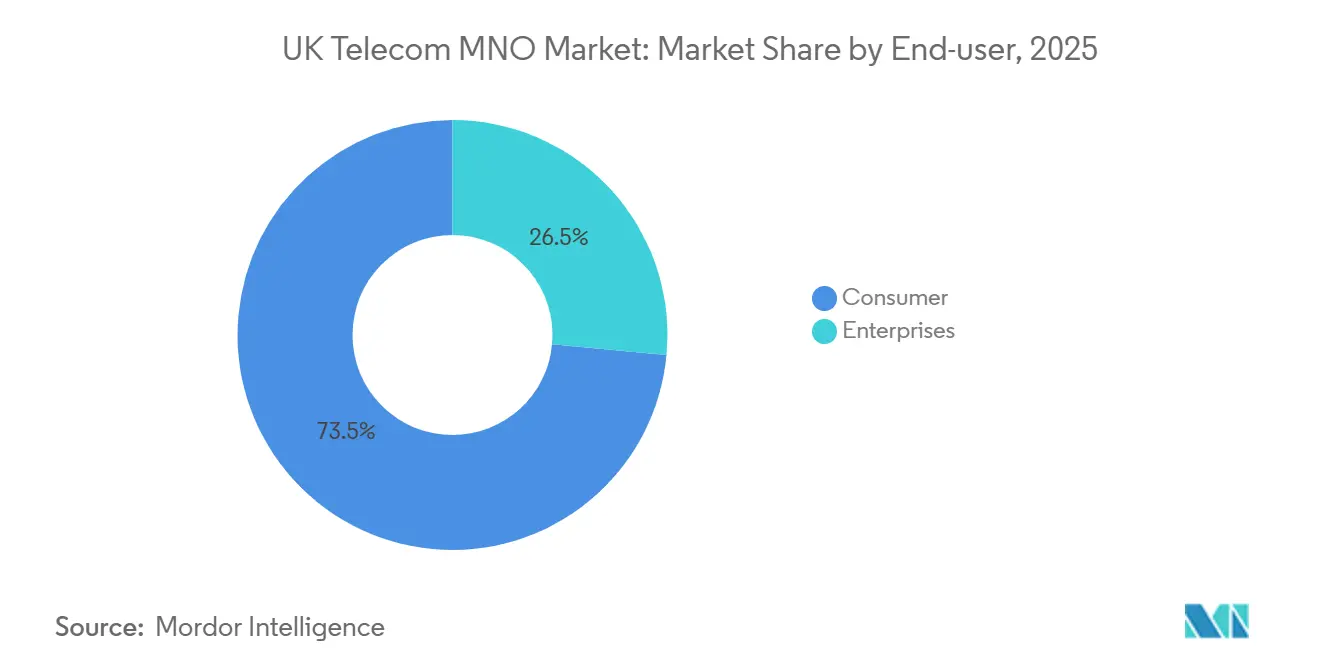
- By end-user, the consumer segment led with 73.52% revenue share in 2025; the enterprise segment is expected to register the fastest 3.66% CAGR through 2031.
Note: Market size and forecast figures in this report are generated using Mordor Intelligence’s proprietary estimation framework, updated with the latest available data and insights as of January 2026.
UK Telecom MNO Market Trends and Insights
Drivers Impact Analysis*
| Driver | (~) % Impact on CAGR Forecast | Geographic Relevance | Impact Timeline |
|---|---|---|---|
| 5G Stand-Alone Roll-Out Accelerates Premium ARPU Uplift | +0.8% | National, led by London, Manchester, Birmingham | Medium term (2-4 years) |
| Fixed-Mobile Convergence Bundles Deepen Churn Reduction | +0.7% | National, strongest in Virgin Media O2 cable and BT Openreach FTTP zones | Short term (≤ 2 years) |
| Shared Rural Network Expands Coverage into New Demand Pockets | +0.3% | Rural England, Scotland, Wales, Northern Ireland | Medium term (2-4 years) |
| CPI+3.9% Tariff Indexing Previously Protected Top-Line Growth | +0.5% | National, future impact capped by 2025 ban | Short term (≤ 2 years) |
| Network-Slicing Guarantees for MEC-Based Verticals Unlock New Revenue Streams | +0.4% | National, early uptake in Midlands manufacturing hubs and NHS trusts | Long term (≥ 4 years) |
| Ofcom OpenRAN Rules Shorten 5G Small-Cell Permitting | +0.2% | Urban areas and transport corridors | Medium term (2-4 years) |
| Source: Mordor Intelligence | |||
5G Stand-Alone Roll-Out Accelerates Premium ARPU Uplift
Standalone architecture went live nationwide in 2025, removing 4G anchors and cutting end-to-end latency below 10 milliseconds for eligible enterprise workloads. EE now markets guaranteed-slice packages at three to five times consumer postpaid ARPU, while Virgin Media O2 and the merged Vodafone-Three entity funnel a combined GBP 11 billion (USD 14.74 billion) into densification over the next decade. Manufacturing, logistics, and healthcare early adopters validate willingness to pay for deterministic performance, signaling a structural uplift in blended revenue per user. Spectrum depth across 3.4–3.8 GHz plus fresh 26 GHz blocks enables operators to isolate traffic with minimal interference, which raises perceived service quality and stickiness. As more devices ship with Release-17 firmware, premium tiers are expected to capture a rising share of new activations, pushing overall UK Telecom MNO Market yields higher despite retail-price caps.
Fixed-Mobile Convergence Bundles Deepen Churn Reduction
Operators bundle gigabit broadband, 5G data, and streaming perks into a single invoice, cutting household churn by up to 30% against single-play tariffs. Virgin Media O2’s Volt base already accounts for roughly one-quarter of its residential customers, averaging 40-50% more monthly revenue than mobile-only users. BT exploits Openreach fiber to pull EE subscribers into long-term contracts, which reduces acquisition cost and unlocks handset financing flexibility. Converged homes consume more data across fixed and mobile screens, accelerating volume growth without cannibalizing margins. Because Ofcom enforces wholesaling rules on fixed access but not on cable, integrated players retain an economic edge that is difficult for pure-play mobile rivals to replicate.
Shared Rural Network Expands Coverage into New Demand Pockets
The public-private Shared Rural Network hit its 95% geographic target one year early, extending 4G to remote areas in Scotland, Wales, and Northern England. Joint tower builds lowered per-site capex by about 40%, making sparse regions economically viable for the first time in a decade. Coverage gains unlock latent demand among agriculture and tourism businesses, while remote workers replace unreliable satellite links with mobile broadband. Ofcom’s streamlined site-acquisition code slashed permitting times below 12 months, accelerating small-cell roll-outs on rural roads and rail corridors. Although rural ARPU lags urban levels, incremental usage drives higher spectrum utilization and satisfies universal-service mandates that influence future license renewals.
Network-Slicing Guarantees for MEC-Based Verticals Unlock New Revenue Streams
Dedicated network slices paired with multi-access edge computing now support telemedicine, predictive maintenance, and autonomous-vehicle coordination at sub-10-millisecond latency. BT’s enterprise unit secured annual contracts worth GBP 1.5 million in 2025 (USD 2.01 million), while Vodafone’s NHS pilots demonstrated congestion-free high-definition diagnostics. Pricing ranges from GBP 500-2,000 per slice per month, decoupling revenue from consumer data bundles. Operators face a consultative sales cycle, but once embedded, mission-critical slices exhibit near-zero churn and strong upsell potential. Over the forecast horizon, slice monetization is projected to outstrip basic connectivity growth, cushioning EBITDA against inflationary cost inputs.
Restraints Impact Analysis*
| Restraint | (~) % Impact on CAGR Forecast | Geographic Relevance | Impact Timeline |
|---|---|---|---|
| Spectrum and Energy Costs Squeeze EBITDA Margins | -0.6% | National, acute for legacy copper operators | Short term (≤ 2 years) |
| MVNO Migration Dilutes Headline ARPU in Cost-of-Living Crisis | -0.4% | National, prepaid and low-income segments | Short term (≤ 2 years) |
| Net-Zero Targets Front-Load Capex for Greener Networks | -0.3% | National, dense urban small-cell zones | Medium term (2-4 years) |
| Net Neutrality and Environmental Levies Limit Differential Pricing | -0.2% | National, under Ofcom oversight | Long term (≥ 4 years) |
| Source: Mordor Intelligence | |||
Spectrum and Energy Costs Squeeze EBITDA Margins
The 2025 millimeter-wave auction added GBP 343 million (USD USD 460 million) in license fees, bringing annual spectrum charges to roughly GBP 200 million per operator.[1]Ofcom, “Telecoms Data Tables Q3 2025,” ofcom.org.uk Source: Vodafone plc, “Enterprise IoT Performance 2025 Update,” vodafone.com Simultaneously, electricity prices for radio sites rose 15-20%, inflating network opex just as traffic volumes accelerate. Operators with legacy copper incur higher watts-per-gigabyte than fiber-centric rivals, eroding competitive leverage. EE and Vodafone are testing AI-based energy-management software that dynamically powers down carriers during off-peak windows, but savings will take several years to scale. Until then, elevated cost of service narrows margin headroom and may delay discretionary investments in rural densification.
MVNO Migration Dilutes Headline ARPU in Cost-of-Living Crisis
Discount virtual operators such as Giffgaff, Smarty, and Lebara undercut incumbent tariffs by up to 50%, attracting price-sensitive shoppers during 2024-2025 inflation spikes. Virgin Media O2 logged 122,800 postpaid losses in early 2025, a direct consequence of SIM-only bargains that entice budget-constrained households. Ofcom statistics show industry-wide ARPU sliding from GBP 14.20 (USD 19.03) to GBP 13.58 (USD 18.18) year on year, despite steady growth in data volumes. Merger-related remedies freeze MVNO wholesale rates through 2028, limiting carriers’ ability to raise transfer prices and protecting the low-cost segment’s appeal. Although incumbents have launched flanker brands to recapture churners, these offerings compress blended margins and entrench promotional pricing behavior throughout the UK Telecom MNO Market.
*Our forecasts treat driver/restraint impacts as directional, not additive. The impact forecasts reflect baseline growth, mix effects, and variable interactions.
Segment Analysis
By Service Type: IoT Acceleration Reshapes Revenue Mix
Data and internet services controlled 55.87% of UK Telecom MNO market share in 2025, reflecting the migration of household and enterprise workloads to mobile broadband as well as the substitution of fixed lines in fiber-poor areas. Quarterly mobile traffic hit 1,257 petabytes in Q3 2025, an 18% year-on-year jump fueled by high-definition video, cloud gaming, and remote-work applications that require multi-gigabyte allowances. Yet IoT and M2M connections are projected to expand at a 4.42% CAGR from 2026 to 2031, outpacing every other service line inside the UK Telecom MNO market size. Narrowband IoT and LTE-M smart-meter roll-outs priced at GBP 1-3 (USD 1.27-3.81) per device per month offer predictable recurring revenue and minimal incremental traffic load. Voice and SMS continue a secular decline as over-the-top apps displace traditional calls and texts, turning both into retention features bundled with unlimited data rather than standalone cash generators.
Messaging revenue faces identical pressure, while OTT and PayTV partnerships add ancillary income through bundled streaming rights that raise perceived value with little extra cost to carriers. Hybrid fixed-mobile bundles deepen wallet share by lowering churn 20-30% and lifting household spend 40-50%, reinforcing the structural tilt toward converged propositions. IoT momentum benefits from the government mandate to fit 53 million smart meters nationwide by 2025 and from automakers embedding cellular modems for over-the-air software updates. Industrial clients pay two to three times consumer rates for guaranteed uptime and dedicated support, underscoring why IoT will capture a growing slice of UK Telecom MNO market share through 2031. As 5G Release-17 modules gain scale, connected-device volumes are set to multiply, embedding cellular connectivity across manufacturing, healthcare, and logistics workflows.


By End-User: Enterprise Margin Expansion Outpaces Consumer Volume
Consumer lines represented 73.52% of UK Telecom MNO market share in 2025, supported by more than 80 million active SIMs nationwide. Despite that scale, enterprise revenue is projected to grow at a 3.66% CAGR through 2031 because private 5G, network slicing, and multi-access edge computing command far richer unit economics than postpaid handset plans. BT’s business mobile arm recorded GBP 1.202 billion (USD 1.53 billion) in FY25, while its consumer unit delivered GBP 3.509 billion (USD 4.46 billion), illustrating how a smaller user base can still wield strategic pricing power. Private 5G factories routinely pay GBP 2,000-5,000 (USD 2,540-6,350) per month for dedicated slices that guarantee sub-10-millisecond latency, dwarfing the GBP 20-30 (USD 25.40-38.10) average consumer ARPU.
Vodafone’s NHS pilots proved that network-sliced telemedicine can support congestion-free high-definition diagnostics, validating premium price points for mission-critical traffic. Enterprises also deploy thousands of IoT endpoints that each yield GBP 5-10 (USD 6.35-12.70) monthly with multi-year contract visibility, a scaling model independent of handset churn. Consumer profitability, meanwhile, is squeezed by MVNO discounting, pushing incumbents to defend share with converged bundles like Virgin Media O2’s Volt, which lowers churn by roughly one-quarter. As more enterprises embrace stand-alone 5G and edge computing, the services segment is set to command a larger slice of UK Telecom MNO market size even while consumer lines continue to dominate volume metrics.
Geography Analysis
Urban corridors generate a disproportionate share of revenue, with London, Manchester, Birmingham, and Glasgow responsible for roughly 40% of 2025 mobile turnover. Dense small-cell grids and abundant fiber backhaul permit carrier aggregation that drives superior user throughput. EE’s 5G-plus footprint spans 66% of the population, anchored by these metropolitan strongholds. [2]Liberty Global. "Investor Relations - Financial Results." Accessed January 19, 2026. https://www.libertyglobal.com/investor-relations/financial-results/
Rural Scotland, Wales, and Northern England benefited from the Shared Rural Network, which met its 95% coverage goal in 2025, translating into fresh SIM activations among agriculture, tourism, and home-office users. Economic return in these territories is thinner, yet regulatory and reputational factors compel continued investment. Early OpenRAN pilots in Wales demonstrated 20-30% cost savings, creating a template for Highlands deployments that can stretch capex budgets.
Northern Ireland introduces cross-border competitive tension because Irish tariffs often undercut UK plans, especially on roaming. The Vodafone-Three merger pooled spectrum to strengthen coverage in lower-density regions, promising future efficiency gains. Over the forecast horizon, urban areas will continue to fund rural obligations, maintaining a balanced yet unequal revenue map across the UK Telecom MNO Market.
Competitive Landscape
Market structure shifted decisively with the May 2025 Vodafone-Three merger that produced a 28.8 million-subscriber leader pledging GBP 11 billion (USD 14.74 billion) of network investment over a decade. Virgin Media O2 retains a convergence moat by uniting cable broadband with mobile, generating 40-50% higher household spend versus single-play offers.[3]Financial Reporting and News." Accessed January 19, 2026. https://www.bt.com/about/bt/our-company/bt-group-plc/financial-reporting-and-news BT’s EE brand exploits Openreach fiber reach to cross-sell mobile, lowering acquisition costs and locking multi-play accounts.
Regulatory conditions insisted on frozen MVNO wholesale rates for three years, protecting discount brands that siphon price-sensitive traffic yet keeping competitive pressure alive. Operators now chase white-space enterprise opportunities such as private 5G factories and hospital networks. BT targets GBP 50 million (USD 67 million) in annual private-slice revenue by 2027, while Vodafone’s OpenRAN pilots trimmed site costs by up to 30%, promising faster urban densification. Competitive differentiation will increasingly hinge on the ability to monetize 5G stand-alone capabilities and converged propositions faster than rising costs dilute operating margins in the UK Telecom MNO Market.
The three incumbents are also racing to unlock fresh efficiencies through vendor diversification and software-defined infrastructure. Vodafone’s OpenRAN rollout, which trimmed site costs by roughly 30%, is pressuring Ericsson and Nokia to sharpen pricing and support models as contracts come up for renewal. EE is piloting AI-driven energy-management software across 20,000 radio sites, a move expected to cut electricity use 15% by 2027 and narrow opex gaps with cable-powered rivals. Virgin Media O2 must balance convergence advantages against millimeter-wave coverage obligations that require dense small-cell grids in at least 10 cities by 2028, stretching integration resources even as fixed-line upgrades soak up capital. Meanwhile, Ofcom’s push for greater supplier diversity is nudging all operators toward multi-vendor cores that can mix and match best-of-breed functions without lock-in risks. Collectively, these strategic pivots signal a shift from pure scale economics to technological agility as the critical success factor in the UK Telecom MNO Market.
UK Telecom MNO Industry Leaders
-
EE Limited (BT Group)
-
Virgin Media O2
-
VodafoneThree
- *Disclaimer: Major Players sorted in no particular order

Recent Industry Developments
- January 2026: Vodafone finalized network integration with Three, rolling out a unified 5G stand-alone core and improving 4G speeds by 40% for 7 million users.
- December 2025: BT committed GBP 500 million (USD 670) to renewable energy and AI-driven RAN efficiency upgrades aimed at cutting electricity use 15% by 2027.
- November 2025: Virgin Media O2 introduced Volt Max, a 2 Gbps cable plus unlimited 5G bundle priced at GBP 80-100 (USD 107.20 - USD 134.00) per month that is reducing churn by 25%.
- October 2025: Ofcom auctioned 26 GHz and 40 GHz spectrum, assigning 78.8 MHz to Virgin Media O2 for GBP 343 million (USD 459.62) with urban coverage obligations by 2028.


Research Methodology Framework and Report Scope
Market Definitions and Key Coverage
Our study defines the United Kingdom telecom market as all domestic revenue that licensed operators earn from mobile voice and data, fixed voice, fixed broadband, managed wholesale access, and Pay-TV/OTT add-ons sold within the UK territory. Revenue booked in sterling is converted to U.S. dollars using annual average exchange rates so global readers can compare figures easily.
Scope Exclusions: Network equipment sales, handset retailing, and any earnings that UK groups report from their non-UK subsidiaries remain outside this valuation.
Segmentation Overview
- Overall Telecom Revenue and ARPU
-
Service Type
- Voice Services
- Data and Internet Services
- Messaging Services
- IoT and M2M Services
- OTT and PayTV Services
- Other Services (VAS, Roaming and International, Enterprise and Wholesale, etc.)
-
End-User
- Enterprises
- Consumer
Detailed Research Methodology and Data Validation
Primary Research
To ground the desk findings, we interviewed network finance managers, wholesale product heads, rural fiber consortium leaders, and Ofcom policy advisers across England, Scotland, Wales, and Northern Ireland. Their insights on 5G uptake, fiber roll-out economics, and pricing outlook helped stress-test key elasticities and refine assumptions where published data were silent.
Desk Research
Mordor analysts began with authoritative, freely available datasets such as Ofcom's quarterly communications market reports, Office for National Statistics industry accounts, Department for Science, Innovation & Technology policy papers, and ITU and OECD telecom indicators. These establish subscriber counts, service mix, and historical spend patterns. Company filings housed on Companies House, investor presentations, and carefully screened press releases extend the financial picture, while policy consultation documents reveal regulatory cost drivers. Select paid resources, Dow Jones Factiva for deal flow and D&B Hoovers for operator segment splits, fill critical gaps. The sources cited above illustrate, not exhaust, the broad evidence base supporting our desk work; many additional materials inform validation and clarification.
Market-Sizing & Forecasting
A top-down construct starts with audited operator revenue, re-mapped to Mordor's service taxonomy and adjusted for currency, inter-operator eliminations, and VAT. These totals are then corroborated through selective bottom-up checks, sampled ARPU x active SIMs, fixed broadband ARPU x subscriber lines, and tower lease rates, to flag under- or over-statements. Variables that drive the model include household broadband penetration, 5G subscriber share, fiber-to-the-premises coverage, inflation-adjusted blended ARPU trends, spectrum fee trajectories, and enterprise ICT spending indices. Five-year outlooks employ a multivariate regression that links revenue to those indicators plus macro GDP, and scenario analysis captures policy or merger shocks. Where channel checks reveal volume gaps, interpolation guided by operator guidance bridges discontinuities before final triangulation.
Data Validation & Update Cycle
Model outputs move through anomaly filters, variance checks versus Ofcom and ONS benchmarks, and second-analyst review before sign-off. We refresh the dataset annually and trigger interim revisions when material events, tariff caps, major M&A, and spectrum auctions, shift the baseline. A final pre-publication sweep ensures clients receive the latest vetted view.
Why Mordor's UK Telecom Baseline Earns Investors' Trust
Published numbers rarely align because publishers differ on which services to count, how far forecasts stretch, and how often inputs refresh.
Key gap drivers include contrasting scope, some fold in device hardware or global subsidiaries, variation in currency translation points, treatment of wholesale transit fees, and refresh cadence that may ignore mid-year regulatory shifts. Mordor's disciplined, service-level mapping and annual operator filing reconciliation mitigate these skews, giving decision-makers a balanced anchor.
Benchmark comparison
| Market Size | Anonymized source | Primary gap driver |
|---|---|---|
| USD 35.90 B (2024) | Mordor Intelligence | - |
| USD 130.49 B (2025) | Global Consultancy A | Includes device sales and outbound roaming; currency blended across EMEA; no operator filing tie-back |
| USD 66.60 B (2024) | Industry Data Firm B | Uses regional ARPU extrapolation and overlooks UK wholesale offsets |
| USD 34.55 B (2024) | Regional Consultancy C | Reports retail streams only, omitting interconnect and leased-line revenues |
The comparison underscores that when scope discipline, data freshness, and dual-path validation align, as they do in Mordor's approach, the resulting baseline proves both transparent and repeatable, providing stakeholders with dependable guidance for strategic choices.


Key Questions Answered in the Report
How large is the UK Telecom MNO Market in 2026?
The UK Telecom MNO Market size stood at USD 31.53 billion in 2026 with a 3.24% CAGR outlook to 2031.
Which service type leads revenue?
Data and internet services held 55.87% of UK Telecom MNO Market share in 2025, driven by rising video and cloud-gaming traffic.
What segment is growing fastest?
IoT and M2M services are projected to expand at a 4.42% CAGR through 2031 as smart-meter roll-outs and connected-device adoption accelerate.
How will enterprise demand shape growth?
Private 5G networks and network-slicing guarantees for manufacturing and healthcare are lifting the enterprises segment at a 3.66% CAGR.
What impact does the Vodafone-Three merger have?
The merger created the largest operator with 28.8 million customers and committed GBP 11 billion to densify 5G, enhancing capacity and scale efficiencies.
Why are energy costs a restraint?
Spectrum fees and a 15-20% jump in electricity tariffs during 2024-2025 increased operating expenses, squeezing EBITDA margins for operators with legacy infrastructure.
Page last updated on:


