Market Overview
| Study Period | 2018 - 2031 |
|---|---|
| Forecast Data Period | 2026 - 2031 |
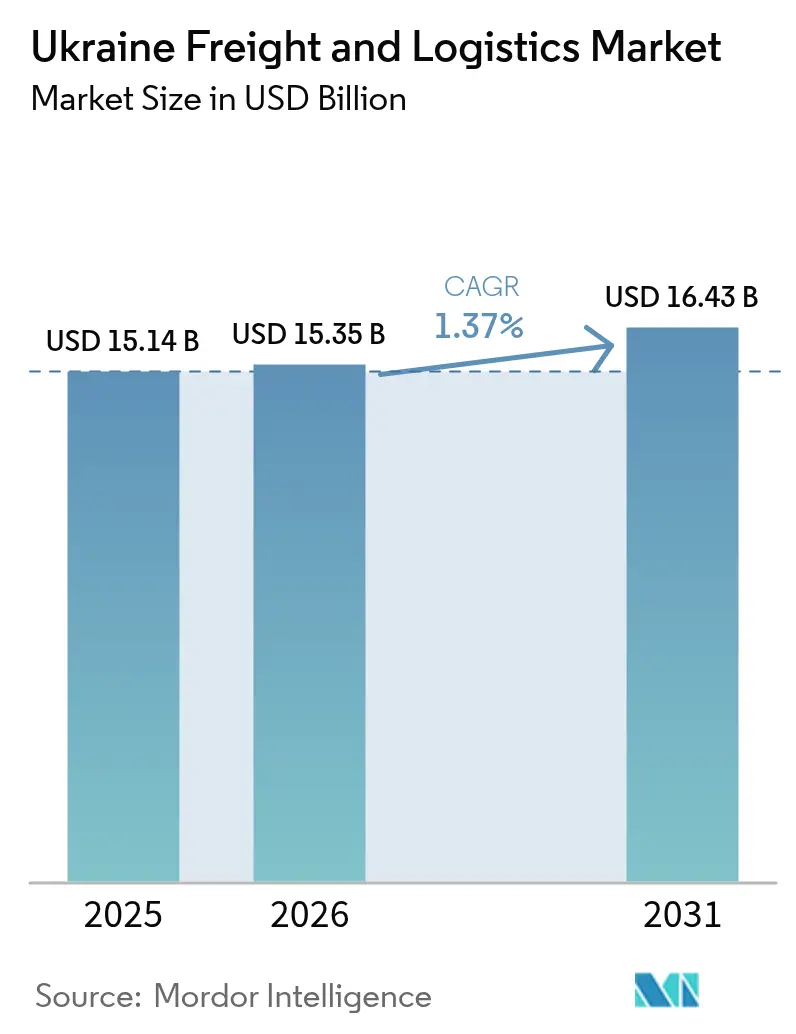
| Base Year Market Size (2025) | USD 15.14 Billion |
| Market Size (2026) | USD 15.35 Billion |
| Market Size (2031) | USD 16.43 Billion |
| Growth Rate (2026 - 2031) | 1.37% CAGR |
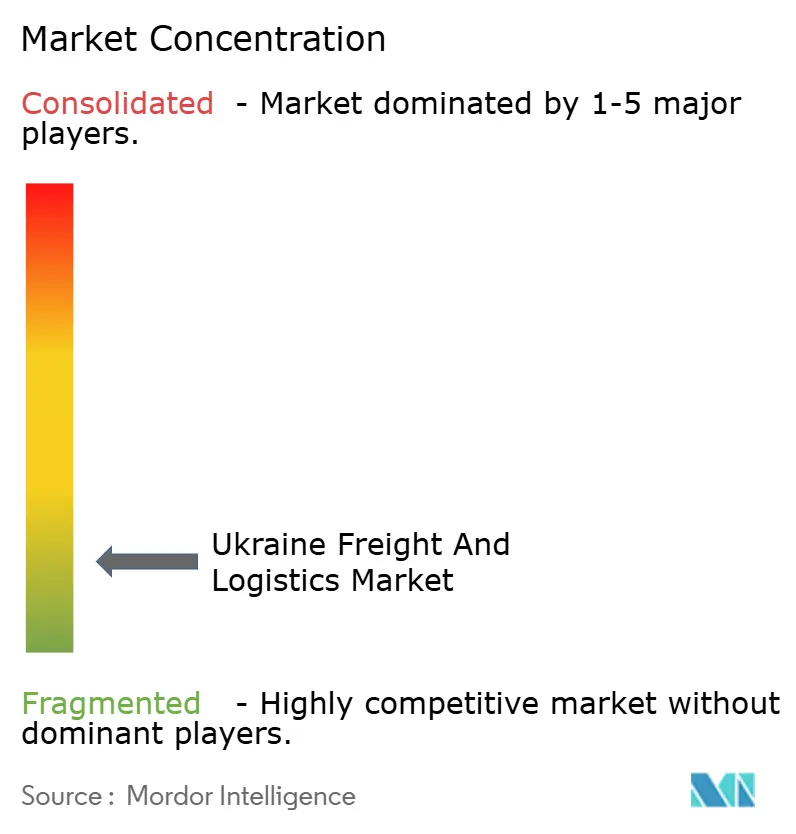
| Market Concentration | Low |
Major Players *Disclaimer: Major Players sorted in no particular order Image © Mordor Intelligence. Reuse requires attribution under CC BY 4.0. | |
Ukraine Freight And Logistics Market Analysis by Mordor Intelligence
The Ukraine freight and logistics market size is expected to grow from USD 15.14 billion in 2025 to USD 15.35 billion in 2026 and is forecast to reach USD 16.43 billion by 2031 at 1.37% CAGR over 2026-2031. Recovered volumes on rail corridors, the reopening of Black Sea lanes, and streamlined EU border procedures underpin this muted yet steady expansion. Freight flows are progressively shifting westward, driven by permit-free road access to the EU, while reconstruction outlays are lifting domestic haulage and warehousing demand. Stabilized war-risk insurance rates, supported by the Unity facility, continue to ease operating costs for shippers. Meanwhile, the government’s Great Construction program and EU-backed Solidarity Lanes are anchoring long-term investment in multimodal infrastructure.
Key Report Takeaways
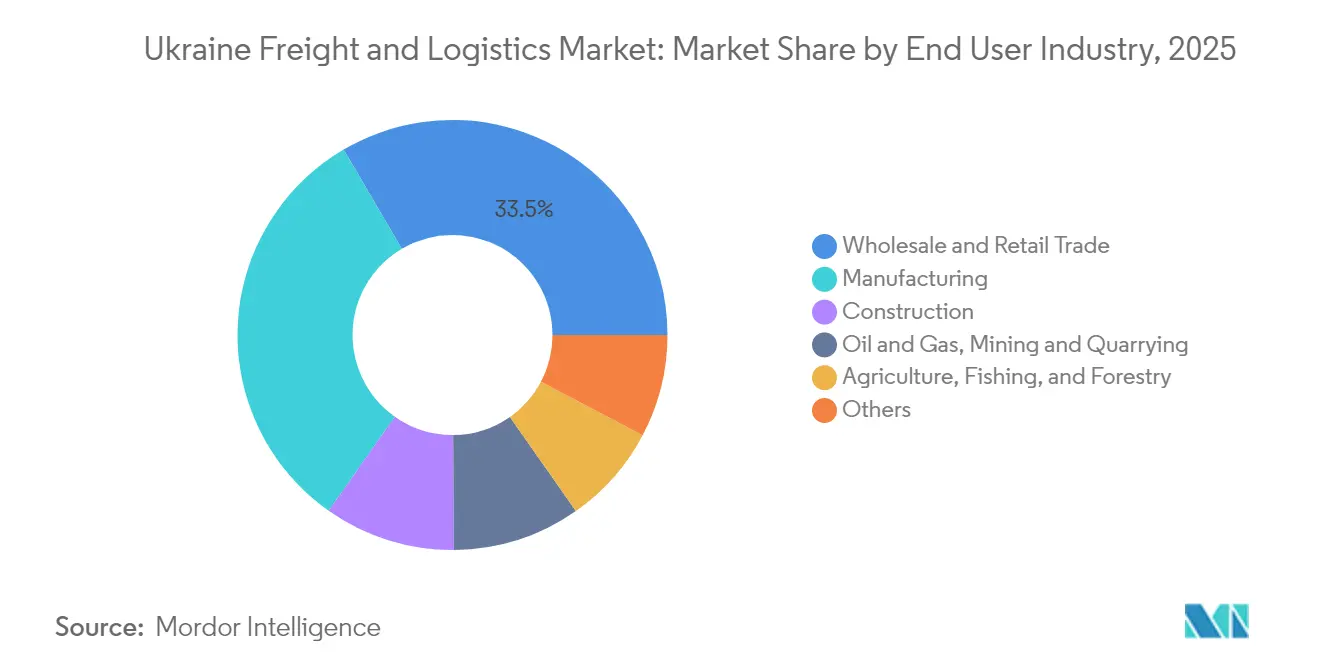
- By end user industry, wholesale and retail trade led with 33.45% of the Ukraine freight and logistics market size in 2025; manufacturing shows the fastest projected growth at 1.56% CAGR between 2026-2031.
- By logistics function, freight transport held 73.78% of the Ukraine freight and logistics market share in 2025, while courier, express, and parcel (CEP) services are projected to grow at a 1.59% CAGR between 2026-2031.
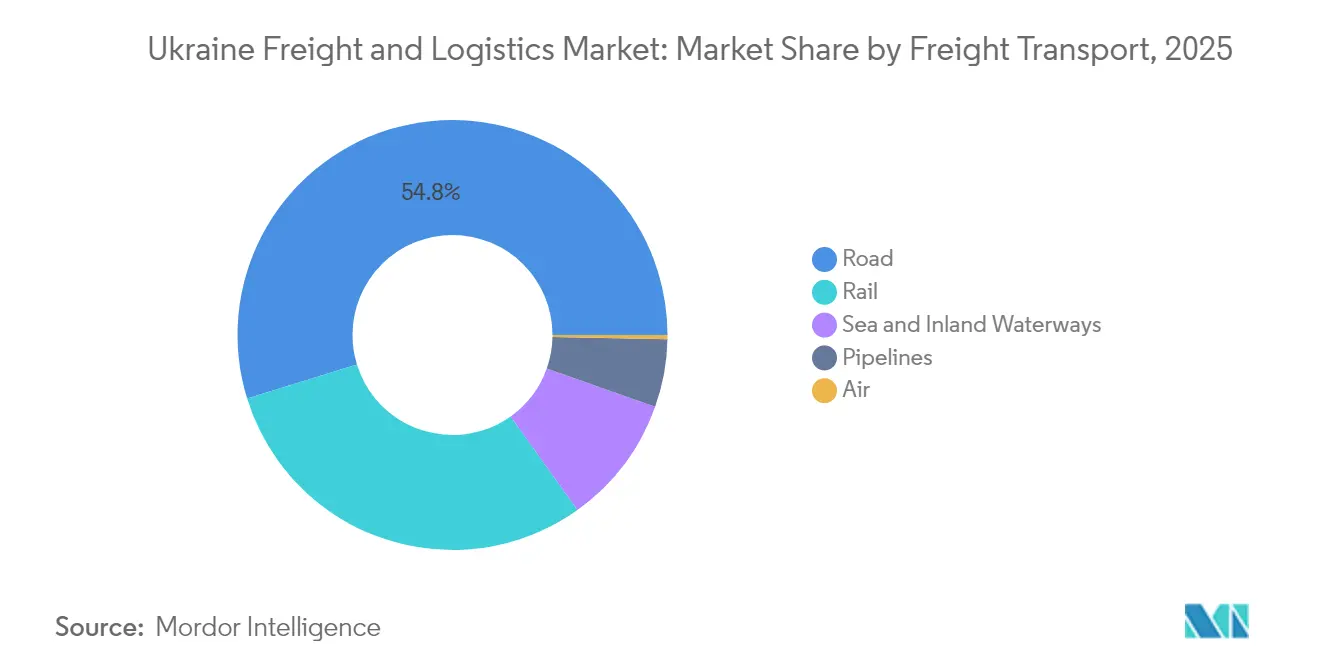
- By freight transport, road freight transport captured 54.78% of revenue share in 2025; sea and inland waterways freight transport are set to expand at a 1.82% CAGR between 2026–2031.
- By CEP destination, domestic routes accounted for 67.72% of revenue share in 2025, yet international services are poised for a 1.66% CAGR between 2026-2031.
- By warehousing and storage, non-temperature controlled facilities dominated with 91.55% revenue share in 2025, while temperature controlled space is set to advance at a 1.31% CAGR between 2026-2031.
- By freight forwarding mode, sea and inland waterways freight forwarding commanded 77.82% of 2025 revenue and are forecast to grow at 1.73% CAGR between 2026-2031.
Note: Market size and forecast figures in this report are generated using Mordor Intelligence’s proprietary estimation framework, updated with the latest available data and insights as of 2026.
Ukraine Freight And Logistics Market Trends and Insights
Drivers Impact Analysis*
| Driver | (~) % Impact on CAGR Forecast | Geographic Relevance | Impact Timeline |
|---|---|---|---|
| EU-Ukraine trade realignment boosting west-bound road freight | +0.4% | Western Ukraine, EU border regions | Medium term (2–4 years) |
| Solidarity Lanes multimodal export corridors accelerating intermodal uptake | +0.3% | EU-Ukraine corridors | Short term (≤ 2 years) |
| Government Great Construction program reviving domestic haulage demand | +0.2% | National | Long term (≥ 4 years) |
| Surge in grain maritime corridor volumes witnessed post-Black Sea Grain Initiative 2.0 | +0.3% | Black Sea region, Danube ports | Medium term (2–4 years) |
| Warehouse space shortage observed in Kyiv and Odesa spawning build-to-suit boom | +0.2% | Kyiv, Odesa metros | Short term (≤ 2 years) |
| EU accession preparation is driving regulatory compliance and infrastructure standardization | +0.2% | National, with priority on EU border corridors | Long term (≥ 4 years) |
| Source: Mordor Intelligence | |||
EU-Ukraine Trade Realignment Boosting West-Bound Road Freight
Permit-free bilateral road haulage introduced in 2022 lifted Ukrainian exports to the EU by 42% and imports by 37% within a year. Monthly outbound loads now surpass 300,000 tons, redirecting flows from Black Sea routes to western crossings. Expanded lanes at border posts cut wagon queues that once stretched to 30 days, and Romania’s fast-tracked Moldova Highway is shortening transit to Baltic and Adriatic ports. EU support through 2025 locks this shift into the long-term structure of the Ukraine freight and logistics market.
Solidarity Lanes Multimodal Export Corridors Accelerating Intermodal Uptake
Since May 2022, these corridors have handled 157 million tons of cargo, equal to EUR 180 billion (USD 198.65 billion) in trade value, and now carry 87% of Ukraine’s imports and 52% of its non-agricultural exports. The European Commission’s EUR 2 billion (USD 2.20 billion) infrastructure envelope is unclogging rail, road, and Danube links, while digital platforms give shippers end-to-end visibility[1]European Commission, “Solidarity Lanes: Two Years On,” transport.ec.europa.eu. As the lanes mesh with the TEN-T backbone, they cement Ukraine’s status as a transit bridge and expand the addressable base of the Ukraine freight and logistics market.
Government “Great Construction” Program Reviving Domestic Haulage Demand
The 2025 transport budget allocates USD 7.37 billion to rebuild roads, bridges, and European-gauge lines[2]World Bank Group, “Ukraine Rapid Damage and Needs Assessment,” worldbank.org. Over 2,000 km of highways have already reopened, spurring heavy-bulk moves of cement, steel, and aggregates. A 63,000 m² dry store and 21,000 m² cold store nearing completion in Lviv underline strong private follow-on capital[3]President of Ukraine, “Head of State Visits Construction of Lviv Logistics Hub,” president.gov.ua. Continuous project flow secures a multi-year freight pipeline that stabilizes the Ukraine freight and logistics market.
Surge in Grain Maritime Corridor Volumes Witnessed Post-Black Sea Grain Initiative 2.0
Self-secured sea lanes restored grain exports to nearly 30 million tons a year, attracting liner calls amounting to 25.1 million deadweight tons (DWT) in Q1 2024. Black Sea ports now process 80% of total exports versus 69% in 2022, after operators such as Nibulon upgraded terminals. Re-enabled ocean legs rekindle forwarder confidence and elevate the maritime component of the Ukraine freight and logistics market.
Restraints Impact Analysis*
| Restraint | (~) % Impact on CAGR Forecast | Geographic Relevance | Impact Timeline |
|---|---|---|---|
| Ukraine's handling capacity diminishes as war-related destruction targets bridges, depots, and port berths | -0.3% | East and South | Medium term (2–4 years) |
| EU bilateral permit caps throttling cross-border trucking capacity | -0.2% | West | Short term (≤ 2 years) |
| High war-risk insurance premiums inflating freight rates | -0.2% | Black Sea | Short term (≤ 2 years) |
| Persistent driver out, migration to EU labor markets creating shortages | -0.2% | National | Long term (≥ 4 years) |
| Source: Mordor Intelligence | |||
Ukraine’s Handling Capacity Diminishes as Destruction Targets Transport Assets
Direct infrastructure losses top USD 176 billion, of which transportation represents USD 78 billion. Strikes have hit 126 rail stations, 500 km of track, and critical berths at Chornomorsk, shrinking daily throughput and forcing costlier detours. Although Ukrainian Railways regularly restores links within weeks, repetitive damage erodes the systemic buffer, limiting upside for the Ukrainian freight and logistics market.
EU Bilateral Permit Caps Throttling Cross-Border Trucking Capacity
Temporary caps on special heavy-haul permits continue to create sporadic shortages at Polish and Slovak gates, stretching dwell times during seasonal surges. While Brussels reviews quota ceilings, forwarders shift excess to rail, pressuring wagon availability and rates. Persistent administrative frictions weigh on the short-term trajectory of the Ukraine freight and logistics market.
*Our forecasts treat driver/restraint impacts as directional, not additive. The impact forecasts reflect baseline growth, mix effects, and variable interactions.
Segment Analysis
By End User Industry: Wholesale Trade Leads Diversified Demand Base
Wholesale and retail trade held 33.45% of 2025 revenue, reflecting Ukraine’s swelling consumer rebound and restock push. Manufacturing, projected at a 1.56% CAGR (2026-2031), accelerates as EU near-shoring programs trigger equipment imports and parts exports. Agriculture continues to supply high tide volumes, while construction freight remains pronounced until at least 2027. Such a blend cushions market swings and cements a balanced demand canvas for the Ukraine freight and logistics market.
International OEMs co-locating plants around Lviv and Rivne rely on bonded warehouses and just-in-time feeds, raising the share of contractual logistics revenues. The resulting sophistication nudges local operators toward quality certifications, ISO 9001, GDP pharma protocols, that match EU peer standards and unlock higher fee tiers.


By Logistics Function: Freight Transport Anchors Market Foundation
Freight transport accounted for 73.78% of the Ukraine freight and logistics market share in 2025, reflecting the country’s heavy exposure to bulk agricultural and reconstruction cargo. The Ukraine freight and logistics market size for Freight Transport is projected to edge up in line with the overall 1.37% CAGR (2026-2031) as restored corridors lift export tonnage. CEP services, though smaller, ride surging e-commerce volumes and expanded international routes, showing the strongest growth at 1.59% CAGR (2026-2031). Freight forwarding and warehousing, and storage continue to formalize, spurred by EU customs alignment and digital visibility mandates. Private operators such as Nova Poshta doubled 2024 capital budgets, while Ukrainian Railways’ variable-gauge bogies cut two-hour border swaps to minutes, sharpening intermodal competitiveness.
Second, the segment is expanding its value chain depth. Shippers are increasingly outsourcing load planning, customs brokerage, and last-mile delivery, pushing local firms to add integrated offerings. Foreign carriers enter through joint ventures, seeking partner knowledge on security protocols and domestic road permits. Over the outlook, diversified service menus position Ukrainian providers to match EU 3PL standards, embedding them deeper into continental supply chains.
By Courier, Express, and Parcel (CEP): International Services Accelerate Cross-Border Integration
Domestic parcels made up 67.72% of 2025 CEP revenue, driven by reconstruction supplies and everyday consumer deliveries. International shipments, however, show a higher 1.66% CAGR between 2026-2031 as EU duty suspensions and marketplace links escalate B2C exports. Nova Poshta’s Khmelnytsky terminal sorts 8,500 parcels an hour and feeds a 200-country partner network, illustrating scale economies in outbound flows. Lower de-minimis thresholds in the EU push Ukrainian sellers to use professional brokers, deepening parcel logistics sophistication within the Ukraine freight and logistics market.
The e-commerce surge ripples through to value-added services like cash-on-delivery handling, returns processing, and customs prep. Providers bundle these extras to defend their margins against price-centric rivals. Over time, international CEP margins are set to narrow, yet volumes should keep the segment growing faster than the broader Ukraine freight and logistics industry.
By Warehousing and Storage: Cold Chain Infrastructure Drives Premium Growth
Non-temperature controlled still occupy 91.55% of segment revenue in 2025, but market vacancy sits below 3% in Kyiv and Odesa. Temperature-controlled capacity is rising at a 1.31% CAGR (2026-2031), fed by stringent EU food safety rules and the rebound of pharmaceutical imports. Developers now add backup generators and IoT sensors by default, guarding perishables from power disruptions. The Ukraine freight and logistics market size for cold storage gains a further lift from multinational grocers that require HACCP-compliant distribution hubs.
Rental spreads remain wide: chilled space in Kyiv commands USD 9 per m² a month versus USD 5 per m² for dry. Landlords thus prefer mixed-use parks, layering higher-yield cold rooms atop bulk racking. This premium niche will keep drawing inward FDI, especially as agribusiness exporters chase value retention through processed goods.
By Freight Transport: Road Networks Drive Modal Integration
Road freight transport held 54.78% of revenue in 2025, underpinned by flexibility and abundant 3.2-ton pickups that bridge fractured rail links. Sea and Inland Waterways, helped by reopened Black Sea lanes, are forecast to climb at 1.82% CAGR (2026-2031), the fastest across modes. The Ukraine freight and logistics market size for maritime legs is buoyed by reduced war-risk premiums following the Unity cover and steady grain off-take commitments. Rail remains vital for bulk ores but suffers from strike damage; European-gauge rollouts should recapture part of the lost share beyond 2026.
Cost convergence is evident; 2024 road spot prices averaged USD 0.110 per ton-km, only three times rail’s USD 0.029 per ton-km, yet faster amid dynamic lane closures. Logistics planners increasingly select hybrid rail-road runs—loaders dispatch north-south by wagon and finish the final 120 km by truck, to balance cost and reliability. Such blending underscores a future in which the Ukraine freight and logistics market optimizes mode selection rather than relying on single-channel dominance.
By Freight Forwarding: Maritime Corridors Dominate International Trade
Sea and inland waterways freight forwarding represented 77.82% of forwarding revenue in 2025 and are on course for a 1.73% CAGR between 2026-2031. The Ukraine freight and logistics market benefits from the Unity insurance program that slashes premium add-ons on Black Sea sailings. Forwarders package through bills that link Danube barges, deep-sea feeders, and west-bound rail shuttles. Air forwarding lags given airspace limits, though niche charters continue for high-tech spares.
Market leaders invest in blockchain-backed document flows, cutting dwell time at Constanța by 18 hours per consignment. Customs e-seal pilots on Poland lanes further compress cycle times, signaling a tech-centred arms race that will re-rank forwarders based on digital enablement rather than asset count.
Geography Analysis
Kyiv remains the single-largest logistics node, orchestrating domestic replenishment and serving as the nerve center for intermodal dispatch. Its ring road depots feed most population clusters within 24 hours, anchoring national distribution efficiency. Western provinces, Lviv, Volyn, Zakarpattia, have gained weight as entry doors to the EU; road and rail links funnel 60% of outbound tonnage through these crossings in 2025. The West’s relative security draws new warehouses, redundant data centers, and customer service hubs, insulating supply chains from frontline risk.
The Odesa region safeguards maritime capacity. Port output in 2024 rose 77%, handling 133,000 TEU and restoring 80% of 2021 throughput despite sporadic missile alerts. Danube delta upgrades, financed under the Solidarity Lanes plan, broaden draft limits and enable barges to bypass mined coastal lanes. Eastern oblasts, though damaged, witness gradual rail reopenings that revive metallurgical shipments toward EU steel mills, yet capacity there remains below half of 2021 levels.
Regional policy favors multimodal nodes that knit road, rail, and river. Rivne’s planned tri-modal park will slot 12 daily broad-gauge trains into EU truck fleets, slicing transit to Polish ports by 30 hours. Such hubs accelerate the geographic pivot of the Ukraine freight and logistics market toward European-facing corridors and away from legacy east-west pipelines.
Competitive Landscape
Competition remains fragmented; however, the top five operators together hold a significant revenue share. Domestic champions such as Nova Poshta, Ukrposhta, and Ukrainian Railways compete alongside multinationals Raben, Maersk, and DB Schenker. The fight has moved from price to resilience; customers prize guaranteed lift capacity, live-tracking, and war-risk mitigation. Leaders responded by embedding satellite-linked fleet monitors, redundant border depots, and pooled marine insurance.
Technology is a prime differentiator. Ukrainian Railways introduced automatic gauge-changing wheelsets that remove border bogie swaps, saving eight hours per train and raising competitiveness on Kyiv–Katowice lanes[4]Ukrainian Railways, “Variable Gauge Wheelset Deployment Update,” railwaygazette.com. Nova Poshta’s robotics-driven Khmelnytsky terminal cuts parcel touchpoints to two, halving sort errors. Strategic tie-ups abound: Raben partnered with a local 3PL for cross-dock control at Lviv, while Maersk opened a block-train service from Odesa to Prague, bundling customs under a single invoice.
Foreign entrants prefer asset-light models, joint ventures, and agency tie-ups to hedge operational risk. Access to Unity-backed insurance presents a key moat; providers able to secure cover win volumes otherwise priced off the water. Over 2025–2030, further consolidation is likely as operators seek scale to amortize compliance costs and fund digital capex, steadily professionalizing the Ukraine freight and logistics market.
Ukraine Freight And Logistics Industry Leaders
Ukrainian Railways (Ukrzaliznytsia)
NOVA Group (Nova Post LLC)
Ukrposhta
DSV A/S (incl. DB Schenker)
A.P. Moller – Maersk
- *Disclaimer: Major Players sorted in no particular order

Recent Industry Developments
- January 2025: Raben Group reported EUR 2.15 billion (USD 2.37 billion) global revenue for 2024 and confirmed sustained Ukraine haulage despite disruptions, leveraging alternate Danube gateways.
- December 2024: Maersk outlined its resilience strategy, citing flexible network design and Ukraine corridor diversification as templates for high-risk markets.
- October 2024: Nova Poshta doubled its 2024 capex to UAH 8.5 billion (USD 221.65 million), expanding sorting capacity and global partner links.
- May 2024: FedEx reinstated parcel services to Ukraine, marking a milestone in restoring international CEP connectivity.


Research Methodology Framework and Report Scope
Market Definitions and Key Coverage
Our study defines the Ukraine freight and logistics market as all revenue earned inside the country from moving goods, road, rail, air, sea, and inland waterways, pipelines, plus freight forwarding, courier, express, parcel (CEP), third-party warehousing, and associated contract logistics activities (customs brokerage, last-mile delivery). Values are in current-year USD.
Scope exclusion: Passenger transport, infrastructure construction spend, and purely retail postal services are outside this study.
Segmentation Overview
- End User Industry
- Agriculture, Fishing, and Forestry
- Construction
- Manufacturing
- Oil and Gas, Mining and Quarrying
- Wholesale and Retail Trade
- Others
- Logistics Function
- Courier, Express, and Parcel (CEP)
- By Destination Type
- Domestic
- International
- By Destination Type
- Freight Forwarding
- By Mode of Transport
- Air
- Sea and Inland Waterways
- Others
- By Mode of Transport
- Freight Transport
- By Mode of Transport
- Air
- Pipelines
- Rail
- Road
- Sea and Inland Waterways
- By Mode of Transport
- Warehousing and Storage
- By Temperature Control
- Non-Temperature Controlled
- Temperature Controlled
- By Temperature Control
- Other Services
- Courier, Express, and Parcel (CEP)
Detailed Research Methodology and Data Validation
Primary Research
Mordor analysts held structured conversations and short surveys with freight forwarders, port authorities in Odesa and Izmail, rail executives, CEP networks, and major importers across Kyiv, Lviv, and Dnipro. These exchanges validated modal shares, typical yield factors, and capacity restoration timelines, closing information gaps left by desk work.
Desk Research
We built the first demand-supply picture from tier-1 public sources such as the State Statistics Service of Ukraine, State Customs Service shipment data, Eurostat transport registers, World Bank LPI tables, and IMF macro forecasts. Trade updates from Interfax-Ukraine, Kyiv Independent, and industry association bulletins clarified tariff swings and corridor reopenings, while D&B Hoovers, Dow Jones Factiva, and company 10-Ks supplied operator-level revenue splits and fleet counts. The sources listed are illustrative; many additional datasets were consulted to confirm and contextualize figures.
Market-Sizing & Forecasting
A top-down build starts from transport and storage gross value added, external trade service receipts, and tonne-kilometer flows, which are then converted to revenue using mode-specific yield factors. Bottom-up checks, operator turnover roll-ups, and sampled ASP x volume calculations stress-test the totals. Key inputs include diesel prices, reconstruction-driven cement and steel import tonnage, e-commerce parcel volume, rail-to-road transit time differentials, and daily corridor throughput. A multivariate regression, complemented by scenario analysis around corridor availability and currency stability, projects the market to 2030; missing firm data are imputed from peers with a similar fleet mix before final triangulation.
Data Validation & Update Cycle
Outputs undergo variance checks against historical series, independent cost indices, and peer disclosures, followed by dual-layer analyst reviews. We refresh models annually, with interim updates triggered by material events such as corridor reopening, subsidy changes, or +/-10% diesel price swings.
Why Mordor's Ukraine Freight And Logistics Baseline Commands Reliability
Published estimates often diverge because they mix unlike service baskets, FX bases, or refresh cadences.
Mordor's disciplined scope, live corridor tracking, and annual primary data refresh narrow these gaps and give decision-makers a dependable starting point.
Benchmark comparison
| Market Size | Anonymized source | Primary gap driver |
|---|---|---|
| USD 15.14 B (2025) | Mordor Intelligence | - |
| USD 6.24 B (2024) | Global Consultancy A | Excludes warehousing and CEP; uses pre-reopening corridor data; constant 2022 FX |
| USD 6.10 B (2024) | Industry Publication B | Limits scope to freight transport only; omits forwarding margin; conservative e-commerce growth |
The comparison shows how broader coverage, fresher assumptions, and cross-checks against operator ledgers enable Mordor Intelligence to deliver a balanced, transparent baseline that clients can trace and reproduce with confidence.


Key Questions Answered in the Report
What is the current value of the Ukraine freight and logistics market?
The Ukraine freight and logistics market is valued at USD 15.35 billion in 2026 and is projected to reach USD 16.43 billion by 2031.
Which logistics function holds the largest market share?
Freight Transport dominates with 73.78% of the Ukraine freight and logistics market share in 2025.
Why are Sea and Inland Waterways the fastest-growing freight transport mode?
Reopened Black Sea lanes, reduced war-risk premiums, and rising grain exports support a 1.82% CAGR (2026-2031) for maritime and inland waterway transport.
How is EU integration affecting Ukrainian logistics?
Permit-free road access, Solidarity Lanes funding, and EU standard-gauge rail upgrades are realigning freight westward and embedding Ukraine into European supply chains.
What segments show the strongest future growth?
Courier, Express, and Parcel (CEP) services and temperature-controlled warehousing lead segment growth, driven by e-commerce expansion and stricter EU food-safety requirements.
How are war-risk insurance premiums influencing freight costs?
The Unity facility now covers all non-military cargo, trimming premiums and allowing Ukrainian shippers to price ocean and road moves closer to pre-war levels.
Page last updated on:


