
Toasters Market Size and Share
Market Overview
| Study Period | 2020 - 2031 |
|---|---|
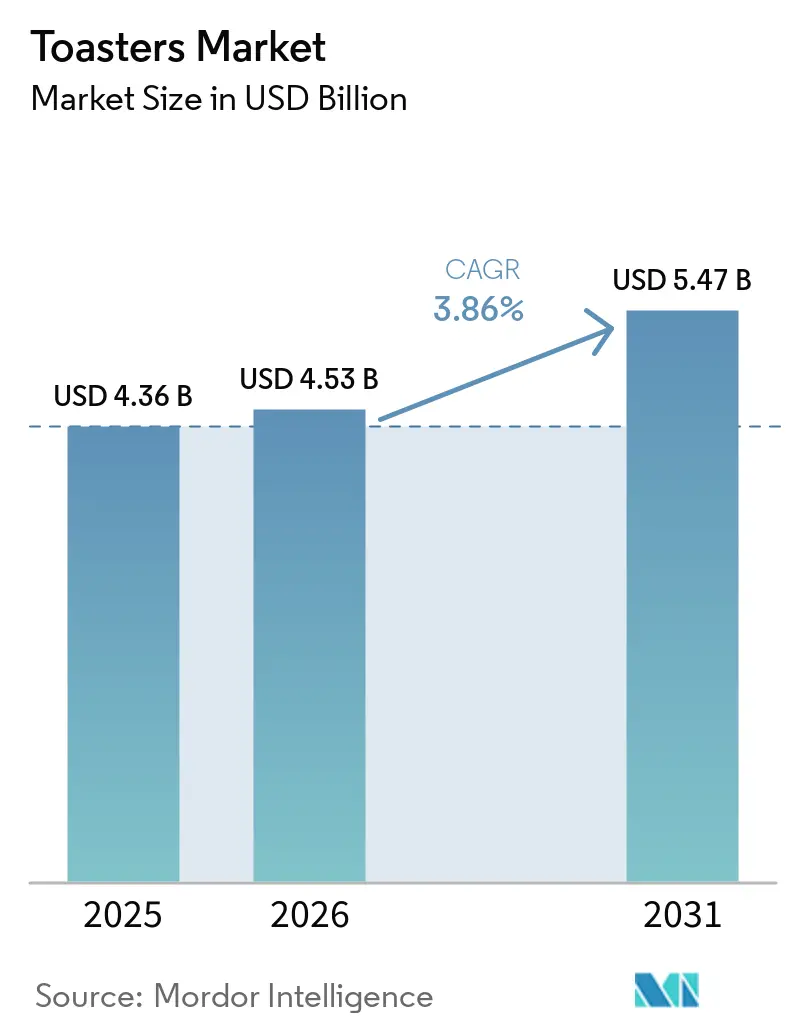
| Market Size (2026) | USD 4.53 Billion |
| Market Size (2031) | USD 5.47 Billion |
| Growth Rate (2026 - 2031) | 3.86 % |
| Fastest Growing Market | Middle East and Africa |
| Largest Market | Asia Pacific |
| Market Concentration | Medium |
Major Players *Disclaimer: Major Players sorted in no particular order Image © Mordor Intelligence. Reuse requires attribution under CC BY 4.0. | |
Toasters Market Analysis by Mordor Intelligence
Toaster market size in 2026 is estimated at USD 4.53 billion, growing from 2025 value of USD 4.36 billion with 2031 projections showing USD 5.47 billion, growing at 3.86% CAGR over 2026-2031. Growth rests more on product innovation than on first-time ownership, as buyers shift toward smart connectivity functions, energy-saving performance, and design aesthetics that fit compact urban kitchens. Pop-up toasters still command the largest slice of the toaster market, yet smart variants are turning into a meaningful profit generator because they fetch premium prices and deepen brand stickiness through IoT ecosystems. Commercial food-service chains are accelerating equipment upgrades, bolstering demand for high-throughput conveyor styles and >1,200 W models that keep pace with breakfast rush volumes. Meanwhile, e-commerce penetration is redrawing the retail map, giving brands a direct line to consumers and a data loop that informs rapid feature iterations. On the cost side, raw-material volatility and trade-policy tariffs squeeze margins, pushing manufacturers to re-engineer sourcing footprints and lock in strategic steel and electronics contracts [1].
Key Report Takeaways
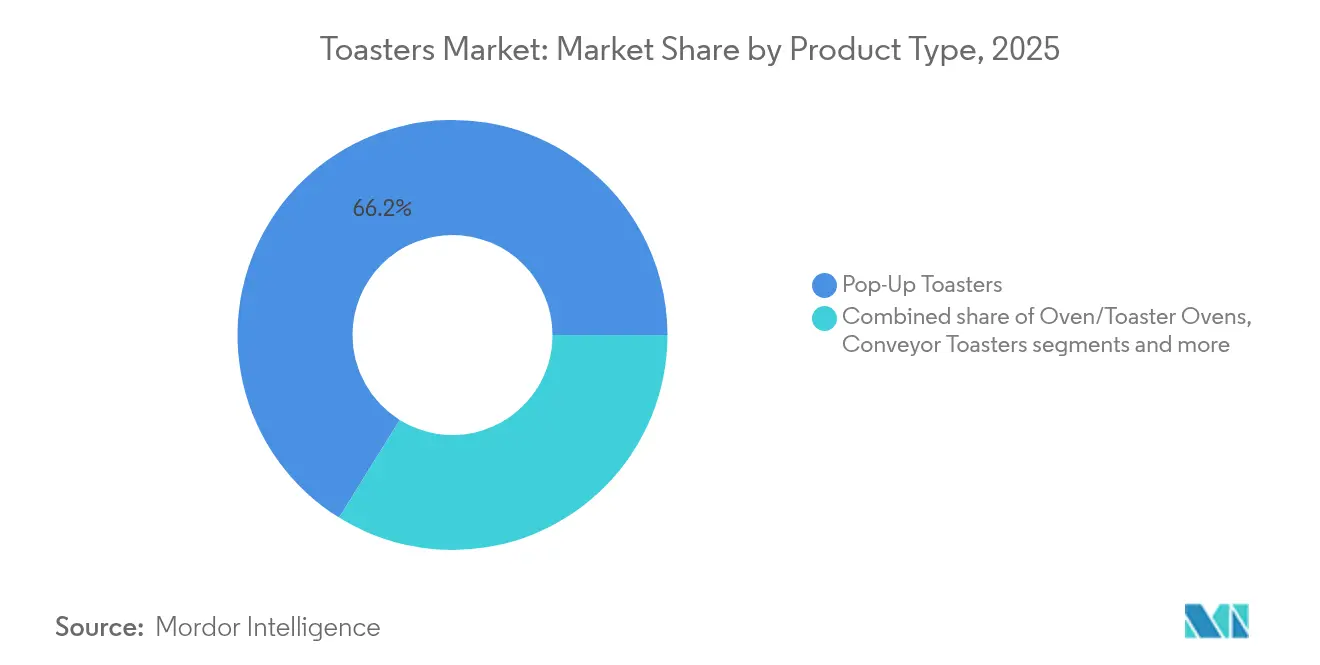
- By product type, pop-up units held 66.15% of the toaster market share in 2025, while smart/connected models are projected to post the fastest 7.62% CAGR through 2031.
- By slice capacity, 2-slice designs accounted for 52.06% share of the toaster market size in 2025; the >4-slice class is set to expand at a 4.83% CAGR over 2026-2031.
- By end-use, residential buyers represented 70.70% of the toaster market revenue in 2025; commercial outlets will record the highest 5.78% CAGR to 2031.
- By wattage, the 801-1,200 W bracket captured 47.05% of the toaster market size in 2025, while >1,200 W systems led growth at a 4.05% CAGR.
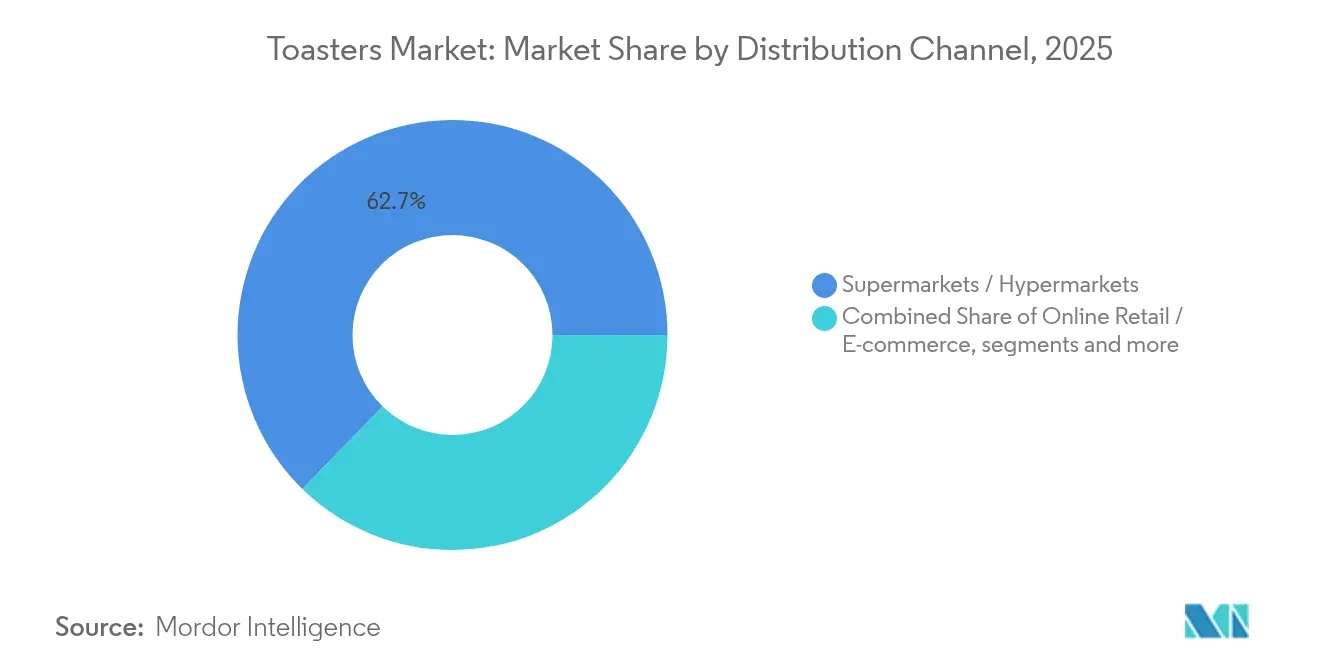
- By distribution channel, supermarkets/hypermarkets dominated with 62.70% in 2025; online retail is the fastest riser at a 8.76% CAGR through 2031.
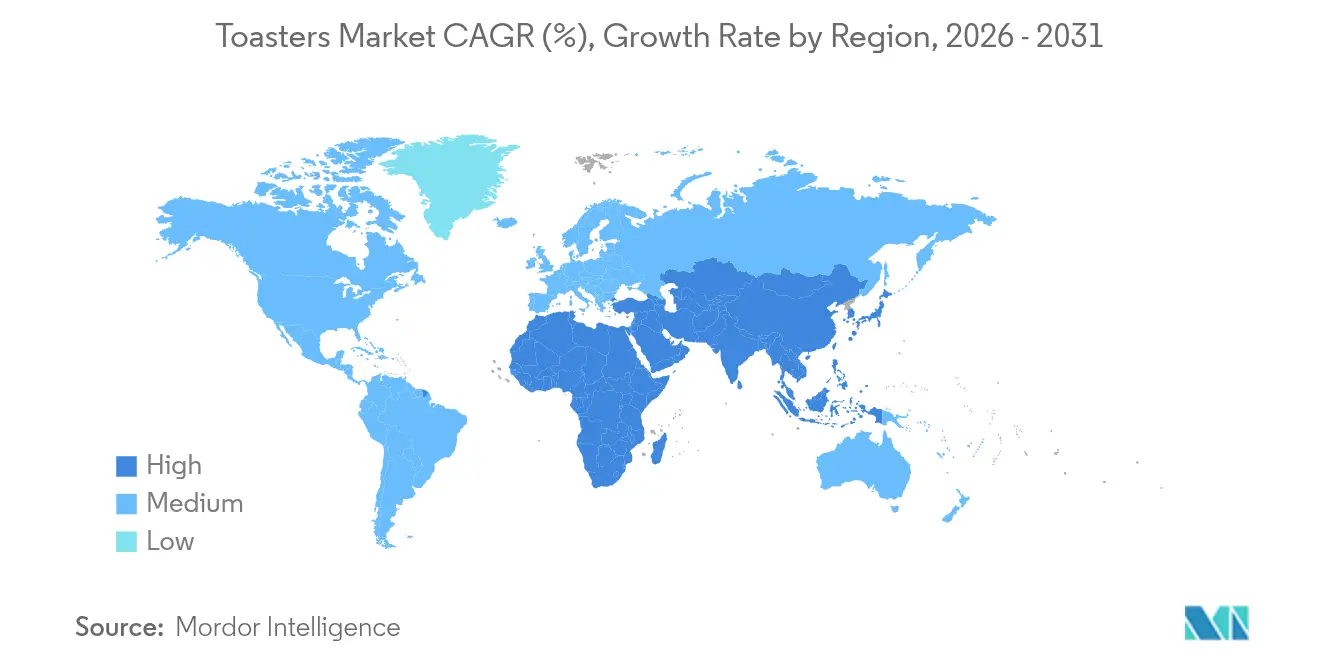
- By geography, Asia-Pacific led with 36.85% revenue in 2025; the Middle East & Africa region is forecast to log a 4.92% CAGR to 2031.
Note: Market size and forecast figures in this report are generated using Mordor Intelligence’s proprietary estimation framework, updated with the latest available data and insights as of 2026.
Market Trends and Insights
Drivers Impact Analysis of Toasters Market*
| Driver | (≈) % Impact on CAGR Forecast | Geographic Relevance | Impact Timeline |
|---|---|---|---|
| Urban millennials demand for compact countertop appliances | +0.8% | North America & Asia-Pacific urban centres | Medium term (2-4 years) |
| Artisan bread & specialty breakfast momentum | +0.6% | North America & Europe, emerging in premium APAC tiers | Long term (≥ 4 years) |
| Smart connectivity and IoT integration | +1.2% | Early adoption in North America & Europe, rapid scaling in APAC | Medium term (2-4 years) |
| Expansion of QSR & bakery chains | +0.9% | APAC & MEA hot spots, global chains | Long term (≥ 4 years) |
| Growth in E-commerce Driving Direct-to-Consumer Appliance Market Expansion | +0.7% | Global Growth Dominated by North America and Europe, with Increasing Penetration in APAC | Short term (≤ 2 years) |
| Energy-Efficient Eco-design Regulations Stimulating Replacement Demand | +0.5% | Europe as the Primary Market, with Growth Extending to North America and Developed APAC Regions | Long term (≥ 4 years) |
| Source: Mordor Intelligence | |||
Urban millennials' demand for compact countertop appliances
Two-slice models dominate at 52.50% market share because city residents pursue appliances that occupy minimal counter space yet suit contemporary kitchen decor. Smaller household sizes heighten demand for compact gear that still promises professional-grade performance. In India, brands positioned around value-rich small electronics grew 13.0% between 2019-2024, overtaking broader small-appliance averages, indicating a durable lens on design size and cost. Brands that merge sleek silhouettes with app-based browsing presets translate this spatial pressure into profitable premium add-ons. As real-estate costs keep climbing, the link between square-inch efficiency and purchasing propensity remains strong across developed and emerging megacities.
Surge in artisan bread & specialty breakfast consumption worldwide
Global appetite for buns and rolls reached USD 19.80 billion in 2024, with niche specialty rolls soaring 39.70% to USD 211.8 million, underscoring a pivot toward premium breakfast indulgence [2]. Toasters must now accommodate thicker slices, uneven crusts, and variable moisture content, a shift that favours wide-slot designs and toaster-oven hybrids. Restaurants and campus cafeterias respond by installing conveyor equipment that outputs up to 450 slices per hour, avoiding queue bottlenecks at peak morning hours. For manufacturers, educating users about setting profiles for sourdough, brioche, or gluten-free loaves becomes an aftermarket service that cements loyalty.
Smart connectivity and IoT integration
Smart-home adoption has pushed awareness of connected appliances to 9%, yet penetration lags, signifying a sizeable conversion runway. The fastest-growing slice in the toaster market is smart units, riding a 7.94% CAGR. Features such as remote start, auto-reordering of replacement parts, and firmware updates that refine browning algorithms keep products relevant post-sale. Tineco’s Toasty One introduces an LCD interface and IntelliHeat™ sensors that self-adjust per slice density, illustrating the leap toward data-driven cook cycles. To sustain appeal, manufacturers must pair advanced functionality with airtight data-privacy pledges and minimal setup friction.
Expansion of QSR & bakery chains globally
Food-service operators are modernizing their kitchens to cater to the fast-paced breakfast crowd. Meanwhile, energy-efficient conveyor models, validated by controlled utility pilots, are helping to reduce operating costs. Global QSR outlets and hotel breakfast buffets treat consistent toasting speed as a brand standard, making replacement cycles shorter than in homes. Commercial demand runs at a 6.04% CAGR—nearly double residential—cementing a high-margin sales pillar. Manufacturers offering training, overnight parts delivery, and predictive maintenance analytics gain a decisive edge in multistore roll-outs.
Restraints Impact Analysis of Toasters Market*
| Restraint | (≈) % Impact on CAGR Forecast | Geographic Relevance | Impact Timeline |
|---|---|---|---|
| Competition from multifunctional air fry ovens | −1.1% | North America & Europe | Short term (≤ 2 years) |
| Volatile stainless-steel & electronics pricing | −0.7% | China & Turkey manufacturing hubs | Medium term (2-4 years) |
| Frequent safety recalls | −0.4% | North America & Europe | Short term (≤ 2 years) |
| Trade-policy tariffs on cross-border shipments | −0.6% | US-China and EU-Asia routes | Medium term (2-4 years) |
| Source: Mordor Intelligence | |||
Volatility in stainless steel & electronic component prices
In March 2025, the United States implemented a 25% tariff on imported steel and aluminum, significantly increasing material costs and potentially driving retail appliance prices up by as much as 31% [3]. Simultaneously, semiconductor shortages have escalated costs for smart-ready control boards, resulting in prolonged quoting cycles and heightened stockpiling efforts. Manufacturers are addressing these challenges through multi-year metal hedging agreements and modular PCB designs that support interchangeable chips without requiring software modifications. Despite these measures, profit margins remain under pressure, which could hinder the adoption of premium features. Small businesses have raised substantial concerns regarding the impact of tariffs on supply chains and operational costs, with many indicating that tariffs on components unavailable from domestic manufacturers make onshoring production economically unviable. To mitigate price volatility, manufacturers are implementing strategic sourcing strategies and securing long-term supplier agreements. Some are also evaluating vertical integration of critical component production to reduce reliance on external suppliers and achieve cost stability. In response to pricing pressures, manufacturers are optimizing their product portfolios by discontinuing low-margin offerings and prioritizing premium features that justify higher retail prices, enabling them to offset increased material expenses.
Frequent safety recalls leading to consumer skepticism
Product safety incidents generate significant ripple effects, impacting not only immediate recall expenses but also reshaping consumer purchasing patterns and brand loyalty dynamics within the small appliance market. Consumer skepticism is particularly evident in the adoption of smart toasters, where connectivity features amplify concerns related to cybersecurity risks, data privacy, and potential remote malfunctions that could compromise household safety. The 2024 Product Safety and Recall Directory highlights the industry's shift toward stricter safety standards, requiring manufacturers to comply with sustainability regulations and heightened consumer expectations for reliable products. Companies with established safety credentials and advanced testing capabilities are increasingly gaining a competitive advantage, creating significant entry barriers for new players lacking robust safety validation frameworks.
*Our forecasts treat driver/restraint impacts as directional, not additive. The impact forecasts reflect baseline growth, mix effects, and variable interactions.
Toasters Market Segment Analysis
By Product Type:
Smart Features Drive Premium PositioningPop-up variants, with a 66.15% share, anchor the toaster market through dependable one-task excellence. Smart/connected models, posting a 7.62% CAGR, capture appetites for automation as busy households leverage app-driven presets to avoid under- or over-browning. Oven-style hybrids compete on versatility, while conveyor lines dominate institutional dining halls that crave 450-slice-per-hour throughput. Product roadmaps emphasize firmware-upgradable heating curves and AI-based crumb detection that cues users to clean trays—an add-on that subtly reduces warranty claims. For entry-level tiers, brushed-steel aesthetic upgrades at minimal cost keep traditional pop-ups relevant to style-conscious shoppers.
In parallel, compliance with EU Ecodesign directives forces power-management refinements even on simple thermostat architectures. Brands injecting Bluetooth or Wi-Fi modules now pair them with power-throttling chips that cap standby draw below 0.5 W, guarding both regulation readiness and eco-brand equity. As a result, manufacturers juggle cost trade-offs between network modules and premium alloy casings while chasing similar price points, making supply-chain orchestration a decisive competitive weapon in the product-type race.

By Slice Capacity:
Compact Living Drives 2-Slice DominanceResidential densification cements 2-slice units at a commanding 52.06% stake of toaster market share, yet the >4-slice grouping is predicted to notch a 4.83% CAGR. Makers position wide-slot 2-slice designs as the style icons for singles and couples, loading them with digital displays and glass-panel sides that showcase internal browning, adding experiential value without ballooning footprint.
Bulk-slice categories increasingly integrate programmable lift mechanisms that drop bread automatically as soon as infrared sensors detect free slots, a productivity cue for on-the-go family routines. Commercial buyers prefer adjustable speed belts in conveyor versions over capacity-per-batch metrics, allowing dynamic adjustment during lull periods to save energy. Each capacity tier thus reflects distinct triggers—spatial, demographic, or throughput—that shape marketing and engineering priorities.
By End-Use:
Commercial Segment Accelerates GrowthAlthough households still account for 70.70% of turnover, residential toaster ovens appeal to consumers seeking greater versatility, while cafés, hotels, and QSRs remain the growth locomotive, rising 5.78% annually to 2031. This commercial uptick is partly a by-product of brand-standardization initiatives across global chains, where each new store births a multi-unit equipment order. The toaster market size pegged to institutional food-service contracts is therefore resilient to consumer sentiment swings, thanks to multi-year capital-expenditure plans locked into franchise agreements.
Operators emphasize the importance of durable stainless chassis designed to withstand extensive usage before requiring maintenance. They also secure service-level agreements that ensure part replacements within a short timeframe. Manufacturers incorporating remote diagnostics into smart commercial units effectively minimize unplanned downtime, delivering measurable value that supports premium pricing over traditional models. This market dynamic drives a bifurcation, with one segment targeting cost-conscious household consumers and the other addressing the needs of performance-driven food-service professionals.
By Wattage Range:
Mid-Range Models Balance Performance and EfficiencyUnits rated 801-1,200 W own 47.05% of revenue because they toast in two minutes while holding monthly energy draw in check. Conversely, >1,200 W models, favoured by canteens and pastry stations, are projected to grow 4.05% per year. Lower-wattage (≤800 W) models still sell in markets with erratic voltage supply or subsidy programs that cap appliance-level power to ease grid strain. The toaster market share for the mid-range band remains secure, yet premium buyers pivot toward watt-density: faster cycles per kilowatt-hour.
Suppliers adopt nichrome elements with optimized coil spacing to hit the sweet spot between surface temperature and emissivity, squeezing more toast cycles out of every kilowatt consumed. Regulatory tailwinds also drive wattage strategies, as EU and California codes penalize idle consumption, nudging firms to integrate auto-sleep algorithms that cut heating seconds once bread sensors read optimal crust colour.
By Distribution Channel:
E-commerce Transforms Retail LandscapeBrick-and-mortar supermarkets/hypermarkets maintain 62.70% presence, buoyed by shoppers who still favour tactile assessment and impulse bundling with other kitchen goods. Yet online portals are scaling at a 8.76% CAGR as improved last-mile logistics and free-return policies erode hesitation over breakage risk. The toaster market size flowing through direct-to-consumer web shops is forecast to almost double by 2031, a pace that outstrips any other channel.
Brand-owned stores on marketplace platforms mine clickstream data to refine feature sets, spawning micro-iterations such as gluten-free buttons in regions where search queries spike. Subscription models for crumb-tray refills or cleaning kits create post-purchase engagement hooks that traditional retail cannot replicate. Physical retail is not static either; immersive experience zones let customers test IoT ecosystems on demo counters, linking offline discovery to online transactions for higher cart values.
Geography Analysis
APAC Toasters Market
Asia-Pacific, with 36.85% of global revenue in 2025, mixes robust domestic demand with export-oriented production clusters. China's commercial kitchen-equipment market is experiencing significant annual growth, fueled by the rapid expansion of domestic quick-service restaurant (QSR) chains and government-backed technology subsidies aimed at enhancing automation in kitchen operations. Concurrently, India's small electronics market is demonstrating strong performance, driven by value-focused product offerings. The country's robust e-commerce ecosystem is accelerating consumer adoption of advanced devices, transitioning from basic models to feature-rich, app-integrated appliances. Japanese brands champion precision and longevity; Panasonic’s 25-year FlashXpress line shows how incremental feature updates keep a legacy SKU culturally relevant across decades. Regional governments push energy-efficiency labeling, giving compliant models prime real estate on leading online portals.
North America Toasters Market
North America exhibits replacement-led dynamics. Households swap aging units to tap smart-home orchestrations, and utilities dangle rebates for Energy Star-certified countertop appliances. US e-commerce hit USD 1.19 trillion in 2024, representing a fertile ground for D2C launches that skip big-box aisles entirely. Canada and Mexico round out the NAFTA corridor with a shared supply-chain backbone that eases cross-border SKU harmonization. Hamilton Beach, the unit-sales leader, grew 4.6% to USD 654.7 million in 2024 by broadening kitchen-appliance bundles aimed at college students and assisted-living facilities—a testament to demographic segmentation in saturated markets.
Europe Toasters Market
Europe ranks third but sets the tone for sustainability. From 2025, Ecodesign rules compel reparability scoring and energy labeling on almost every small-appliance SKU, catalyzing a replacement cycle among eco-aware consumers. Beko Europe, the newly merged Arçelik-Whirlpool platform, consolidates factories to hit cost targets while promising spare-part availability for 15 years, aligning with the right-to-repair ethos. Regional marketing pivots on lifecycle carbon claims, and QR-code digital passports guide recyclers at end-of-life. As a result, premium green-tech models enjoy shelf privilege in German and Scandinavian chains even at 20% price premiums.
MEA Toasters Market
The Middle East & Africa segment, forecast for 4.92% annual growth, starts from low penetration but races ahead on urbanization. As trust in traditional Western brands wanes, Chinese suppliers are stepping in, leading to a projected surge in smart-appliance adoption by 2025. Egypt positions itself as a manufacturing hub, luring component makers with tax holidays and proximity to both Arab and Sub-Saharan consumer bases.
South America Toasters Market
South America shows pockets of vitality, especially in Brazil, where local assembly dampens currency-volatility risks. Volume growth stays tethered to macroeconomic swings, yet policymakers courting foreign direct investment could tilt the curve upward by mid-decade. Second-tier urban centers adopt online retail faster than megacities because of pent-up assortment gaps in physical stores, giving digital-native toaster brands a competitive wedge.
Regulatory Landscape
In the European Union, toaster design and importer obligations are being shaped by a tighter safety-and-sustainability stack in 2026, including full enforcement of the General Product Safety Regulation (GPSR) and the continued role of IEC/EN household appliance safety standards (including IEC 60335-2-9 for cooking appliances). Energy performance requirements also influence electronics architecture, with EU standby power limits commonly referenced at 0.5 W for applicable appliance categories, which reinforces low-power connectivity and auto-sleep functions in smart and commercial units.
Outside Europe, India is moving toward mandatory conformity routes for electrical appliances through the Safety of Household, Commercial and Similar Electrical Appliances (Quality Control) Order 2026, effective 1 October 2026, requiring BIS certification for covered products. For connected and data-generating appliances, compliance and disclosure expectations are rising alongside hardware rules, and De'Longhi references alignment with the EU Data Act, adding governance constraints to feature roadmaps that rely on usage data and remote diagnostics.
Value Chain Analysis
Toaster value creation starts upstream with metals (stainless steel, aluminum), heating elements (nichrome), plastics and coatings, and electronics (controllers, sensors, Wi-Fi/Bluetooth modules for connected SKUs). Midstream, OEM/ODM manufacturing and final assembly convert these inputs into pop-up, oven/toaster-oven hybrid, and conveyor formats, followed by safety testing and documentation for market access in major regions. Downstream, distribution spans mass retail (supermarkets/hypermarkets), specialty and brand stores, and a rapidly growing online channel that supports direct-to-consumer launches and faster feature iteration.
Compliance management has moved into the value chain rather than sitting at the final-gate stage. For example, Philips uses the BOMcheck platform to collect and manage supplier substance declarations to support RoHS/REACH-type requirements, and it runs responsible minerals due-diligence programs that cascade expectations to priority suppliers. These processes raise the value of qualified supplier networks, traceability tooling, and modular electronics designs that can be requalified quickly when components or regulations change.
Competitive Landscape
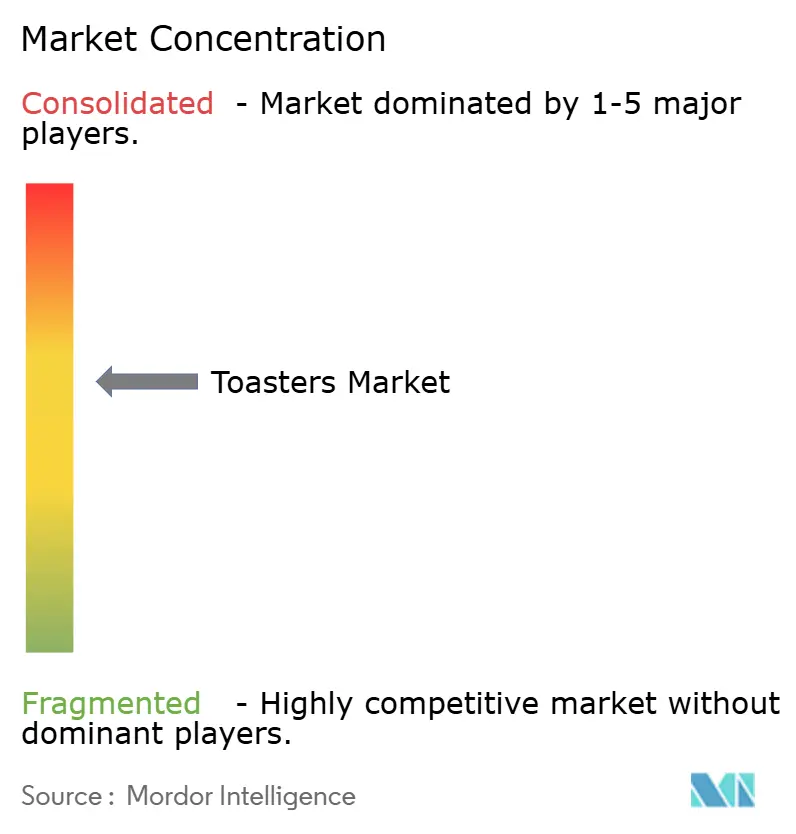
The toaster market is characterized by medium market concentration. The top five players collectively account for a significant chunk of the revenue. Leading the pack is Koninklijke Philips, trailed by Breville, with KitchenAid, Panasonic, and De’Longhi rounding out the top contenders. Meanwhile, OEM houses in Guangdong, China, and EMS plants in Manisa, Turkey, are inundating global channels with white-label units. This influx not only diminishes entry barriers but also intensifies price competition.
Strategy now centers on differentiation through firmware and after-sales ecosystems, not metalwork alone. Hamilton Beach’s takeover of HealthBeacon reflects a pivot toward health-tech adjacencies, leveraging cloud infrastructure that can later underpin smart-kitchen maintenance APIs. Middleby Corporation, eyeing margin focus, plans to spin off its food-processing arm to emphasize high-performance restaurant appliances, including smart conveyor toasters capable of predictive crumb buildup alerts.
Raw-material volatility drives vertical-integration experiments: Breville invested in a stainless-steel rolling mill joint venture to shield from tariff shocks, while Philips inked a multi-year silicon supply pact to guarantee microcontroller availability for its connected range. Marketing tactics are equally nuanced. Panasonic’s concierge program targets tech-savvy first adopters with online tutorials that harvest usage analytics for next-gen feature design, carving an informational moat that smaller rivals struggle to replicate. Meanwhile, retailers’ in-house brands press the low-price flank, sourcing from the same OEM pool but leveraging shelf-placement power to move inventory quickly.
Toasters Industry Leaders
-
Koninklijke Philips N.V.
-
Breville Group Ltd.
-
KitchenAid
-
Panasonic Corp.
-
De’Longhi Appliances S.r.l.
- *Disclaimer: Major Players sorted in no particular order
Toasters Market Companies Covered in this Report
- Koninklijke Philips N.V.
- Breville Group Ltd.
- KitchenAid
- Panasonic Corp.
- De’Longhi Appliances S.r.l.
- Conair Corp. (Cuisinart)
- Groupe SEB (Krups, Tefal)
- Hamilton Beach Brands
- Newell Brands (Sunbeam, Oster)
- SMEG S.p.A.
- Robert Bosch Hausgeräte GmbH
- Electrolux AB
- Midea Group
- Haier Smart Home
- JS Global Lifestyle (SharkNinja)
- Morphy Richards Ltd.
- Russell Hobbs (Spectrum Brands)
- Black+Decker (Stanley B&D)
- Dualit Ltd.
- Bajaj Electricals Ltd.
- Havells India Ltd.
Market Opportunities and Future Outlook
Regulation-driven redesign and compliance services create whitespace for differentiated products and supporting services. In Europe, the combination of GPSR enforcement in 2026 and stricter expectations around traceability and documentation rewards brands that can standardize digital product records, supplier declarations, and repair-support workflows across SKUs. EU standby power constraints, commonly referenced at 0.5 W, also support opportunities in ultra-low-power connectivity and smarter idle-management for connected toasters.
Geographic and channel shifts further widen room for go-to-market and manufacturing choices. India’s QCO 2026 (effective 1 October 2026) increases the payoff for BIS-ready designs and compliant local sourcing and assembly strategies for brands targeting scale, while e-commerce growth supports faster testing of wide-slot formats and smart-presets aligned to artisan bread usage. In the commercial segment, QSR and bakery modernization supports demand for conveyor models with controllable temperature and throughput, and connected diagnostics can be productized as service contracts (parts availability and uptime SLAs) rather than purely as one-time equipment sales.
Recent Industry Developments in Toasters Market
- July 2026: Koninklijke Philips N.V. launched the Airfryer 5000 Series Megabasket with a 10-liter basket split into two independent cooking zones. The Airfryer 5000 Series Megabasket expands Philips premium and connected kitchen capabilities, aimed at dual-zone cooking needs. The announcement reinforces Philips premium and connected-kitchen positioning in the high-end segment.
- July 2026: Koninklijke Philips N.V. released the DST6130/40 steam iron in India, 2800W. The steam iron launch broadens Philips APAC footprint and supports product offerings for busy households in the India market. It also strengthens regional presence in a high-potential appliance category.
- June 2026: KitchenAid (Whirlpool Corp.) launched a redesigned line of major kitchen appliances in Canada with Juniper and Black Ore color options. The refresh targets premium design aesthetics and consumer interest in updated kitchen spaces. It supports premiumization and design-driven differentiation in the Canadian market.
Toasters Market Report Scope and Research Methodology
Market Definition and Coverage
This market covers electric appliances used to toast bread and similar baked items, counted as revenue earned from the sale of new units through all major sales channels, across key regions.
Scope exclusions: refurbished or second-hand units, standalone replacement parts, and extended warranties are excluded from the market value.
Segments Covered in This Report
- By Product Type
- Pop-Up Toasters
- Oven/Toaster Ovens
- Conveyor Toasters
- Bun & Bagel Griller Toasters
- Smart/Connected Toasters
- By Slice Capacity
- 2-Slice
- 4-Slice
- >4-Slice
- By End-Use
- Residential
- Commercial (Hotels, Cafés, QSR, Institutional)
- By Wattage Range
- ≤800 W
- 801–1200 W
- By Distribution Channel
- Supermarkets / Hypermarkets
- Specialty & Brand Stores
- Online Retail / E-commerce
- Others (B2B Dealers, Cash & Carry)
- By Region
- North America
- United States
- Canada
- Mexico
- South America
- Brazil
- Argentina
- Chile
- Peru
- Rest of South America
- Europe
- United Kingdom
- Germany
- France
- Italy
- Spain
- BENELUX (Belgium, Netherlands, and Luxembourg)
- NORDICS (Denmark, Finland, Iceland, Norway, and Sweden)
- Rest of Europe
- Asia-Pacific
- China
- India
- Japan
- South Korea
- Australia
- South-East Asia (Singapore, Malaysia, Thailand, Indonesia, Vietnam, and Philippines)
- Rest of Asia-Pacific
- Middle East & Africa
- United Arab Emirates
- Saudi Arabia
- South Africa
- Nigeria
- Rest of Middle East & Africa
- North America
Data Sources, Market Sizing, and Validation
Desk Research
Desk research was used to set the boundaries for what a toaster is in trade and retail data, and to build a first view of demand by region before assumptions were tested with interviews. We relied on public sources that consistently track appliance production, trade, prices, and consumer demand signals, such as UN Comtrade for trade flows, the International Trade Centre for import/export statistics, the US International Trade Commission data portal for US trade, the US Bureau of Labor Statistics CPI series for small appliance price movement, and energy efficiency and safety documentation published by regulators and standards bodies.
We also reviewed annual reports and investor presentations from major appliance groups, large retailer category pages, and reputable press coverage to track feature shifts such as digital controls, wider slot designs, and bundled functions in toaster ovens. Where available, paid subscriptions for company financials and shipment-level import/export records were used to validate country mixes and to spot unusual price changes that may not show up in public averages. This list of desk research sources is illustrative, and many other public and paid references were also used for data collection, cross-checking, and clarification.
Primary Interviews and Surveys
Primary work focused on validating how volumes and pricing differ by product type and channel, since the same unit can sell at different price points depending on features and brand positioning. We spoke with manufacturers, distributors, retailers, and commercial buyers across APAC, EMEA, and the Americas so demand patterns, import reliance, and average selling prices could be corrected region by region before final totals were locked.
Distribution of primary research fieldwork respondents
| Company type | Respondent position | Region |
|---|---|---|
| Top tier: 27% | CXOs: 12% | APAC: 40% |
| Mid tier: 59% | Functional/Unit leaders: 28% | EMEA: 34% |
| Smaller Players: 14% | Managers: 60% | Americas: 26% |
Market-Sizing & Forecasting
Sizing starts with a top-down build where production and trade data help reconstruct apparent consumption for toaster products by region, which is then adjusted using retail channel context and interview checks. After that, selective bottom-up approximations are used as guardrails, such as sampled price points across offline and online listings, and supplier and distributor roll-ups in a few high-volume countries to confirm the order of magnitude.
Key model inputs include import and export value trends for toaster-related categories, household formation and urbanization signals that track small appliance penetration, channel mix between modern retail and e-commerce, product-mix shifts between pop-up toasters and toaster ovens, and average selling price movement based on feature adoption and inflation. When a country has limited visibility, gaps are handled by using proxy markets with similar income levels and appliance ownership patterns, followed by a sanity check against trade intensity and retailer assortment depth.
Forecasts use scenario analysis supported by short-run exponential smoothing for price and volume series, and then the scenarios are reconciled with expert views on replacement cycles, premiumization, and cost pass-through. This keeps the forward view repeatable and tied to measurable drivers instead of optimistic volume jumps.
Data Validation & Update Cycle
Outputs are checked through triangulation across independent signals, including trade values, category price indexes, and channel feedback from interviews, before a final number is signed off. Variance checks are run at region and country level so outliers can be traced back to a clear driver, such as a one-time import spike or a pricing shift in toaster ovens.
A second analyst review is completed to re-check assumptions, unit conversions, and currency handling, and follow-up outreach is triggered when a key input moves beyond an expected range. Reports are refreshed annually, with interim updates when material events affect pricing, trade, or demand. Before delivery, a final pass is done to ensure clients receive the most current view of the market.
Mordor Intelligence's Toasters Market Size Compared Against Other Published Estimates
Published market sizes for toasters often differ because authors do not always treat pricing, product boundaries, and currency conversion in the same way, and the timing of updates can also create a spread. In this study, the sizing logic was kept traceable to trade and demand signals, with interview-led corrections when public data was too broad.
The biggest gap drivers usually come from whether toaster ovens are bundled with adjacent countertop cooking products, how commercial units are treated versus home units, and how average selling prices are carried forward year to year. Results can also shift when older exchange rates are used for multi-country totals, or when inflation is applied uniformly instead of being adjusted by region and by product type. By refreshing the price ladder and FX timing during the annual update cycle and then re-checking it through distributor and retailer validations, the spread is narrowed in the final 2026 view used by Mordor Intelligence.
Benchmark comparison
| Source | Market Size | Gaps in Research Methodology |
|---|---|---|
| Mordor Intelligence | USD 4.53 B (2026) | |
| Trade Journal A | USD 4.34 B (2025) | Uses an earlier year and appears to carry forward historical growth rates, which can understate premium price tiers when smart and multi-function models gain share. |
| Industry Study B | USD 5.95 B (2025) | Combines toasters with toaster ovens and adjacent small countertop ovens in the same revenue pool, which expands the product scope and inflates the total. |
The comparison shows that timing and scope choices can move the total more than small differences in growth assumptions. When product boundaries are kept specific and prices are updated with observable signals, the resulting estimate is easier to reconcile with trade flows, channel mix, and what buyers report in the field.
Key Questions Answered in the Report
What is the current size of the toaster market?
The toaster market is valued at USD 4.53 billion in 2026 and is projected to reach USD 5.47 billion by 2031.
Which product type leads global sales?
Pop-up toasters hold 66.15% of global revenue in 2025, retaining dominance despite the rise of smart and multifunctional variants.
How fast is the commercial segment growing?
Commercial applications, covering QSRs, hotels, and bakeries, are forecast to expand at 5.78% CAGR between 2026-2031, outpacing residential growth.
Which region shows the strongest growth potential?
The Middle East & Africa is projected to record a 4.92% CAGR through 2031 as urbanization, rising incomes, and smart-appliance adoption converge.
How will tariffs affect toaster prices?
With 25% duties on imported steel and aluminium, U.S. retail prices for many small appliances could rise by up to 31%, pressuring manufacturers to adjust sourcing strategies.
Why are smart toasters gaining popularity?
Connected models offer remote control, personalized browsing profiles, and firmware updates that enhance user experience, driving a 7.62% CAGR in their segment.