Market Overview
| Study Period | 2020 - 2031 |
|---|---|
| Forecast Data Period | 2026 - 2031 |
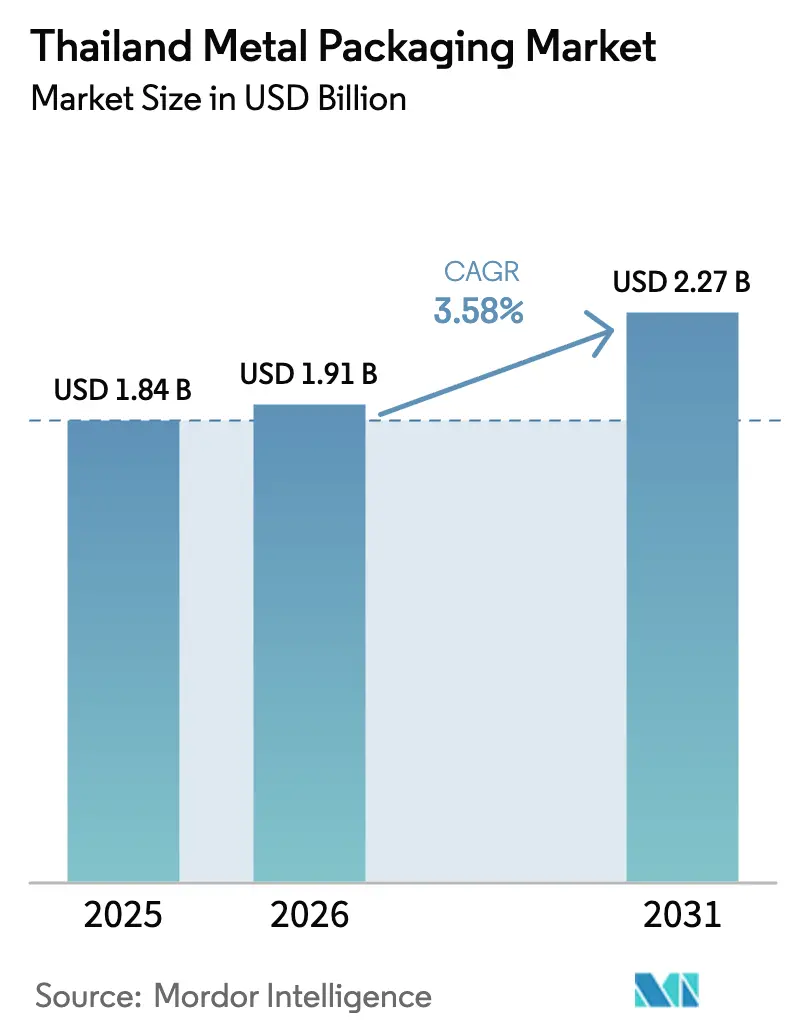
| Base Year Market Size (2025) | USD 1.84 Billion |
| Market Size (2026) | USD 1.91 Billion |
| Market Size (2031) | USD 2.27 Billion |
| Growth Rate (2026 - 2031) | 3.58% CAGR |
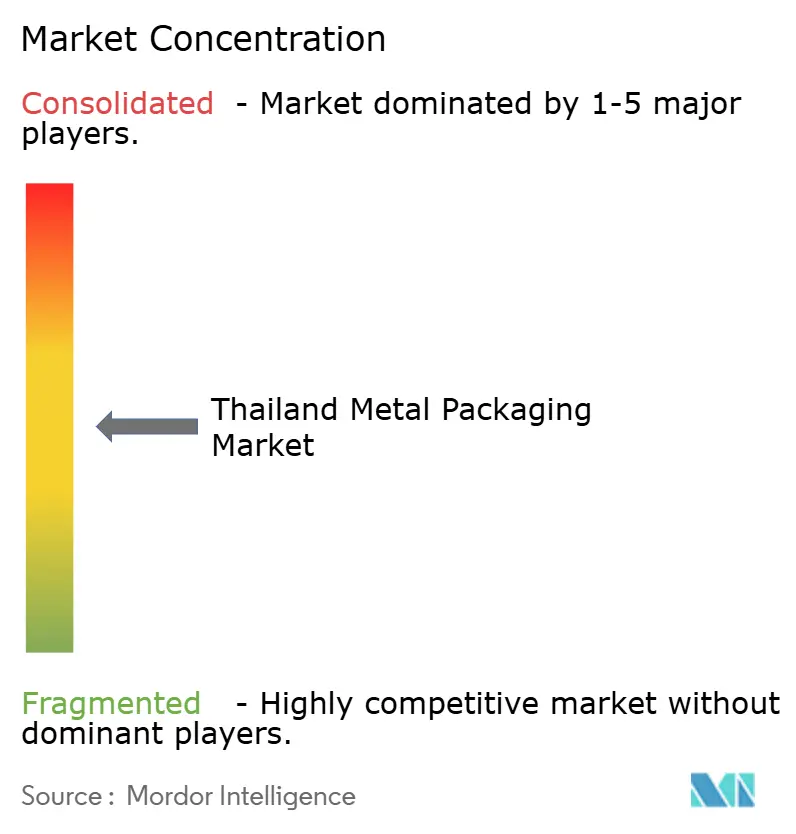
| Market Concentration | Medium |
Major Players *Disclaimer: Major Players sorted in no particular order Image © Mordor Intelligence. Reuse requires attribution under CC BY 4.0. | |
Thailand Metal Packaging Market Analysis by Mordor Intelligence
The Thailand Metal Packaging Market size is projected to be USD 1.84 billion in 2025, USD 1.91 billion in 2026, and reach USD 2.27 billion by 2031, growing at a CAGR of 3.58% from 2026 to 2031.
The trajectory reflects Thailand’s role as the world’s largest canned-tuna exporter, where seafood processing cycles anchor can demand, while premium ready-to-drink beverages tilt purchasing toward aluminum formats aligned with circular-economy targets. Government plans to mandate extended-producer responsibility from 2027 are accelerating closed-loop aluminum collection, and brand owners have begun tying recycled-content thresholds to supplier contracts. Momentum in pet-food exports, halal-certified canned seafood, and the rapid scale-up of e-commerce grocery models round out structural demand, though hot-rolled-steel price swings and the emergence of bio-polymer pouches temper near-term upside. Competitive intensity is shaped by global majors that localize high-speed two-piece lines inside the Eastern Economic Corridor, capturing scale economies that smaller converters struggle to match.
Key Report Takeaways
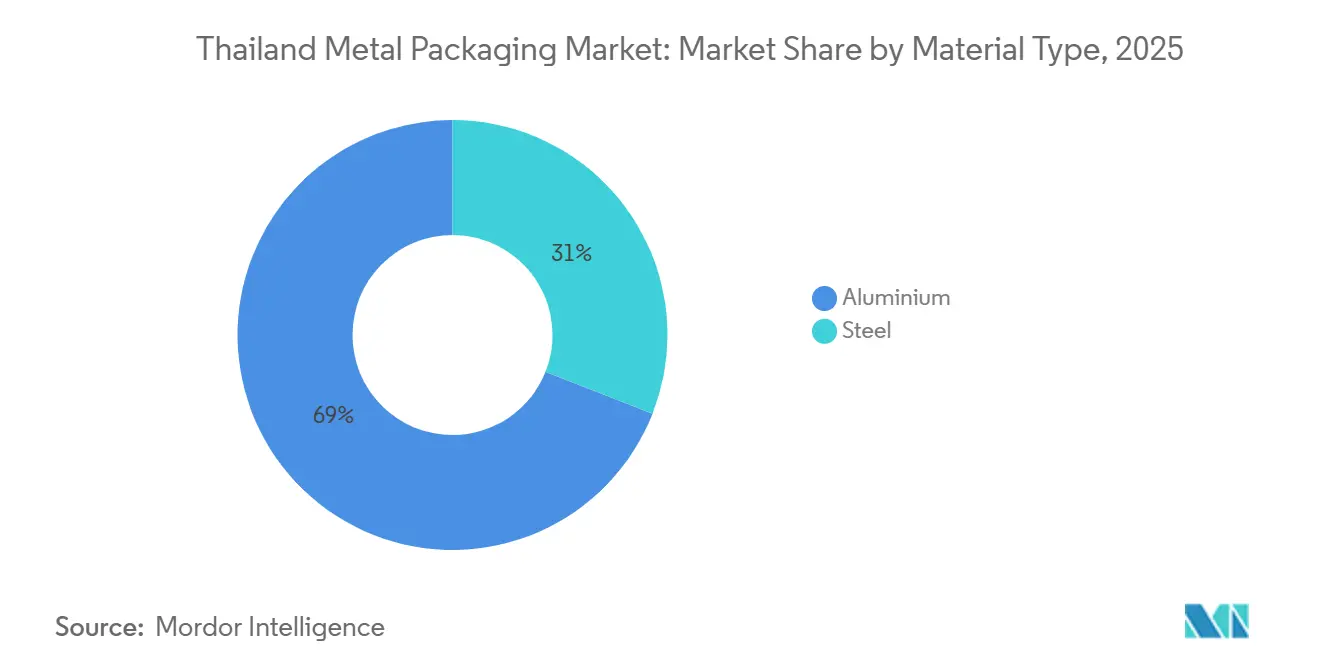
- By material type, aluminum accounted for 69.03% of revenue share in 2025 and is forecast to expand at a 3.93% CAGR through 2031, while steel lags.
- By product type, beverage cans led with 47.37% share in 2025, yet the broader cans category is poised to advance at a 4.26% CAGR over 2026-2031.
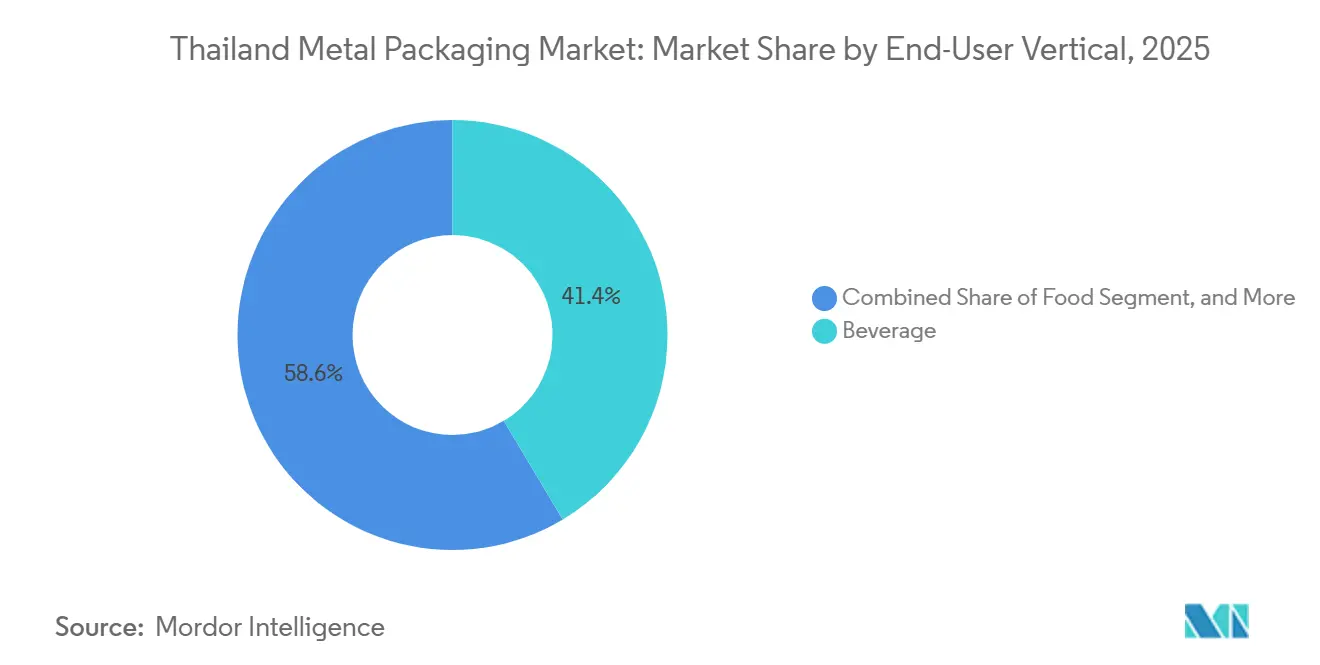
- By end-user vertical, beverages accounted for 41.43% of sales in 2025, but paints and chemicals are projected to register the fastest 4.33% CAGR up to 2031.
- By manufacturing technology, two-piece drawn-and-wall-ironed lines commanded 51.22% of capacity in 2025, whereas two-piece drawn-and-redrawn technology is set to grow at 4.06% through 2031.
Note: Market size and forecast figures in this report are generated using Mordor Intelligence’s proprietary estimation framework, updated with the latest available data and insights as of 2026.
Thailand Metal Packaging Market Trends and Insights
Drivers Impact Analysis*
| Driver | (~) % Impact on CAGR Forecast | Geographic Relevance | Impact Timeline |
|---|---|---|---|
| Premiumisation of Ready-to-Drink Beverages | +0.8% | National, early gains in Bangkok, Chiang Mai, Phuket | Medium term (2-4 years) |
| Growth of Thailand’s Pet-Food Export Hub | +0.6% | National, clusters in Samut Sakhon, Chonburi | Long term (≥ 4 years) |
| Expansion of Halal-Certified Canned Seafood | +0.5% | National, exports to Middle East and North Africa | Medium term (2-4 years) |
| Government Push for Circular-Economy Aluminum | +0.4% | National, pilots in Chonburi, Rayong, Chachoengsao | Long term (≥ 4 years) |
| Rapid Scale-Up of E-Commerce Grocery Formats | +0.3% | Bangkok Metropolitan Region | Short term (≤ 2 years) |
| Brewery Shift to Sleek and Slim Can Formats | +0.3% | National, led by ThaiBev and Boon Rawd | Short term (≤ 2 years) |
| Source: Mordor Intelligence | |||


Premiumisation of Ready-to-Drink Beverages
Craft beers, energy drinks, and sparkling teas packaged in sleek 250- and 330-milliliter cans are growing faster than mainstream beverages, prompting converters to invest in two-piece drawn-and-redrawn lines that cut aluminum use by nearly 10% per unit. Brands deploy 360-degree direct printing to mitigate cold-chain condensation, a feature already embedded in the high-speed lines operated by leading multinationals [1]Diageo plc, “FY 2024 Southeast Asia Alcoholic Beverages Overview,” diageo.com. The premium trend is spilling into nonalcoholic launches, where tethered caps and perforated shrink sleeves help meet plastics regulations in convenience channels [2]Thai Beverage plc, “Sustainability Report 2025,” thaibev.com. As these specifications tighten seaming tolerances and gauge requirements, smaller local converters face capital hurdles that could accelerate industry consolidation. In the near term, premiumisation keeps aluminum demand ahead of steel and lifts average price per can, supporting margin resilience even as total beverage volumes flatten.
Growth of Thailand’s Pet-Food Export Hub
Thailand aims to lift pet-food exports to USD 5 billion by 2030, creating sustained demand for 85-gram and 170-gram cans that withstand retort sterilization at 121 °C. Export customers insist on epoxy-phenolic coatings that resist sulfur corrosion from fish proteins, requirements best met by converters with automated coating lines. Halal certification has become a gating factor because Gulf markets already absorb more than one-third of canned-food exports. Compliance with FDA 21 CFR 113 and European migration limits adds a further layer of technical validation, favoring suppliers capable of batch traceability. These specifications position high-barrier metal cans as the default for long-shelf-life wet pet foods, outpacing flexible pouches in export channels.
Expansion of Halal-Certified Canned Seafood
Accreditation wins by Thailand’s Islamic authorities in 2023 opened Saudi and Emirati outlets to canned tuna and mackerel packed under segregated halal lines. Shipments to Middle East and North Africa climbed from 34.3% of tuna export volume in 2020 to 37.0% during January-May 2025, and processors now roll out flavored variants that need spice-resistant can linings. Packaging suppliers able to segregate halal production and guarantee non-pork-derived coatings capture price premia and longer contracts. The segment also benefits from governmental soft-power initiatives that bundle halal food with tourism promotion, pulling incremental can demand into the peak fishing season.
Government Push for Circular-Economy Aluminum
A draft Sustainable Packaging Management Act due in 2027 will make brand owners financially responsible for post-consumer collection, accelerating closed-loop aluminum projects exemplified by ThaiBev’s Aluminum Loop, which saved 2,583 tonnes of virgin metal versus 2020. Crown Holdings is mapping national recycling rates in partnership with the International Aluminum Institute to provide baseline data for extended producer responsibility compliance. Aluminium’s 95% lower recycled carbon footprint compared with primary metal maps neatly onto looming carbon-border-adjustment levies in export markets, giving local canners a tangible reason to specify recycled content. BOI incentives inside the Eastern Economic Corridor, including import-duty exemptions on recycling equipment, further tip the equation toward aluminum over steel for beverage and food cans.
Restraints Impact Analysis*
| Restraint | (~) % Impact on CAGR Forecast | Geographic Relevance | Impact Timeline |
|---|---|---|---|
| Rising Price Volatility of Rolled Steel Coil | -0.5% | National, severe for three-piece can makers | Short term (≤ 2 years) |
| Substitution by Bio-Polymer Pouches in Sauces | -0.3% | Samut Sakhon, Chonburi food clusters | Medium term (2-4 years) |
| Slow Uptake of Recycling Infrastructure Outside EEC | -0.2% | Northern and Northeastern provinces | Long term (≥ 4 years) |
| Stringent VOC Emission Norms for Aerosol Plants | -0.2% | Samut Prakan, Chonburi | Medium term (2-4 years) |
| Source: Mordor Intelligence | |||
Rising Price Volatility of Rolled Steel Coil
ASEAN hot-rolled-coil quotations swung double digits in 2024, squeezing three-piece can producers that buy steel spot yet invoice customers on trailing averages. Steel accounts for as much as 70% of a welded food can’s cost, so a short-cycle spike erodes margins before pass-through clauses reset. Thailand imports roughly 60% of its flat-rolled requirements, exposing converters to freight-rate turbulence and trade-remedy risks when China increases exports. Scope 3 carbon reporting is pushing global brands toward low-carbon packaging, making aluminum’s circularity advantage an even stronger headwind for steel. While steel remains dominant in large paint cans and industrial drums, beverage and seafood processors have begun migrating to lighter two-piece aluminum alternatives.
Substitution by Bio-Polymer Pouches in Sauce
Food processors are piloting polylactic acid and bagasse-lignin pouches for fish sauce and chili paste to shave 60-70% off packaging weight and reduce freight bills by up to 20% [3]SCG Packaging plc, “Annual Report 2024,” scgpackaging.com. Unit cost savings reach 40% versus a steel can, enticing private-label brands in modern trade. Yet pouches struggle to deliver a 24-month shelf life without aluminum foil barriers, and rural cold-chain gaps limit their viability for ambient products [4]Thailand Environment Institute, “Rural Waste-Sorting Infrastructure Gaps,” tei.or.th. Metal cans counterpunch with infinite recyclability and tamper-evident integrity, resonating with export markets that demand robust traceability. Hence, substitution remains confined to short shelf-life SKUs sold domestically, moderating the restraint’s net impact on the Thailand metal packaging market.
*Our forecasts treat driver/restraint impacts as directional, not additive. The impact forecasts reflect baseline growth, mix effects, and variable interactions.
Segment Analysis
By Material Type: Aluminum Extends Its Lead
Aluminum claimed 69.03% of 2025 revenue, reflecting its dominant position in beverage and seafood cans, where recycled content underpins procurement decisions. The Thailand metal packaging market share for aluminum is projected to rise further as three leading converters match Ball’s 74% recycled-content benchmark. Lightweighting campaigns allow breweries to cut weight by 8-12% per can, while carbon border adjustment rules embed a price on steel’s higher carbon footprint. Steel remains relevant for pilfer-proof closures and 20-liter paint tins, but its domestic cost advantage erodes when import freight costs spike or customers demand higher recycled content.
Despite higher alloy costs, the Thailand metal packaging market for aluminum cans is expected to expand through 2031, supported by BOI duty waivers on imported slugs and EEC recycling hubs that lower scrap input costs. Steel converters counter through niche leadership in aerosol domes and industrial drums, yet sustained volatility in coil prices and tighter VOC rules limit capital allocation to new welded lines. Suppliers able to certify Aluminum Stewardship Initiative compliance should lock in long-term beverage contracts, reinforcing aluminum’s trajectory.

By Product Type: Cans Category Outpaces Alternatives
Beverage cans delivered 47.37% of 2025 sales, but aggregate cans, beverage, food, and aerosol, form the fastest growing cluster at a 4.26% CAGR up to 2031. The Thailand metal packaging market size attached to this cluster benefits from seafood processors shipping 630,434 tonnes of canned tuna in 2024 and from breweries that favor slim cans to enhance shelf presence. Aerosols add incremental upside as lubricant exporters migrate from steel drums to pressurized aluminum formats that meet ISO 14001 audits.
Non-can formats such as barrels, drums, and caps grow more slowly, hampered by flexitank substitution in chemicals and by plastic closures in soft drinks. Nevertheless, closures carve a stable niche because tamper-proof steel caps remain integral to beer and spirits bottling. Over the forecast window, cans will continue to capture incremental share as brand owners prioritize stackability, circularity, and premium graphics that are unattainable in pouches.
By End-User Vertical: Paints and Chemicals Lead Growth
Beverage brands accounted for 41.43% of revenue in 2025, yet paints and chemicals stand out with a 4.33% growth pace as exporters switch from 200-liter drums to 50-liter aluminum cans that cut pallet weight almost in half. This shift directly expands the Thailand metal packaging market for industrial coatings and lubricants, while also diversifying the end-user mix beyond beverages. The transition is reinforced by new air-quality rules that push paint fillers toward water-based formulations packaged in cans with advanced internal linings.
Food processors remain a heavyweight end-user, buoyed by halal-certified seafood and pet-food exports that demand corrosion-resistant linings. Automotive oils lag because electric-vehicle penetration erodes internal-combustion lubricant needs, lowering growth prospects for steel quart cans. Converters increasingly tailor production schedules to chase high-margin specialty verticals rather than chase volume in mainstream soft-drink cans.

By Can Manufacturing Technology: DRD Adoption Quickens
Two-piece drawn-and-wall-ironed lines represented 51.22% of 2025 capacity, a testament to their 2,500-cpm speed and lean gauge profiles. Yet brewer migration to sleek 250-milliliter cans pushes drawn-and-redrawn (DRD) installations ahead at a 4.06% CAGR, capturing incremental Thailand metal packaging market share with taller, thinner cans that save up to 10% aluminum per unit. DRD equipment costs roughly 25% more than DWI, but payback is under four years for high-volume beverage applications.
Three-piece welded technology declines as seafood packers pilot two-piece food cans that trim labor steps and scrap. Despite its retreat, welded canning still anchors paint and industrial formats above 500 milliliters where aluminum’s material cost is prohibitive. The shift toward DRD is most pronounced inside the Eastern Economic Corridor, where land-ready industrial estates and BOI tax holidays de-risk capital deployment for global majors.
Geography Analysis
Production is clustered in the Eastern Economic Corridor, where Chonburi, Rayong, and Chachoengsao provinces host an estimated 55-60% of national can capacity, leveraging Laem Chabang port and BOI incentives to feed export lanes. Crown and ALUCON operate multi-size two-piece lines that ship cans to beverage and seafood plants within a 200-kilometer radius, sustaining the core of Thailand's metal packaging market. Integrated recycling parks under construction inside the corridor promise to lift post-consumer scrap collection, lowering furnace charge costs for aluminum re-melting and sharpening the region’s cost edge.
Northern and Northeastern provinces contribute smaller volumes focused on domestic food and paint cans. Sparse collection networks hamper scrap supply, so converters rely on virgin steel and aluminum, which inflates cost baselines. Municipal waste streams lack separation, generating low-quality mixed-metal scrap that seldom meets export-grade specifications. Unless extended producer responsibility funds seed new sorting hubs, these areas may lose volume to EEC rivals.
Southern Thailand remains a seafood-canning node anchored by Songkhla and Hat Yai. Close proximity to fishing ports slashes inbound logistics, while halal-certified plants funnel cans into Gulf markets. Power and water constraints, however, curtail large-scale expansion, and elevated diesel-generated electricity prices squeeze operating margins compared with natural-gas-fired grids in the EEC. Over the forecast horizon, investors are likely to double down on the corridor,
Competitive Landscape
Global majors Crown Holdings, Ball Corporation, and ALUCON held an estimated 60-65% of 2025 beverage and food-can volume, giving the Thailand metal packaging market a moderate concentration profile. Crown leveraged line efficiency to lift Asia-Pacific operating income 27% in 2024 despite a 7% volume dip, demonstrating how mix and downgauging offset lower throughput. Ball redeployed capital toward North American acquisitions while still recording 4.1% and 3.9% global shipment gains in Q2 and Q3 2025, respectively, helped by 74% recycled content that wins corporate sustainability mandates.
ALUCON’s 1.2 billion-piece capacity and 48,000-tonne slug throughput crown it Asia’s largest impact-extrusion supplier, with exports to 37 countries diluting domestic cyclicality. Local players Thai Beverage Can, Bangkok Can Manufacturing, and Swan Industries face mounting cost pressures to automate seaming and coating, or risk ceding share to technology-rich multinationals. Circularity audits commissioned by the Crown and the International Aluminum Institute in 2023 signal that traceability will soon differentiate contract awards, pushing uncertified converters toward private-label niches or regional food cans.
White-space opportunities include halal aerosol cans for personal-care exports, closed-loop aluminum supply models tied to brand owner KPIs, and DRD lines tailored for craft beverages. However, capital barriers of USD 60-80 million per high-speed two-piece line curb new entrants, protecting incumbent share. As premiumisation deepens and EPR rules crystallize, market leaders that align recycled content, certification, and flexible formats stand to widen their advantage.
Thailand Metal Packaging Industry Leaders
Toyo Seikan Group Holdings, Ltd.
ALUCON Public Company Limited
Crown Holdings, Inc.
Ball Corporation
Thai Beverage Can Co., Ltd.
- *Disclaimer: Major Players sorted in no particular order

Recent Industry Developments
- August 2025: Ball Corporation divested a 41% stake in Ball United Arab Can Manufacturing, freeing capital for North American expansions and opening supply gaps for Thai beverage exporters targeting Gulf markets.
- February 2025: Ball Corporation acquired Florida Can Manufacturing for USD 160 million, increasing capacity to serve Coca-Cola, PepsiCo, and craft breweries in the U.S. Southeast.
- October 2025: Ball Corporation reported a 3.9% year-on-year rise in global aluminum-packaging shipments during Q3 2025, with North and South America outperforming a flat Asia-Pacific region.
- July 2025: Ball Corporation noted 4.1% shipment growth in Q2 2025 and confirmed 74% recycled content across its 2024 beverage portfolio.


Thailand Metal Packaging Market Report Scope
The Thailand metal packaging market is segmented by material type (aluminum, and steel), product type (cans (food cans, beverage cans, and aerosol cans), bulk containers, shipping barrels and drums, and caps and closures), end-user industry (beverage, food, paints and chemical, and industrial and automotive oils), and can manufacturing technology (two-piece DWI, two-piece DRD, and three-iece welded). The market size and value forecasts (USD) for all the above segments are provided.
By Material Type
| Aluminium |
| Steel |
By Product Type
| Cans | Food Cans |
| Beverage Cans | |
| Aerosol Cans | |
| Bulk Containers | |
| Shipping Barrels and Drums | |
| Caps and Closures |
By End-User Vertical
| Beverage |
| Food |
| Paints and Chemicals |
| Industrial and Automotive Oils |
By Can Manufacturing Technology
| Two-Piece DWI |
| Two-Piece DRD |
| Three-Piece Welded |
| By Material Type | Aluminium | |
| Steel | ||
| By Product Type | Cans | Food Cans |
| Beverage Cans | ||
| Aerosol Cans | ||
| Bulk Containers | ||
| Shipping Barrels and Drums | ||
| Caps and Closures | ||
| By End-User Vertical | Beverage | |
| Food | ||
| Paints and Chemicals | ||
| Industrial and Automotive Oils | ||
| By Can Manufacturing Technology | Two-Piece DWI | |
| Two-Piece DRD | ||
| Three-Piece Welded | ||


Key Questions Answered in the Report
What is the current value of the Thailand metal packaging market?
The market stood at USD 1.91 billion in 2026 and is on course to reach USD 2.27 billion by 2031.
Which material dominates Thailand’s can production?
Aluminum leads with a 69.03% share in 2025, a position reinforced by recycled-content and lightweighting advantages.
Which end-user vertical shows the fastest growth?
Paints and chemicals are projected to expand at a 4.33% CAGR through 2031, outpacing beverages and food.
How are Thai converters addressing sustainability requirements?
Market leaders invest in closed-loop collection, achieve over 70% recycled content, and pursue Aluminum Stewardship Initiative certification.
What technology shift is shaping future capacity?
Two-piece drawn-and-redrawn lines for sleek and slim cans are growing at 4.06% a year, driven by brewery demand.
Which regions house most of Thailand’s can-making capacity?
About 55-60% of capacity sits inside the Eastern Economic Corridor provinces of Chonburi, Rayong, and Chachoengsao.
Page last updated on:


