Switzerland Courier, Express, And Parcel (CEP) Market Size and Share
Market Overview
| Study Period | 2018 - 2031 |
|---|---|
| Forecast Data Period | 2026 - 2031 |
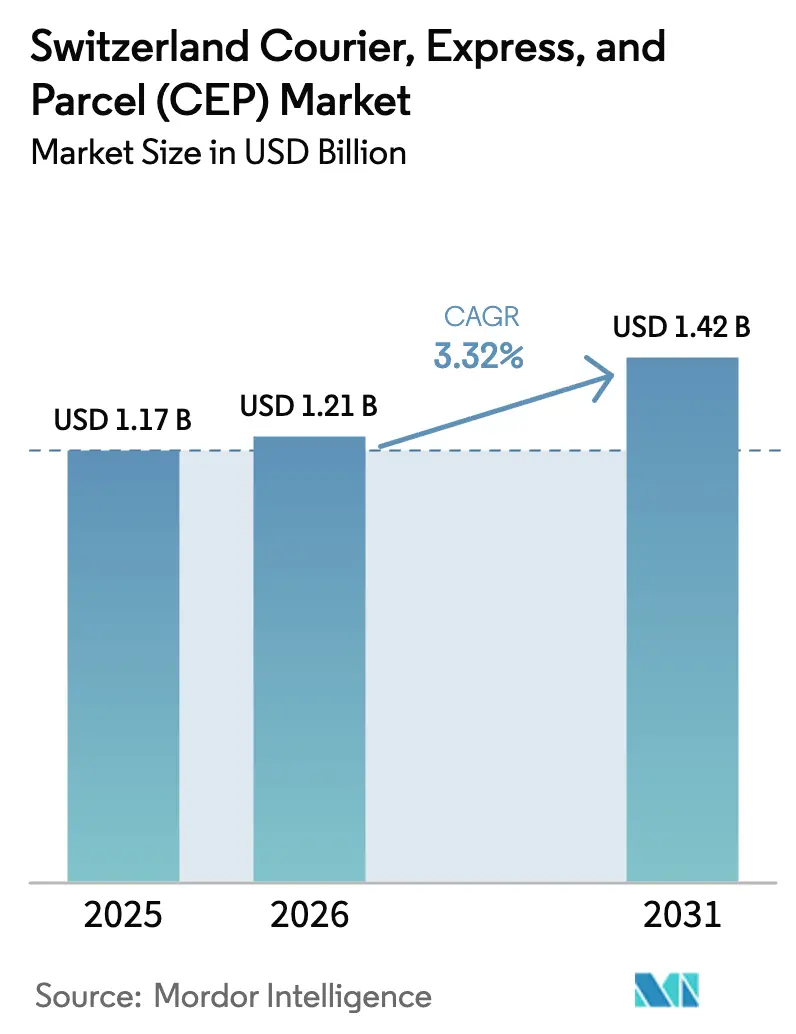
| Base Year Market Size (2025) | USD 1.17 Billion |
| Market Size (2026) | USD 1.21 Billion |
| Market Size (2031) | USD 1.42 Billion |
| Growth Rate (2026 - 2031) | 3.32% CAGR |
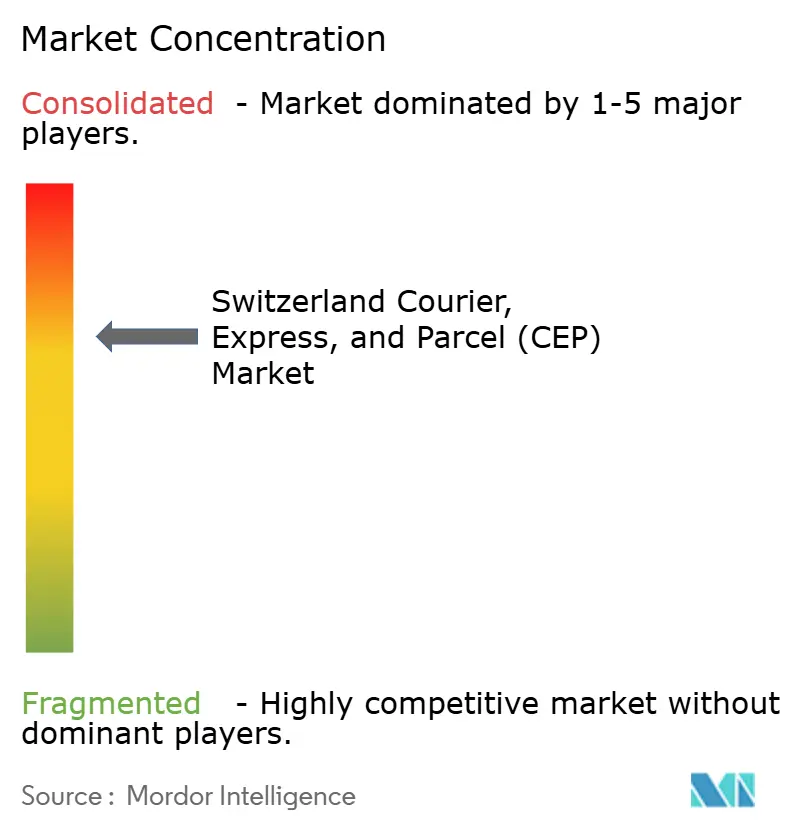
| Market Concentration | Medium |
Major Players *Disclaimer: Major Players sorted in no particular order Image © Mordor Intelligence. Reuse requires attribution under CC BY 4.0. | |
Switzerland Courier, Express, And Parcel (CEP) Market Analysis by Mordor Intelligence
The Switzerland courier, express, and parcel market size was valued at USD 1.17 billion in 2025 and estimated to grow from USD 1.21 billion in 2026 to reach USD 1.42 billion by 2031, at a CAGR of 3.32% during the forecast period (2026-2031). This measured trajectory mirrors a logistics landscape where a highly developed road and rail network, an affluent digital-savvy consumer base, and an ambitious national carbon-neutrality agenda intersect. Switzerland’s non-EU status, combined with deep trade linkages to neighboring member states, sustains a two-speed environment: domestic parcel density remains high, yet the international flow of time-critical goods—pharmaceuticals, precision instruments, and high-value consumer items—outpaces internal volume growth as liberalized customs rules favor cross-border commerce. Express services capture demand from banks and life-science exporters willing to pay for predictable cut-off times, while electric-vehicle adoption accelerates in last-mile operations as cantonal authorities limit diesel access in Zurich, Geneva, and Basel.
Key Report Takeaways
- By destination, domestic deliveries led with 65.55% of the Switzerland courier, express, and parcel (CEP) market share in 2025, while international parcels are projected to expand at a 3.41% CAGR between 2026-2031.
- By speed of delivery, non-express services captured 74.65% of the Switzerland courier, express, and parcel (CEP) market size in 2025, whereas express offerings are forecast for the quickest rise at a 3.73% CAGR between 2026-2031.
- By model, business-to-consumer (B2C) shipments commanded 54.05% of 2025 revenues, but consumer-to-consumer (C2C) traffic is set to grow the fastest at a 2.73% CAGR between 2026-2031.
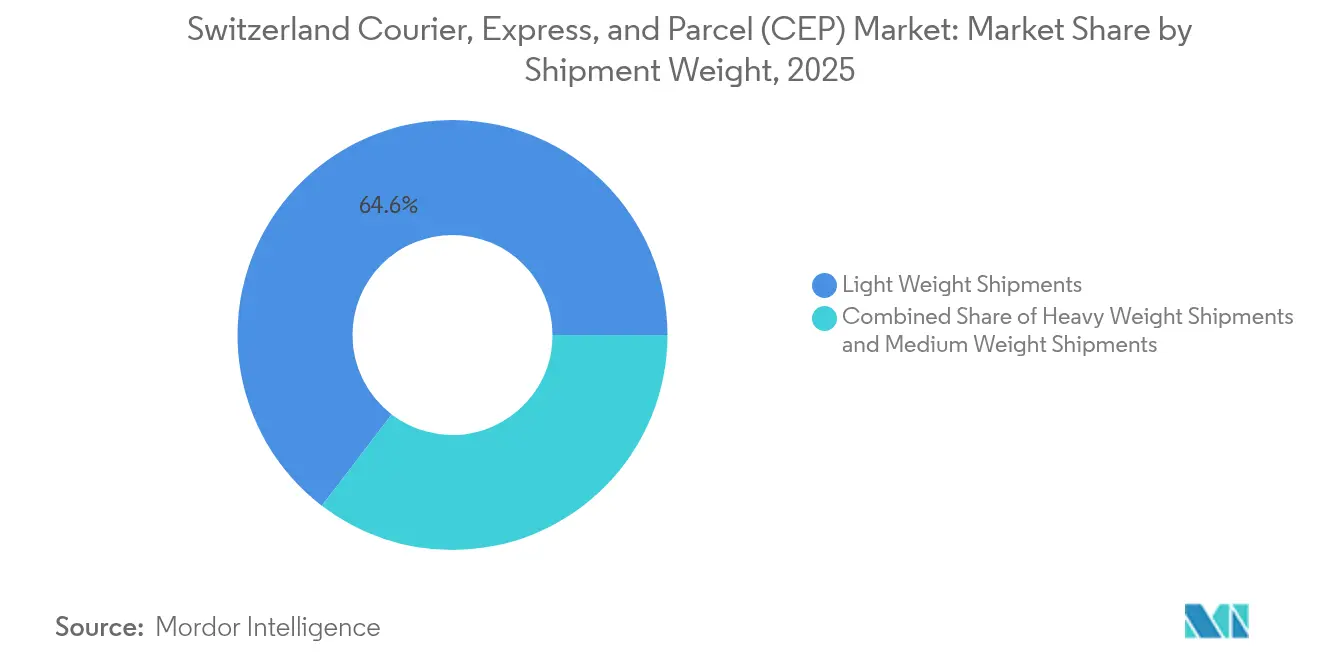
- By shipment weight, light-weight parcels dominated with 64.60% market share in 2025, while heavy-weight consignments are expected to post the highest uptick at a 2.66% CAGR between 2026-2031.
- By mode of transport, road retained 62.40% of 2025 turnover, yet air transport is on course for the sharpest climb at a 2.74% CAGR between 2026-2031.
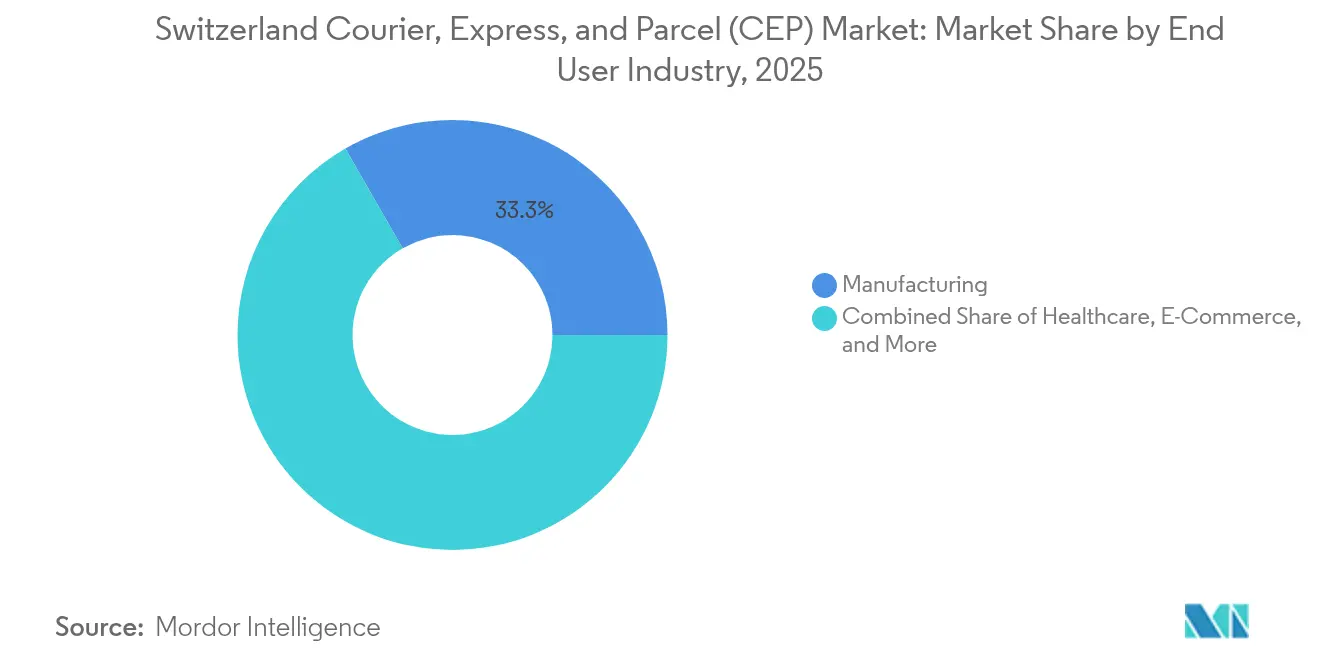
- By end user industry, manufacturing accounted for 33.30% of 2025 value, whereas e-commerce is poised to register the strongest 3.55% CAGR between 2026-2031.
Note: Market size and forecast figures in this report are generated using Mordor Intelligence’s proprietary estimation framework, updated with the latest available data and insights as of 2026.
Switzerland Courier, Express, And Parcel (CEP) Market Trends and Insights
Drivers Impact Analysis*
| Driver | (~) % Impact on CAGR Forecast | Geographic Relevance | Impact Timeline |
|---|---|---|---|
| Strong B2C E-commerce growth | +1.0% | Urban cantons | Medium term (2-4 years) |
| National sustainability mandate for zero-emission last mile | +0.8% | Zurich, Geneva, Basel | Long term (≥ 4 years) |
| Parcel network densification by Swiss Post and private players | +0.6% | Rural cantons | Medium term (2-4 years) |
| Cross-border duty-free removal | +0.4% | Rhine corridor, border zones | Short term (≤ 2 years) |
| AI-enabled route optimization | +0.3% | National trunk corridors | Medium term (2-4 years) |
| Autonomous Cargo-Sous-Terrain pipeline | +0.2% | Zurich–Geneva corridor | Long term (≥ 4 years) |
| Source: Mordor Intelligence | |||


Strong B2C E-Commerce Growth
International marketplaces reshape the competitive field, compelling Swiss SMEs to forge digital storefronts and outsource fulfillment to technologically advanced carriers. Ultra-light, high-frequency parcels originating from Asian hubs erode weight-based tariff models, forcing operators to re-price or bundle deliveries. Environment-minded consumers increasingly pick carbon-neutral options or collect parcels at automated lockers, tightening carrier service menus. Omnichannel retailers request integrated click-and-collect capability that blends brick-and-mortar stock with online orders, a feature best achieved by enterprise carriers already equipped with API-driven routing engines. Simplified EU–Switzerland customs via the IOSS regime reduces border latency, encouraging cross-border cart conversions[1]Swiss Customs, “Import One-Stop Shop,” ezv.admin.ch.
National Sustainability Mandate for Zero-Emission Last Mile
Federal climate law requires transport carbon neutrality by 2050, accelerating battery-electric van adoption and micro-depot rollout[2]Swiss Federal Office for the Environment, “Climate Policy,” bafu.admin.ch. Swiss Post’s fleet electrification outlays dwarf those of smaller rivals, momentarily widening its cost advantage once diesel surcharges escalate. Cantonal low-emission zones now prohibit diesel vans in morning peaks, compelling lagging fleets to reroute or pay congestion fees. Charging-infrastructure scarcity in Alpine cantons still constrains nationwide deployment, yet bulk power-purchase agreements signed by larger integrators lock in favorable electricity costs. Battery-density improvements expected after 2028 should extend range and unlock heavier parcel weights without payload sacrifice.
Parcel Network Densification by Swiss Post and Private Players
Automated sorters installed in Swiss Post’s Härkingen and Frauenfeld hubs lift hourly throughput and slash manual touchpoints[3]Swiss Post, “Strategy,” post.ch. Planzer’s 2025 purchase of Italy’s Sifte Berti adds southbound consolidation lanes that divert parcel traffic from congested alpine passes. Denser rural pickup-drop clusters reduce cost per stop and build moat effects in sparsely populated cantons. Universal-service subsidies permit Swiss Post to over-invest in fringe routes, a privilege that private carriers offset through partnership terminals. High fixed-cost footprints incentivize competitors to share excess capacity via reciprocal linehaul swaps.
Cross-Border Duty-Free Removal Accelerating EU-to-CH Fulfillment Hubs
The January 2025 reduction of the VAT-exempt threshold to CHF 150 (USD 178.2) plus the removal of industrial tariffs spurred 3PLs to erect bonded depots along the Rhine. Parcel integrators offering digital customs filing capture merchant wallet share because automated duty collection trims delivery ETAs. Investments cluster around Muttenz and Pratteln, where dual-use road-rail nodes serve both domestic returns and EU restocking flows. Employment in Basel-Land logistics jumped as fashion and electronics brands co-located inventory to exploit bilateral overnight trucking links.
Restraints Impact Analysis*
| Restraint | (~) % Impact on CAGR Forecast | Geographic Relevance | Impact Timeline |
|---|---|---|---|
| Rising labor shortages and wage inflation | −0.5% | Urban delivery zones | Short term (≤ 2 years) |
| Mountain-terrain delivery cost overhang | −0.4% | Alpine cantons | Long term (≥ 4 years) |
| Terminal-dues self-declared rate hikes | −0.3% | International corridors | Medium term (2-4 years) |
| Airport night-flight curfews | −0.2% | Zürich, Geneva airports | Short term (≤ 2 years) |
| Source: Mordor Intelligence | |||
Rising Labor Shortages and Wage Inflation
Driver vacancies reached record levels in 2024, inflating last-mile payrolls by double digits and denting carrier margins. Weekend delivery premiums rose as operators relied on subcontractors to plug roster gaps, yet union contracts cap weekly hours, limiting scheduling flexibility. Automation thresholds fall when wages climb: carriers justify small-parcel sort robots at depots handling under 5,000 pieces per day. Immigration curbs after 2024 restricted Eastern European labor inflows, leaving rural routes understaffed. Some carriers respond with reskilling programs, but attrition remains elevated as construction and manufacturing outbid logistics firms for qualified drivers.
Mountain-Terrain Delivery Cost Overhang
Servicing Alpine resorts requires snow-capable vehicles, seasonal helicopter lifts, and duplicate routing during winter road closures, creating a permanent negative spread versus lowland deliveries[4]Swiss Alpine Club, “Mountain Logistics,” sac-cas.ch. Population density below 50 people per km² in certain valleys prevents route consolidation. Environmental caps on diesel emissions limit vehicle tonnage, pushing carriers toward costly small-van fleets with lower loading factors. Universal-service rules stop Swiss Post from abandoning loss-making mountain routes, but private specialists can cherry-pick profitable tourist centers, exacerbating the cost imbalance borne by the incumbent. Digital locker pilots in ski areas shaved only marginal minutes off delivery cycles due to sparse smartphone penetration among elderly residents.
*Our forecasts treat driver/restraint impacts as directional, not additive. The impact forecasts reflect baseline growth, mix effects, and variable interactions.
Segment Analysis
By End User Industry: Manufacturing Leadership with E-Commerce Acceleration
Manufacturing generated 33.30% of 2025 turnover, anchored by chemical, biotech, and precision-tool exporters demanding GDP-compliant cold-chain lanes and high-value insurance cover. The Switzerland courier, express, and parcel market size accruing from e-commerce is projected to grow the quickest at 3.55% CAGR between 2026-2031 as marketplaces entice cross-border shoppers with pre-paid duties and same-day options.
Financial services still mail notarized originals across cantons, adding a steady albeit shrinking revenue stream. Healthcare logistics increase in complexity as cell-and-gene therapies require narrow temperature bands, compelling carriers to invest in IoT-enabled payload sensors. Wholesale and retail trade pivot toward dark-store micro-fulfillment, outsourcing same-hour drops to bike couriers inside low-emission zones.


By Destination: International Growth Outpaces Domestic Volume
International consignments are expanding at a 3.41% CAGR from 2026-2031, even though domestic traffic still accounts for 65.55% of parcels handled in 2025. Favorable customs reforms and zero-duty industrial imports stimulate EU-origin flows, while Swiss exporters rely on integrators for bonded returns to Germany and France. The Switzerland courier, express, and parcel market size derived from overseas traffic is forecast to close the gap on domestic revenue as multinational pharma shippers route temperature-controlled doses through Basel to global endpoints. Parcel operators that fuse customs brokerage with last-mile execution build defensible positions, since rural EU depots can pre-sort by Swiss postcode and inject directly into local delivery loops.
Domestic volume remains essential for network density, yet electric-fleet capex and congestion tolls erode profitability versus international shipments. Cross-subsidization persists: high-margin intercontinental express lines support lower-yield Saturday rounds in the Jura and Ticino. Carriers that fine-tune bagging algorithms to mix domestic and import items on a single run cut empty kilometers and shrink unit costs.
By Speed of Delivery: Express Services Command Premium Growth
Express parcels, while forming only 25.35% of 2025 throughput, are projected for a 3.73% CAGR between 2026-2031 as corporate clients pay for before-noon guarantees. Night-flight curfews at Zürich and Geneva airports restrict late arrivals, so integrators divert volumes to road ‘moon-routes’ fed by regional air gateways in Milan and Lyon. The Switzerland courier, express, and parcel market share held by express specialists widens whenever volatile foreign-exchange trading or clinical trial timelines demand one-day lead times.
Standard parcels still dominate B2C checkouts, yet consumer expectations of next-day delivery at no premium compress margins. Operators recoup costs via membership fees or delivery-slot upsell, while cross-dock automation lifts throughput without expanding floor area. Bundling express and standard traffic within the same depot unlocks scale economies unreachable for pure-play express start-ups.
By Shipment Weight: Light Parcels Drive Volume Growth
Lightweight parcels captured 64.60% of the 2025 item count, reflecting omnichannel retailers’ push to minimize packaging and air freight costs. Automated sorters calibrated for polybags process more than 15,000 units per hour, slashing labor minutes per piece. The Switzerland courier, express, and parcel market size tied to heavyweight items still edges up via export machinery and high-density chemicals, but at a gentler 2.66% CAGR between 2026-2031 as incoterm shifts move bulk freight onto dedicated LTL providers.
Packaging-tax proposals are nudging merchants toward compostable mailers, trimming gram weights further; in turn, carriers must fine-tune volumetric billing to protect revenue. Meanwhile, ultra-fragile medical devices encourage the retention of a niche heavy-parcel capability that hinges on shock-controlled pallets and trained handlers.
By Mode of Transport: Road Dominance with Air Growth Constraints
Road networks kept around 62.40% share of the Switzerland courier, express, and parcel market in 2025, supported by tunnels like the Gotthard Base enabling year-round transit. Dual-fuel trucks and battery vans displace diesel on urban legs, aligning fleets with cantonal clean-air statutes. Air consignments, advancing at 2.74% CAGR between 2026-2031, cater to high-value pharma, fine-watch, and urgent legal documents; yet slot scarcity after 22:00 and noise quotas cap belly-hold volume at Zürich Kloten.
Rail and underground pipeline projects hold experimental promise: Cargo-Sous-Terrain’s pilot slated for 2031 foresees autonomous pods linking Härkingen to Zürich in under an hour. Until commercialisation, road-rail integrations via swap bodies on intermodal wagons are the principal hedge against motorway congestion.
By Model: B2C Dominance with C2C Emerging Growth
B2C retained a 54.05% hold on 2025 revenue, underpinned by fashion, beauty, and consumer electronics verticals. The Switzerland courier, express, and parcel market continues to rely on subscription locker networks, enabling out-of-home pick-ups that lower failed-delivery rates. C2C posts a 2.73% CAGR between 2026-2031 as peer-to-peer resale platforms such as Ricardo and Tutti spark micro-shipments within major cities. Integrated digital labels and kiosk drop-offs simplify seller workflow, encouraging repeat transactions.
B2B consignments stay relevant in precision-engineering and biotech corridors; yet e-invoicing and 3D printing are reducing low-value document runs. Carriers court financial-services traffic with track-and-trace APIs and GDPR-compliant data hosting, a requirement that overseas rivals sometimes struggle to meet under Swiss privacy statutes.
Geography Analysis
Switzerland’s compact urban clusters and excellent trunk roads underpin a tight delivery mesh that keeps the average last-mile distance below 9 km in the plateau cantons. The Switzerland courier, express, and parcel market sees Basel, Zürich, and Geneva account for nearly two-thirds of parcel injections, enabling route planners to achieve stop densities exceeding 150 parcels per tour on peak days. In Alpine cantons, average density falls under 50, lengthening driver duty hours and inflating unit costs.
Border adjacency to Germany, France, Italy, and Austria underpins the cross-border growth differential. Rhine-side hubs enjoy barge and rail access, streamlining industrial imports for onward Swiss distribution. VAT-threshold reforms draw EU merchants to position stock in Swiss depots, leveraging free-trade agreements to re-export into the bloc via return loops. Nevertheless, cantonal fragmentation—26 tax regimes and differing Sunday rest laws—creates compliance overheads for nationwide networks.
Airport freight constraints are region-specific: Geneva’s stricter 23:00 quiet window forces west-Swiss express flights to shift to Lyon-Saint-Exupéry, extending road hand-off legs. Zürich’s gate allotment favors wide-bodied passengers, limiting ad-hoc freighter slots. Carriers employ night-road linehauls to Liège and Milan to bypass curfews. Meanwhile, rail corridors such as the Lötschberg Base Tunnel permit 750-m freight trains, offering green alternatives for bulk parcel containers.
Competitive Landscape
Swiss Post, DHL Group, and UPS dominate volume, yet their combined share remained a marginal share, keeping the Switzerland courier, express, and parcel market moderately consolidated. Swiss Post exploits its universal-service obligation to sustain the broadest rural reach, funded partly by profits from its growing cybersecurity arm following the Open Systems buyout. DHL Group deepens sector specialization through a EUR 2 billion (USD 2.20 billion) global health-logistics program that allocates fresh cool-chain capacity to Basel’s pharma cluster. Planzer wields regional clout: the Sifte Berti acquisition integrates Italian north-south flows, enlarging its customs-clearing proposition.
Competitive moats increasingly revolve around zero-emission fleets, machine-learning route engines, and bonded-warehouse digital twins. UPS pilots autonomous e-quad cycles in Bern’s pedestrian core, shaving 14% off fuel spend. QuickPac leverages an all-electric van fleet to win green-delivery contracts from fashion etailers.
Smaller incumbents like Flash and Swissconnect defend share through the same-day and medical-courier niches where chain-of-custody rigor trumps sheer scale. Capacity alliances emerge: Swiss Post and La Poste share linehaul on Bern-Paris lanes, optimizing trailer fill and cutting carbon per parcel.
Switzerland Courier, Express, And Parcel (CEP) Industry Leaders
Swiss Post Ltd.
DHL Group
United Parcel Service (UPS)
La Poste Group
Planzer Holding AG
- *Disclaimer: Major Players sorted in no particular order

Recent Industry Developments
- June 2025: La Poste partnered with Pathway to build a live AI digital twin of its fleet, cutting fleet capex by over 10%.
- April 2025: DHL Group committed EUR 2 billion (USD 2.20 billion) to expand DHL Health Logistics, including new temperature-controlled rooms in Basel.
- January 2025: Planzer Holding AG acquired Italy’s Sifte Berti to bolster EU-Switzerland cross-border trucking.
- May 2024: Swiss Post unveiled its “Swiss Post of Tomorrow” 2025-2028 strategy, earmarking CHF 100 million (USD 118.79 million) for branch modernisation and hybrid digital-physical services.


Switzerland Courier, Express, And Parcel (CEP) Market Report Scope
Domestic, International are covered as segments by Destination. Express, Non-Express are covered as segments by Speed Of Delivery. Business-to-Business (B2B), Business-to-Consumer (B2C), Consumer-to-Consumer (C2C) are covered as segments by Model. Heavy Weight Shipments, Light Weight Shipments, Medium Weight Shipments are covered as segments by Shipment Weight. Air, Road, Others are covered as segments by Mode Of Transport. E-Commerce, Financial Services (BFSI), Healthcare, Manufacturing, Primary Industry, Wholesale and Retail Trade (Offline), Others are covered as segments by End User Industry.| Domestic |
| International |
| Express |
| Non-Express |
| Business-to-Business (B2B) |
| Business-to-Consumer (B2C) |
| Consumer-to-Consumer (C2C) |
| Heavy Weight Shipments |
| Light Weight Shipments |
| Medium Weight Shipments |
| Air |
| Road |
| Others |
| E-Commerce |
| Financial Services (BFSI) |
| Healthcare |
| Manufacturing |
| Primary Industry |
| Wholesale and Retail Trade (Offline) |
| Others |
| Destination | Domestic |
| International | |
| Speed of Delivery | Express |
| Non-Express | |
| Model | Business-to-Business (B2B) |
| Business-to-Consumer (B2C) | |
| Consumer-to-Consumer (C2C) | |
| Shipment Weight | Heavy Weight Shipments |
| Light Weight Shipments | |
| Medium Weight Shipments | |
| Mode of Transport | Air |
| Road | |
| Others | |
| End User Industry | E-Commerce |
| Financial Services (BFSI) | |
| Healthcare | |
| Manufacturing | |
| Primary Industry | |
| Wholesale and Retail Trade (Offline) | |
| Others |


Market Definition
- Courier, Express, and Parcel - The Courier, Express, and Parcel services, often called as CEP Market, refers to the logistics and postal service providers which specialize in moving small goods (parcels/packages). It captures the overall market size (USD) and market volume (number of parcels) of (1) the shipments/parcels/packages which are under 70kgs/ 154lbs weight, (2) Business Customer packages viz. Business-to-Business (B2B) & Business-to-Consumer (B2C) as well as private customer packages (C2C), (3) non-express parcel delivery services (Standard and Deferred) as well as express parcel delivery services (Day-Definite-Express and Time-Definite-Express), (4) domestic as well as international shipments.
- Demographics - To analyse total addressable market demand, population growth & forecasts have been studied and presented in this industry trend. It represents population distribution across categories like gender (male/female), development area (urban/rural), major cities among other key parameters like population density and final consumption expenditure (growth and share % of GDP). This data has been used for assessing the fluctations in demand & consumption expenditure, and the major hotspots (cities) of potential demand.
- Domestic Courier Market - Domestic Courier Market refers to the CEP shipments wherein the origin and destination is within the boundary of the geography studied (country or region as per the scope of report). It captures the market size (USD) and market volume (number of parcels) of (1) the shipments/parcels/packages which are under 70kgs/ 154lbs weight, including light weight shipments, medium weight shipments and heavy weight shipments (2) Business Customer packages viz. Business-to-Business (B2B) & Business-to-Consumer (B2C) as well as private customer packages (C2C), (3) non-express parcel delivery services (Standard and Deferred) as well as express parcel delivery services (Day-Definite-Express and Time-Definite-Express).
- E-Commerce - This end user industry segment captures the external (outsourced) logistics expenditure incurred by the e-tailers, through online sales channel, on Courier, Express, and Parcel (CEP) services. The scope includes (i) the supply chain of a company's online customer orders being fulfilled, (ii) the process of getting a product from the point of manufacturing to the point at which it is delivered to consumers. It involves managing inventory (deferred as well as time critical), shipping, and distribution.
- Export Trends and Import Trends - Overall logistics performance of an economy is positively and significantly (statistically) correlated to its trade performance (exports and imports). Hence, in this industry trend, total value of trade, major commodities/ commodity groups and the major trade partners, for the studied geography (country or region as per the scope of report) have been analysed alongside the impact of major trade/logistics infrastructure investments & regulatory environment.
- Financial Services (BFSI) - This end user industry segment captures the external (outsourced) logistics expenditure incurred by the BFSI players, on Courier, Express, and Parcel (CEP) services. CEP is important to the financial services industry in shipping of confidential documents and files. The establishments in this sector are engaged in (i) financial transactions (that is, transactions involving the creation, liquidation, or change in ownership of financial assets) or in facilitating financial transactions, (ii) financial intermediation, (iii) the pooling of risk by underwriting annuities and insurance, (iv) providing specialized services that facilitate or support financial intermediation, insurance and employee benefit programs, and (v) monetary control - the monetary authorities.
- Fuel Price - Fuel price spikes can cause delays and diruption for logistics service providers (LSPs), while drops in the same can result in higher short-term profitability and increased market rivalry to offer consumers with the best deals. Hence, the fuel price variations have been studied over the review period and presented along with the causes as well as market impacts.
- GDP Distribution by Economic Activity - Nominal Gross Domestic Product and distribution of the same, across major economic sectors in the geography studied (country or region as per scope of the report) have been studied and presented in this industry trend. As GDP is positively related to the profitability and growth of logistics industry, this data has been used in adjunction to the input-output tables/ supply-use tables for analyzing the potential major contributing sectors towards the logistics demand.
- GDP Growth by Economic Activity - Growth of Nominal Gross Domestic Product across major economic sectors, for the geography studied (country or region as per scope of the report) have been presented in this industry trend. This data has been utilized for assessing the growth of logistics demand from all the market end users (economic sectors considered here).
- Healthcare - This end user industry segment captures the external (outsourced) logistics expenditure incurred by the Healthcare players (Hospitals, clinics, mrdical centres) , on Courier, Express, and Parcel (CEP) services. The scope includes CEP services involved in the defrerred as well time critical movement of medical goods & supplies (surgical supplies and instruments, including gloves, masks, syringes, equipment). The establishments in this sector (i) include the ones providing medical care exclusively (ii) deliver services by trained professionals (iii) involve processes, including labor inputs of health practitioners with the requisite expertise (iv) are defined based on the educational degree held by the practitioners included in the industry.
- Inflation - Variations in both Wholesale Price Inflation (YoY change in producer price index) and Consumer Price Inflation have been presented in this industry trend. This data has been used to assess the inflationary environment as it plays a vital role in smooth functioning of the supply chain, directly impacting the logistics operational cost components e.g., pricing of tyres, driver wages & benefits, energy/fuel prices, maintenace costs, toll charges, warehousing rents, custom brokerage, forwarding rates, courier rates etc. hence impacting the overall freight and logistics market.
- Infrastructure - As infrastructure plays a vital role in an economy's logistics performance, variables like length of roads, distribution of road length by surface category (paved v/s unpaved), distribution of road length by road classification (expressways v/s highways v/s other roads), rail length, volume of containers handled by major ports and tonnage handled by major airports have been analysed and presented in this industry trend.
- International Express Service Market - International Express Service Market refers to the CEP shipments wherein the origin or destination is not within the boundary of the geography studied (country or region as per the scope of report). It captures the market size (USD) and market volume (number of parcels) of (1) the shipments/parcels/packages which are under 70kgs/ 154lbs weight, including light weight shipments, medium weight shipments and heavy weight shipments (ii) Inter-Region as well as Intra-Region Shipments
- Key Industry Trends - The report section named "Key Industry Trends" include all the key variables/parameters studied to better analyze the market size estimates and forecasts. All the trends have been presented in the form of data points (time series or latest available data points) along with analysis of the paramter in the form of concise market relevant commentary, for the geography studied (country or region as per the scope of report).
- Key Strategic Moves - The action taken by a company to differentiate from its competitor or used as a general strategy is referred to as a key strategic move (KSM). This includes (1) Agreements (2) Expansions (3) Financial Restructuring (4) Mergers and Acquisitions (5) Partnerships, and (6) Product Innovations. Key players (Logistics Service Providers, LSPs) in the market have been shortlisted, their KSM have been studied and presented in this section.
- Logistics Performance - Logistics Performance and Logistics Costs are the backbone of trade, and influences trade costs, making countries compete globally. Logistics performance is influenced by market wide adopted supply chain management strategies, government services, investments & policies, fuel/ energy costs, inflationary environment etc. Hence, in this industry trend, the logistics performance of the geography studied (country/ region as per the scope of report) has been analysed and presented over the review period.
- Manufacturing - This end user industry segment captures the external (outsourced) logistics expenditure incurred by the Manufacturing industry (including Hi-Tech/Technology) players, on Courier, Express, and Parcel (CEP) services. The end user players considered are the establishments primarily engaged in the chemical, mechanical or physical transformation of materials or substances into new products. Logistics Service Providers (LSPs) play a crucial role in maintaining a smooth flow of raw materials across the supply chain, enabling timely delivery of finished goods to distributors or end customers and storing & supplying the raw materials to clients for just-in-time manufacturing.
- Other End Users - Other end user segment captures the external (outsourced) logistics expenditure incurred by the construction, real estate, educational services, and professional services (administrative, waste management, legal, architectural, engineering, design, consulting, scientific R&D), on Courier, Express, and Parcel (CEP) services. Logistics Service Providers (LSPs) plays a crucial role in the reliable movement of time critical supplies and documents to/from these industries such as transporting any equipment or resources required, shipping confidential documents and files.
- Primary Industry - This end user industry segment captures the external (outsourced) logistics expenditure incurred by the AFF (Agriculture, Fishing, and Forestry) and Extraction indsutry (Oil &Gas, Quarrying and Mining) players, on Courier, Express, and Parcel (CEP) services. The end user players considered are the establishments (i) primarily engaged in growing crops, raising animals, harvesting timber, harvesting fish & other animals from their natural habitats and providing related support activities; (ii) that extract naturally occurring mineral solids, such as coal and ores; liquid minerals, such as crude petroleum; and gases, such as natural gas. Herein, Logistics Service Providers (LSPs) (i) play a crucial role in acquisition, storage, handling, transportation, and distribution activities for the optimal & continuous flow of inputs (seeds, pesticides, fertilizers, equipment, and water) from manufacturers or suppliers to the producers and smooth flow of output (produce, agro-goods) to distributors/ consumers; (ii) cover entire phases from upstream to downstream and play a crucial role in the transportation of machinery, drilling equipments, extracted minerals, crude oil & natural gas and refined/ processed products from one place to another. This includes both termperature controlled and non-temperature controlled logistics, as and when required according to the shelf life of goods being transported or stored.
- Producer Price Inflation - It indicates inflation from viewpoint of the producers viz. the average selling price received for their output over a period of time. Annual change (YoY) of producer price index is reported as wholesale price inflation in the "Inflation" industry trend. As WPI captures dynamic price movements in most comprehensive way, it is widely used by governments, banks, industry, business circles and is deemed important in formulation of trade, fiscal and other economic policies. The data has been used in adjunction to consumer price inflation for better understanding the inflationary environment.
- Segmental Revenue - Segmental Revenue has been triangulated or computed and presented for all the major players in the market. It refers to the courier, express, and parcel (CEP) market specific revenue earned by the company, over the base year of study, in the geography studied (country or region as per the scope of report). It is computed through the study and analysis of major parameters like financials, service portfolio, employee strength, fleet size, investments, number of countries present in, major economies of concern, etc. that have been reported by the company in its annual reports, webpage. For companies having scarce financial disclosures, paid databases like D&B Hoovers, Dow Jones Factiva have been resorted to and verified through industry/expert interactions.
- Transport and Storage Sector GDP - Value and growth of Transport and Storage Sector GDP has a direct relation to the freight and logistics market size. Hence, this variable has been studied and presented over the review period, in value terms (USD) and as share % of total GDP, in this industry trend. The data has been supported by concise and relevant commentary around the investments, developments, and current market scenario.
- Trends in E-Commerce Industry - Enhanced internet connectivity and boom in smartphone penetration, coupled with increasing disposable incomes, has led to a phenomenal growth in the e-commerce market globally. Online shoppers require fast and efficient delivery of their orders leading to an increase in the demand for logistics services especially e-commerce fulfilment services. Hence, the Gross Merchandise Value (GMV), historial and projected growth, breakup of major commodity groups in e-commerce industry for the studied geography (country or region as per scope of the report) have been analysed and presented in this industry trend.
- Trends in Manufacturing Industry - Manufacturing industry involves the transformation of raw materials into finished products, while logistics industry ensures the efficient flow of raw materials to the factory, and the transport of manufactured products to the distributors & consumers. Demand-Supply of both industries are highly cross-linked and critical for a seamless supply chain. Hence, the Gross Value Added (GVA), breakup of GVA into major manufacturing sectors, and growth of manufacturing industry over the review period have been analysed and presented, in this industry trend.
- Wholesale and Retail Trade (Offline) - This end user industry segment captures the external (outsourced) logistics expenditure incurred by the wholesalers and retailers, through offline sales channel, on Courier, Express, and Parcel (CEP) services. The end user players considered are the establishments primarily engaged in wholesaling or retailing merchandise, generally without transformation, and rendering services incidental to the sale of merchandise. Logistics Service Providers (LSPs) plays a crucial role in the reliable movement of supplies to and finished products from production houses to the distributors and finally to the end customer covering activites like material sourcing, transportation, order fulfillment, warehousing & storage, demand forecasting, inventory management etc.
| Keyword | Definition |
|---|---|
| Axle Load | The axle load refers to the total load (weight) bearing on the roadway through wheels connected to a given axle. Across the globe, there are systems in place to ensure axle load monitoring, wherein surpassing the defined limits set by the concerned regulatory authority can lead to penalty/fine. For transportation of goods via road this can be an important determinant of costs as knowledge about the axle load limits can be used to (i) load the vehicle optimally for maximizing profits (ii) avoid exceeding the same and hence the probable fines associated (iii) avoid wear and tear of the vehicle (iv) avoid damage to pavement resulting in noticeable public maintenance and repair costs (v) achieve better turnaround time. |
| Back Haul | Backhaul is the return movement of a transport vehicle from its original destination to its original point of departure, and can include full, partial, or empty truck loads (all or part of the way) depending on the visibility of the local freight ecosystem. In this regard, transportation of empty containers to the point of origin, known as deadheading is also a significant factor, considering the supply/container shortages across the geographies, resulting in cost escalation and under optimized profit potential attainment. Generally, the carriers offer discounts on the backhaul, to secure freight for the trip. |
| Bill of Lading (BOL) | A bill of lading is a legal contract document issued by a carrier to a shipper to acknowledge reception of their cargo, and is evidence for the contract of carriage between the two parties. Broadly it details the (i) type, quantity, and other specifications of the goods being carried (ii) destination, and terms & conditions of the shipment (iii) carrier and drivers with all the necessary information to process the shipment, which can be used for insurance and customs clearance purposes (iv) assurance that the consignment is damage-free and ready to be shipped to the consignee. In this regard, a house bill of lading (HBL) is a document issued by a freight forwarder or a non-vessel operating common carrier (NVOCC) to acknowledge receipt of items for shipment (to a shipper). If shipments from several shippers are involved a master bill of lading (MBL) might be involved which is a consolidated version of the same for all the shipments being taken care of by the carrier (to a common destination) and might be issued by the carrier to the freight forwarder or the shipper (depending on who books the transport). |
| Bunkering | Bunkering is the process of supplying fuel to power the propulsion system of a ship. It includes the logistics of loading and distributing the fuel among available shipboard tanks. In this regard, (i) Bunker fuel is technically any type of fuel oil used aboard ships. It gets its name from the containers on ships and in ports that it is stored in; in the days of steam they were coal bunkers but now they are bunker-fuel tanks, (ii) Bunker refers to the spaces (Tank) on board a vessel to store fuel, (iii) Bunker trader refers to a person dealing in trade of bunker (fuel), (iv) Bunker call is made when a cargo ship anchors or berths in a port to take on bunker oil or supplies, (v) Bunkering service is the supply of a requested quality and quantity of bunkers to a ship. Bunkering is signficant from point of view of freight rates applicable to the shipper as Bunker Contribution (BUC)/ Fuel Adjustment Factor (FAF)/ Bunker Adjustment Factor (BAF) are applied by shipping lines to offset the effect of fluctuations in the cost of bunkers. |
| Cabotage | Transport by a vehicle registered in a country, performed on the national territory of another country. Cabotage law may restrict domestic cargo traffic to be carried in its own nationally registered, and sometimes built and crewed vehicles, though regulations vary across industries/commodity groups/countries and sometimes specify maximum allowable percentage of cabotage that can be serviced by foreign registered fleet. |
| C-commerce | Collaborative commerce (also known as C-commerce), (i) describes electronically enabled business interactions among an enterprise’s internal personnel, business partners and customers throughout a trading community (industry, industry segment, supply chain or supply chain segment); (ii) is the optimization of supply and distribution channels to capitalize on the global economy by using new technology efficiently. Advantages of C-commerce, to detail few include (i) maximization of organization's efficiency and profitability (ii) technology integration with physical channels to allow companies to work together (iii) increased information exchange such as inventory and product specifications, using the web as an intermediary (iv) increased competitiveness by reaching a broader audience. Examples of C-commerce, also known as peer-to-peer commerce, include (i) companies that allow consumers to rent things from each other, or marketplaces, such as Meta (formerly Facebook) Marketplace, that allow the sale of used goods; (ii) DoorDash teamed up with many national brands, such as McDonald’s and Chipotle, to offer fast food delivery, building their business model on c-commerce. They have since expanded their delivery service from restaurants to retailers and even offer 'fleets' of drivers to businesses. |
| Courier | A business/company that delivers packages/parcels/shipments (upto 70 kgs) including quick door to door pickup and delivery service for goods or documents, domestically or internationally, on a commercial contract basis. Example, DHL Group, FedEx, United Parcel Service of America, Inc., USPS, International Distributions Services, J&T Express, SF Express among several others |
| Cross docking | Cross docking is a practice in logistics management that includes unloading incoming delivery vehicles and loading the materials directly into outbound delivery vehicles, omitting traditional warehouse logistical practices and saving time and money. It requires close synchronization of both inbound and outbound movements. It is highly significant in reduction of costs pertaining to warehousing & storage (and the associated Value Added Services). |
| Cross Trade | International transport between two different countries performed by a vehicle registered in a third country. A third country is a country other than the country of loading/embarkation and the country of unloading/disembarkation. Cross Trade law may restrict international cargo traffic to be carried by respective country's registered vehicles, and sometimes built and crewed vehicles, though regulations vary across industries/commodity groups/countries and sometimes specify maximum allowable percentage of cross trade that can be serviced by foreign registered fleet. |
| Customs Clearance | The process of declaring and clearing cargoes through customs. It includes the procedures involved in getting cargo released by Customs through designated formalities such as presenting import license/permit, payment of import duties and other required documentations by the nature of the cargo. In this regard, a customs broker is a person or company licensed by the respective department of the country to act on behalf of freight importers and exporters. |
| Dangerous Goods | Dangerous goods (or hazardous materials or HAZMAT) include flammable liquids/solids, gases (compressed, liquified, dissolved under pressure), corrosives, oxidising substances, explosive substances and articles, substances which on contact with water emit flammable gasses, organic peroxides, toxic substances, infectious substances, radioactive materials, miscellaneous dangerous goods and articles. |
| First mile Delivery | First mile delivery refers to the (i) first stage of the freight/shipment/cargo/courier transportation (ii) the transportation of goods from a merchant’s premises or warehouse to the next fulfillment centre/warehouse/hub from where the goods are forwarded (iii) shipping goods from local distribution centers to stores (For retailers) (iv) transportation of finished goods from a plant or a factory to a distribution center (For manufacturers), (v) pick up of goods from the end-customer’s home or store followed by movement to a warehouse or storage location (movers and packers), (vi) process where goods are picked up from a retailer and then transferred to third-party logistics providers or courier service providers to be delivered to the end-consumer (e-commerce). Once the package reaches the next warehouse or the courier’s hub, it is then sorted and transported further until it reaches the customer’s doorstep. Example, if one chooses UPS as a courier, first-mile delivery will be the product being delivered from manufacturer's/retailer's warehouse to the UPS’s warehouse/ fulfilment centre. |
| Last Mile Delivery | Last mile delivery refers to the very last step of the delivery process when a parcel is moved from a transportation hub (warehouse or a distribution center or fulfillment centre) to its final destination, which usually is a personal residence/retail store/ business, or parcel locker. It accounts for around half of the total cost involved in entire process of first mile, middle mile, and last mile delivery, though it can vary shipment to shipment, based on commodity, business model and similar factors. |
| Milkrun | A Milk Run is a delivery method used to transport mixed loads from various suppliers to one customer, using lean management principles applied to logistics. Instead of each supplier sending a truck every week to meet the needs of one customer, one truck (or vehicle) visits the suppliers to pick up the loads for that customer. This method of transport got its name from the dairy industry practice, where one tanker used to collect milk from several dairy farms for delivery to a milk processing company. A milk run can be a more efficient way to handle logistics but require proper planning. If the route involves products from different companies, there is need for an agreement about cost-sharing and other aspects of the cooperative delivery arrangement. Once the group settles these issues, this delivery method can save time and money for everyone by pooling operation costs and resources. |
| Multi country consolidation | Multi-Country Consolidation (MCC) is a cost-effective solution that consolidates one's cargo from different countries of origin to build Full Container Loads (FCL). MCC is most suitable for companies that import light volumes of goods from multiple countries but want to take advantage of the more economic FCL freight rates. Apart from costing some of the other advantages include (i) flexibility to choose suppliers from a wider range of origin countries without worrying about the logistics to final destination from each origin, (ii) ability to pick the most suitable suppliers from many different countries for one's business operations. The increase in one's sourcing options by MCC provides the kind of flexibility needed in competitive global markets. |
| Q-commerce | Q-commerce, also referred to as quick commerce, is a type of e-commerce where emphasis is on quick deliveries, typically in less than an hour. The companies providing Q-Commerce services might have vertically intergrated model or might be using third party delivery platforms (outsourced logistics). It has advantages like (i) competitve USP, (ii) potential to earn greater profit margins, (iii) better customer experience, (iv) guaranteed availability of products, (v) traceability, and (vi) scaleability. |
| ReverseLogistics | Reverse logistics is a type of supply chain management that moves goods from customers back to the sellers or manufacturers and may involve ciruclar economy principles (3Rs) viz. recycling, reuse (repurposing, reselling), reducing or repairing. In this regard, reverse commerce (or Recommerce) is the selling of previously owned items through physical or online marketplaces/distribution channels to buyers who reuse, recycle or resell them. |


Research Methodology
Mordor Intelligence follows a four-step methodology in all our reports.
- Step-1: Identify Key Variables: In order to build a robust forecasting methodology, the variables and factors identified in Step-1 are tested against available historical market numbers. Through an iterative process, the variables required for market forecast are set and the model is built on the basis of these variables.
- Step-2: Build a Market Model: Market-size estimations for the forecast years are in nominal terms. Inflation is considered to be a part of the pricing, and the average selling price (ASP) is varying throughout the forecast period for each country
- Step-3: Validate and Finalize: In this important step, all market numbers, variables and analyst calls are validated through an extensive network of primary research experts from the market studied. The respondents are selected across levels and functions to generate a holistic picture of the market studied.
- Step-4: Research Outputs: Syndicated Reports, Custom Consulting Assignments, Databases & Subscription Platforms


