
Sustainable Seafood Market Size and Share
Market Overview
| Study Period | 2022 - 2032 |
|---|---|
| Market Size (2027) | USD 21.60 Billion |
| Market Size (2032) | USD 29.15 Billion |
| Growth Rate (2027 - 2032) | 6.18 % |
| Fastest Growing Market | Asia-Pacific |
| Largest Market | Europe |
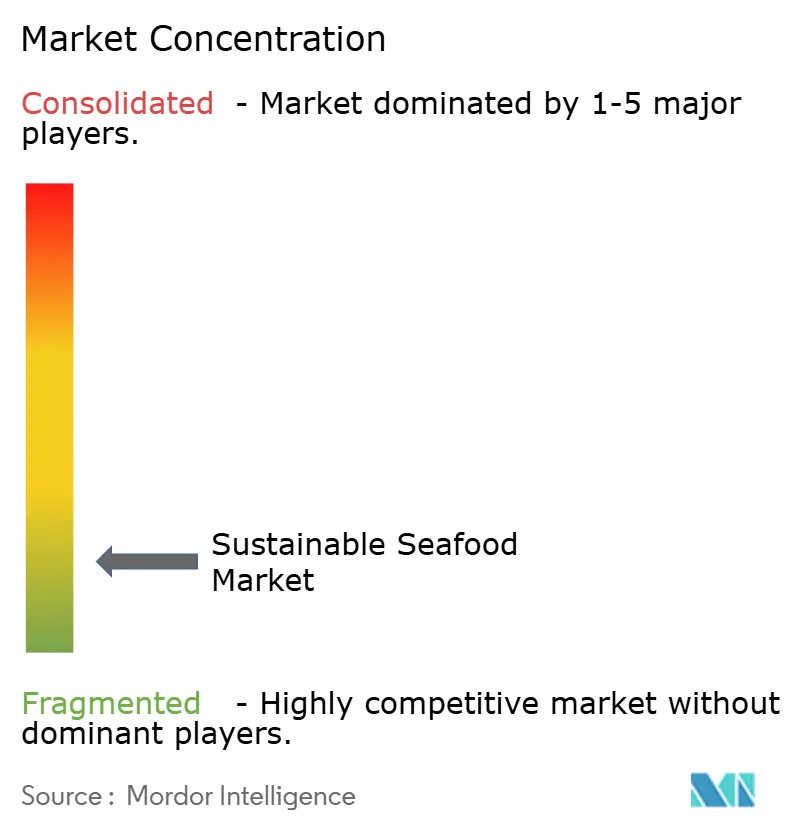
| Market Concentration | Low |
Major Players *Disclaimer: Major Players sorted in no particular order Image © Mordor Intelligence. Reuse requires attribution under CC BY 4.0. | |
Sustainable Seafood Market Analysis by Mordor Intelligence
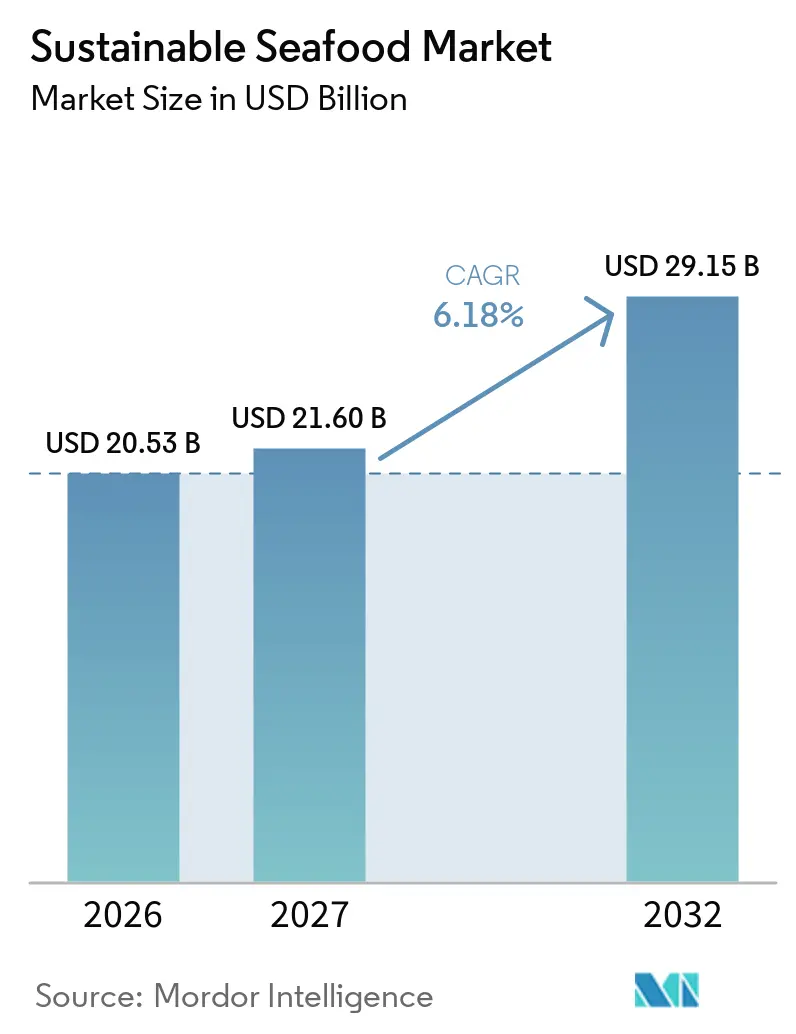
The Sustainable seafood market size was valued at USD 20.53 billion in 2026 and is estimated to reach USD 29.15 billion by 2032, at a CAGR of 6.18% during 2027-2032. The Sustainable seafood market is expanding as buyers give greater weight to verified sourcing, species traceability, and environmental performance. Fisheries participating in Marine Stewardship Council programs represented 20.6% of global wild marine catch in September 2025, showing that certified supply has moved beyond a niche position. Retailers and foodservice buyers are raising sourcing requirements, which makes certification more important for access to premium channels. The Sustainable seafood market also faces uneven supply conditions because ocean warming can shift stocks and disrupt established harvest patterns. Companies with credible controls over sourcing, labeling, and contracted supply are better placed to serve customers that need dependable certified volume.
Key Report Takeaways
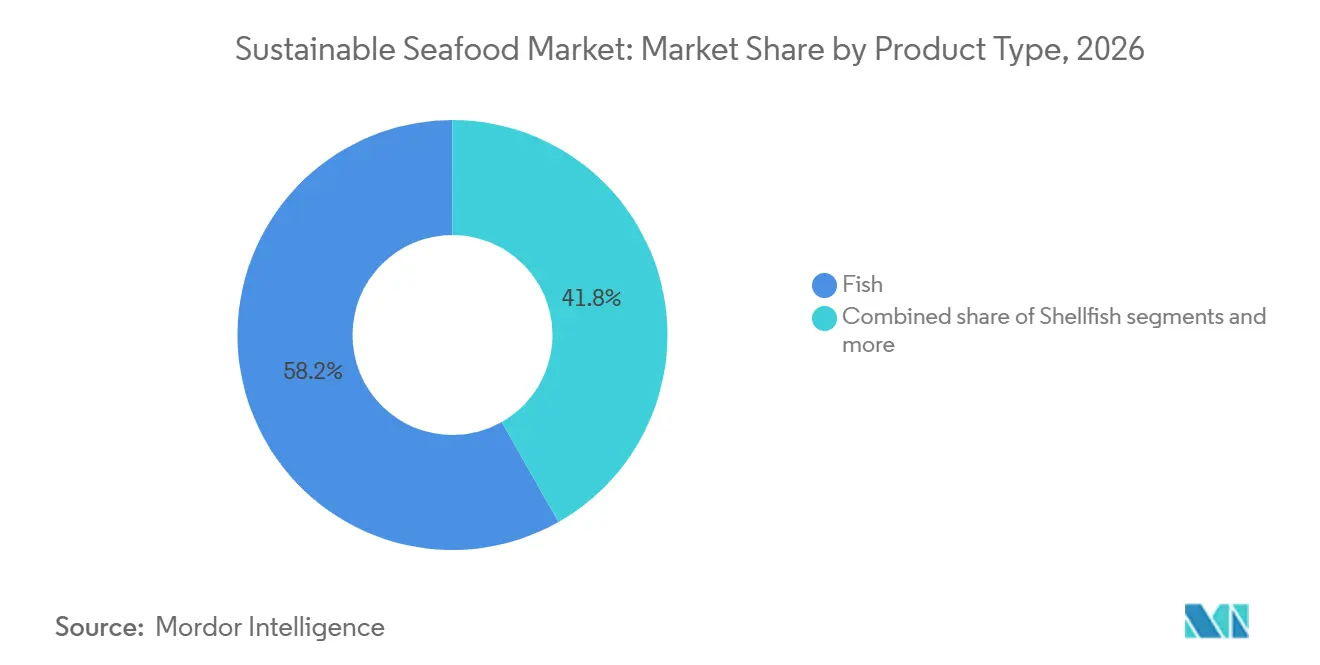
- By product type, fish held 58.2% of market value in 2026, while seaweed and algae-based products are forecast to grow at a 7.4% CAGR through 2032.
- By form, frozen held 41.6% of market value in 2026, while canned seafood is forecast to grow at an 8.1% CAGR through 2032.
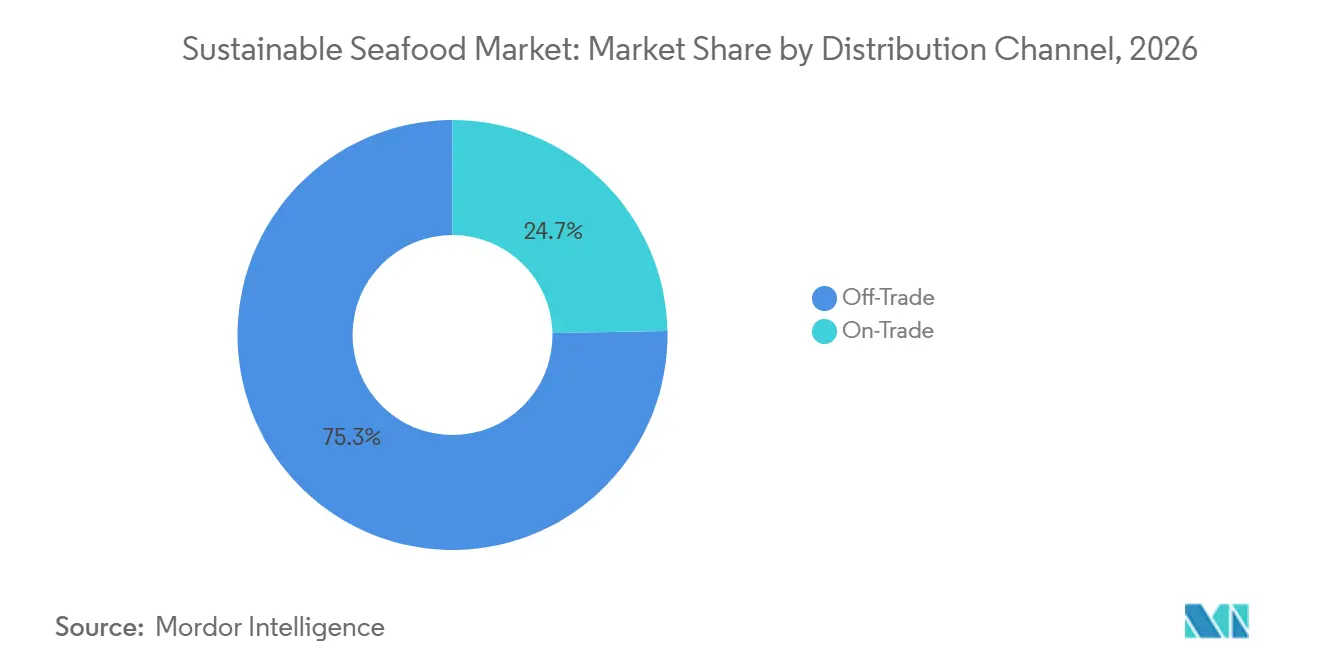
- By distribution channel, off-trade accounted for 75.3% of market value in 2026, while on-trade is forecast to grow at an 8.3% CAGR through 2032.
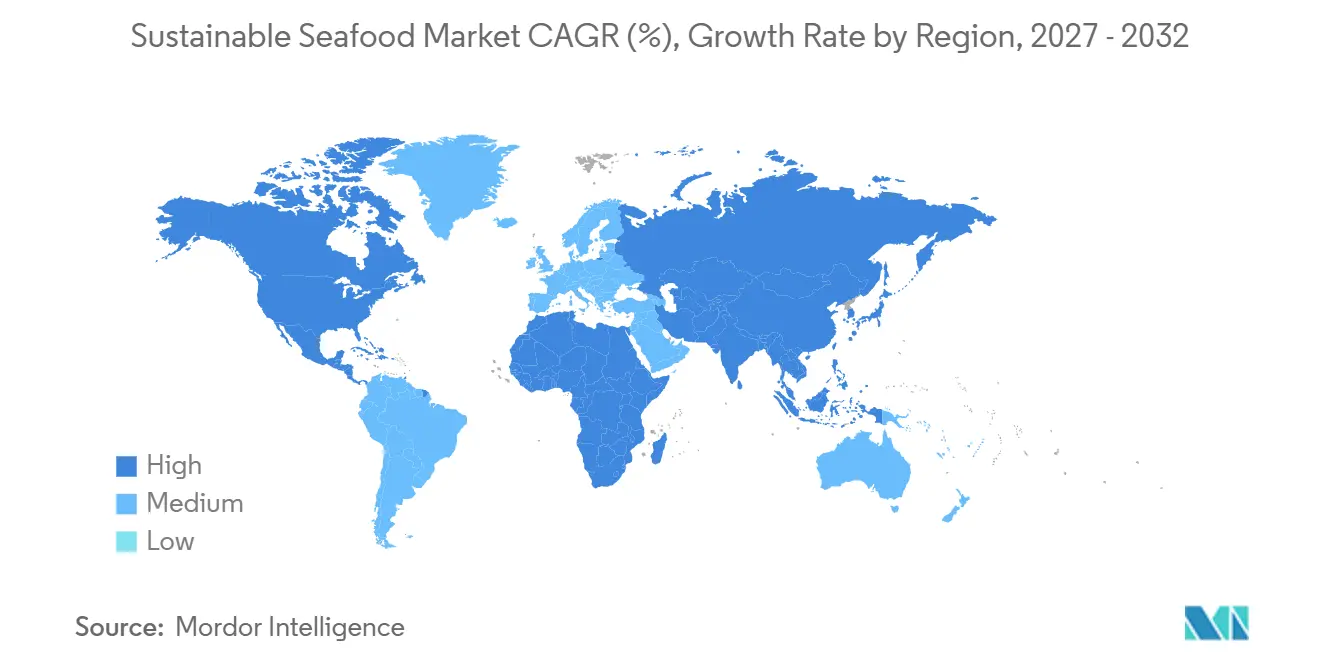
- By geography, Europe held 36.4% of market value in 2026, while Asia-Pacific is forecast to grow at an 8.5% CAGR through 2032.
Note: Market numbers in this report are based on Mordor Intelligence's proprietary estimation framework, which combines nine months of actuals with Q4 projections for base year 2026.
Market Trends and Insights
Drivers Impact Analysis of Sustainable Seafood Market*
| Driver | (~) % Impact on CAGR Forecast | Geographic Relevance | Impact Timeline |
|---|---|---|---|
| Rising consumer awareness of overfishing and ocean health | +1.1% | Global, with concentrated impact in Europe and North America | Short term (≤ 2 years) |
| Expansion of eco-certification programs (MSC, ASC, BAP) | +1.4% | Global (Europe and North America leading; Asia-Pacific accelerating) | Medium term (2–4 years) |
| Shift toward flexitarian and pescatarian diets | +0.8% | Europe, North America, with growing relevance in urban Asia-Pacific | Short to medium term |
| Growth of e-commerce and direct-to-consumer seafood channels | +0.7% | Asia-Pacific, North America | Short term (≤ 2 years) |
| Advancements in sustainable aquaculture | +1.0% | Global (Asia-Pacific production core, spill-over to Europe and South America) | Medium to long term (2–5 years) |
| Retailer and foodservice sustainability commitments | +0.6% | Europe, North America, emerging in East Asia | Medium term (2–4 years) |
| Source: Mordor Intelligence | |||
Rising Consumer Awareness of Overfishing and Ocean Health
Consumer concern is changing the way seafood is selected, especially among younger shoppers. A 2025 Marine Stewardship Council and GlobeScan survey found that 27% of respondents aged 18 to 24 had reduced seafood consumption to protect the ocean, while 89% of people aged 18 to 34 were concerned about ocean health. This does not automatically reduce demand in the Sustainable seafood market because many consumers shift toward products with recognizable sourcing credentials[1]. The Food Industry Association reported that 32% of United States consumers ate seafood 2 or more times weekly in 2025, and Gen Z and Millennials represented more than half of heavy seafood consumers. Brands that cannot substantiate sustainability claims may find it harder to retain placement in premium grocery channels. Clear on-pack certification and traceable origin information therefore support both consumer confidence and retailer acceptance.
Expansion of Eco-Certification Programs
Certification programs are expanding the set of operating practices required for suppliers seeking recognized sustainable credentials. The Aquaculture Stewardship Council launched its Farm Standard in May 2025, bringing environmental, social, and animal welfare requirements into one framework. Marine Stewardship Council programs involved 744 fisheries by October 2025 and covered 20.6% of the global wild marine catch. ALDI South Group added the MSC Improvement Program to its sourcing policy in January 2025, creating a procurement route for fisheries working toward full certification. In Japan, the number of MSC chain-of-custody certified businesses exceeded 400 in October 2025, indicating stronger commercial adoption across the supply base. The Sustainable seafood market benefits when certification helps buyers compare suppliers, although smaller producers can face higher compliance demands.
Growth of E-Commerce and Direct-to-Consumer Seafood Channels
Online channels provide producers with more ways to sell origin-specific seafood and communicate their sourcing practices directly to consumers. Unlike physical packaging, digital listings do not always display certification marks clearly, which makes product-page content, batch data, and digital labeling important for the sustainable seafood market. Direct-to-consumer operators can communicate harvest location, handling practices, and supply chain details without relying solely on retail shelf placement. As more consumers shift to online grocery and specialty food platforms, access to certified seafood products has widened. However, this depends on suppliers maintaining consistent and verifiable proof points across each platform. When producers provide clear and accurate information online, it helps build consumer trust and supports informed purchasing decisions in the sustainable seafood market.
Advancements in Sustainable Aquaculture
Aquaculture technology is becoming more important as wild-catch supply faces greater environmental variation. The European Commission identified algae-based feed as a viable and nutritionally equivalent substitute for fishmeal and fish oil in aquaculture in 2025[2]. The ASC Farm Standard also extends certification considerations to aquaculture production systems, including seaweed. Producers are investing in feed efficiency, animal welfare, water quality controls, and site selection to maintain supply while reducing production impacts. These investments can improve buyer access but can also widen the cost gap between well-capitalized producers and smaller farms. The Sustainable seafood market is likely to reward operators that link productivity gains with credible environmental monitoring.
Restraints Impact Analysis of Sustainable Seafood Market*
| Restraint | (~) % Impact on CAGR Forecast | Geographic Relevance | Impact Timeline |
|---|---|---|---|
| Supply chain opacity and traceability gaps | -0.8% | Global (especially acute in Asia-Pacific processing hubs and multi-flag fishing fleets) | Short to medium term |
| Climate change and ocean warming | -0.9% | Global (tropical and subtropical regions most affected near term; high-latitude regions facing longer-term shifts) | Medium to long term (≥ 4 years) |
| Regulatory fragmentation across jurisdictions | -0.5% | Global, with greatest impact on exporters supplying multiple markets (EU, US, Japan) | Medium term (2–4 years) |
| High certification and compliance costs | -0.4% | Asia-Pacific and South America (SME-heavy aquaculture sectors); spill-over to MEA | Medium term |
| Source: Mordor Intelligence | |||
Supply Chain Opacity and Traceability Gaps
Traceability remains difficult when products pass through several processors, ports, and jurisdictions. A 2025 study in npj Ocean Sustainability found that current traceability tools are insufficient for enforcing import restrictions because routing through intermediate countries can obscure country-of-harvest information. The issue affects the Sustainable seafood market because certification premiums depend on buyers being able to distinguish verified product from mislabeled product. Inconsistent data practices can weaken enforcement and require buyers to assess chain-of-custody evidence alongside certificate status. Digital systems can help only when suppliers use common data standards and share information across the chain. Stronger verification is essential for converting sustainability claims into repeat purchasing decisions.
Climate Change and Ocean Warming
Ocean warming is already affecting the location, timing, and reliability of fishery output. The OECD projects that global fisheries catches could decline by 3.4% to 24.1% by the end of the century under different emissions scenarios. The same OECD review states that at least 37% of straddling stocks could shift between exclusive economic zones and the high seas by 2030. Certified fisheries face pressure when quotas lag stock movement, making supply contracts harder to fulfill. A 2026 Nature Communications study linked compound high-temperature and low-productivity events to extreme low-catch outcomes across 1,246 species and 254 regions. Diversified sourcing and adaptive procurement can reduce exposure, but they cannot eliminate the ecological risk.
*Our forecasts treat driver/restraint impacts as directional, not additive. The impact forecasts reflect baseline growth, mix effects, and variable interactions.
Sustainable Seafood Market Segment Analysis
By Product Type:
Fish Retains Scale While Seaweed and Algae ExpandFish held 58.2% of the sustainable seafood market share in 2026, driven by broad consumer acceptance of salmon and tuna. Salmon benefits from well-established aquaculture infrastructure and consistent demand across retail and foodservice channels. Tuna remains central to the sustainable seafood market due to its wide availability in retail formats such as canned and packaged products. To strengthen supply chain accountability, the Tuna Transparency Pledge expanded its membership in March 2025, adding Carrefour, Aramark, Culimer USA, Lusamerica Foods, and Pacific Island Tuna. All signatories committed to achieving 100% on-the-water monitoring across industrial tuna vessels by 2027, aimed at improving traceability and reducing illegal fishing practices.
Seaweed and algae-based products are forecast to expand at a 7.4% CAGR through 2032, making them one of the faster-growing segments in the sustainable seafood market. The European Commission has identified algae as a viable feed input that can reduce reliance on conventional fishmeal and fish oil, supporting more sustainable aquaculture practices. This recognition is creating demand across both food and aquaculture supply chains. In line with this, the European Union has set a target to increase seaweed production to 8 million tonnes by 2030. As production scales up, responsible site selection remains important to minimize environmental impact and ensure long-term sustainability of coastal ecosystems.

By Form:
Frozen Supports Global Trade While Canned Gains MomentumFrozen products accounted for 41.6% of the sustainable seafood market size in 2026, making them the dominant product format. Their dominance is largely due to their suitability for long-distance trade, as freezing extends shelf life and allows seafood to be transported across international supply chains without quality loss. Frozen formats also preserve batch identity across processing and distribution stages, which is critical for traceability in certified sustainable seafood. Additionally, they support cold-chain planning for large buyers such as retailers and foodservice operators. Fresh and chilled products remain important in premium retail, where consumers prioritize quality and freshness, while processed products continue to serve convenience-oriented and private-label demand.
Canned seafood is forecast to grow at an 8.1% CAGR through 2032, driven by ongoing efforts from brands to update and improve shelf-stable formats. In July 2026, Thai Union launched a recyclable mono-material tuna pouch under its John West brand, directly addressing packaging recyclability constraints that have been a concern for environmentally conscious consumers. Canned tuna remained the third most consumed seafood in the United States in 2025, reflecting the continued popularity of shelf-stable seafood among everyday consumers. Familiar formats such as cans and pouches also make it easier for consumers to identify and trust certified sustainable sourcing, as recognizable packaging helps communicate product credentials at the point of sale.
By Distribution Channel:
Off-Trade Holds the Largest Position While On-Trade Grows FasterOff-trade channels held 75.3% of the sustainable seafood market in 2026, making them the dominant distribution channel. Supermarkets, hypermarkets, and online retailers display certification marks at the point of purchase, helping consumers make informed choices. Large retailers can apply sourcing rules across private-label ranges, ensuring consistency in sustainability standards. ALDI South Group adopted the MSC Improvement Program in 2025, reflecting a broader retail commitment to responsible sourcing. Online retail and direct delivery further extend access to certified seafood beyond full-format stores, reaching a wider consumer base.
On-trade channels are forecast to grow at an 8.3% CAGR through 2032, driven by increasing consumer demand for sustainably sourced seafood in restaurants and hospitality venues. Foodservice buyers can use species names, provenance, and certification in menu positioning to attract environmentally conscious diners. Las Vegas Sands states that its food and beverage operations source MSC- and ASC-certified seafood, demonstrating how large hospitality operators are integrating sustainability into their procurement practices. However, climate-related disruption can make specific species harder to source, requiring operators to develop alternative plans that maintain sustainability commitments while managing supply chain risks.
Geography Analysis
Europe Sustainable Seafood Market
Europe held 36.4% of the Sustainable seafood market share in 2026, supported by retailer policies and consumer recognition of certification labels. ALDI South Group has expanded a pathway for fisheries working toward recognized certification. The region combines significant consumption with major salmon production and trade links. Retailer requirements also shape access for exporters serving the Sustainable seafood market in Europe.
APAC Sustainable Seafood Market
Asia-Pacific is forecast to expand at an 8.5% CAGR through 2032, making it the fastest-growing regional part of the Sustainable seafood market. The region is central to aquaculture output in the Sustainable seafood market. METRO China committed in October 2025 to source all private-label wild-caught seafood from MSC-certified fisheries by 2026. China introduced a domestic China Fisheries Association certification system in January 2026. South Korea is strengthening cooperation on aquaculture certification through the National Institute of Fisheries Science and ASC.
The Americas and MEA Sustainable Seafood Market
North America has an established base of certified fisheries in the Sustainable seafood market, with 90% of United States fisheries by volume MSC certified in January 2026. South America is important because Chile and Peru supply aquaculture and wild-capture products. El Niño disruptions to Peruvian anchovy can affect fishmeal availability. The Middle East and Africa are developing consumer regions and export supply sources. Africa's aquatic product imports are projected to grow 27% by 2034.
Competitive Landscape
The Sustainable seafood market is fragmented in nature. Competition in the Sustainable seafood market varies across the value chain. Salmon farming, shrimp farming, and tuna fishing have larger upstream producers. Processing, distribution, and branded retail have many more operators. The Sustainable seafood market can consolidate within individual categories while remaining fragmented overall.
Thai Union, Mowi, and Nissui are active across several parts of the value chain. Thai Union introduced a recyclable mono-material tuna pouch in July 2026. This shows how packaging innovation can differentiate an established product. Scale, reliable sourcing, and product redesign are relevant competitive tools in the Sustainable seafood market. Companies that document progress can improve their position with retail and foodservice buyers.
BlueNalu secured USD 11 million in December 2025 to advance cell-cultivated bluefin tuna toro. Bakkafrost and JBT Marel signed an agreement for the first EVi automated salmon gutting machine in May 2025. Production technology and alternative formats broaden competitive options. Smaller firms face greater pressure as certification costs and buyer requirements rise.
Sustainable Seafood Industry Leaders
-
Thai Union Group Public Company Limited
-
Mowi ASA
-
Umios Corporation
-
Nissui Corporation
-
Charoen Pokphand Foods Public Company Limited
- *Disclaimer: Major Players sorted in no particular order
Sustainable Seafood Market Companies Covered in this Report
- Thai Union Group Public Company Limited
- Mowi ASA
- Umios Corporation
- Nissui Corporation
- Maruha Nichiro Corporation
- Trident Seafoods Corporation
- High Liner Foods Incorporated
- Cooke Inc.
- Charoen Pokphand Foods Public Company Limited
- Bakkafrost P/F
- SalMar ASA
- Lerøy Seafood Group ASA
- Grieg Seafood ASA
- Nippon Suisan Kaisha, Ltd.
- Dongwon Industries Co., Ltd.
- Clearwater Seafoods Limited Partnership
- Austral Fisheries Pty Ltd
- Sea Harvest Group Limited
- Nueva Pescanova Group
- BlueNalu, Inc.
Recent Industry Developments in Sustainable Seafood Market
- July 2026: SalMar ASA announced the acquisition of Heimstø AS's 70% stake in Måsøval AS, a Central Norway salmon farmer, in a deal valuing Måsøval's total share capital at NOK 4.8 billion (USD 445 million), representing a 71.7% premium to Måsøval's pre-review closing price. The transaction positions SalMar as the dominant salmon farmer in Norway's Central region.
- July 2026: Thai Union Group launched the seafood industry's first shelf-stable tuna product in a recyclable mono-material pouch under its John West brand, rolling out in the United Kingdom and Ireland at Sainsbury's, Waitrose, Asda, and Ocado.
- January 2026: Mowi ASA received European Commission approval for its controlling stake in Norwegian salmon peer Nova Sea, bringing the combined entity's projected Norwegian harvest to 157,000 tonnes and its global harvest to 572,000 tonnes.
- January 2026: Mowi ASA and CP AXTRA established Thailand's first fully integrated premium salmon supply chain, co-launching the Aro Gold x Mowi brand with 5 Ready-to-Cook and Ready-to-Eat SKUs distributed nationally through Makro stores.
Global Sustainable Seafood Market Report Scope
The Sustainable Seafood Market refers to the market for seafood products sourced from fisheries or aquaculture operations that follow responsible harvesting, farming, and resource management practices intended to maintain aquatic ecosystems, protect marine biodiversity, and support the long-term availability of seafood resources. By product type, the market is segmented into fish, shellfish, seaweed and algae-based products, and others. By form, the market is divided into canned, fresh/chilled, frozen, and processed products. By distribution channel, the market is segmented into off-trade and on-trade channels. Geographically, the market covers North America, Europe, Asia-Pacific, South America, and the Middle East and Africa, with country-level coverage across major markets within each region. Market size and growth forecasts are presented in terms of value (USD) and volume.
Segmentation Overview
| Fish | Salmon |
| Tuna | |
| Others | |
| Shellfish | Crustaceans |
| Bivalves and Other Molluscs | |
| Other Shellfish and Aquatic Invertebrates | |
| Seaweed and Algae-Based Products | |
| Others |
| Canned |
| Fresh/Chilled |
| Frozen |
| Processed |
| Off-Trade | Supermarkets/Hypermarkets |
| Online Retail Stores | |
| Convenience Stores | |
| Others | |
| On-Trade | Hotels |
| Restaurants | |
| Catering |
| North America | United States |
| Canada | |
| Mexico | |
| Rest of North America | |
| Europe | Germany |
| United Kingdom | |
| Italy | |
| France | |
| Spain | |
| Netherlands | |
| Poland | |
| Belgium | |
| Sweden | |
| Rest of Europe | |
| Asia-Pacific | China |
| India | |
| Japan | |
| Australia | |
| Indonesia | |
| South Korea | |
| Thailand | |
| Singapore | |
| Rest of Asia-Pacific | |
| South America | Brazil |
| Argentina | |
| Colombia | |
| Chile | |
| Peru | |
| Rest of South America | |
| Middle East and Africa | South Africa |
| Saudi Arabia | |
| United Arab Emirates | |
| Nigeria | |
| Egypt | |
| Morocco | |
| Turkey | |
| Rest of Middle East and Africa |
| By Product Type | Fish | Salmon |
| Tuna | ||
| Others | ||
| Shellfish | Crustaceans | |
| Bivalves and Other Molluscs | ||
| Other Shellfish and Aquatic Invertebrates | ||
| Seaweed and Algae-Based Products | ||
| Others | ||
| By Form | Canned | |
| Fresh/Chilled | ||
| Frozen | ||
| Processed | ||
| By Distribution Channel | Off-Trade | Supermarkets/Hypermarkets |
| Online Retail Stores | ||
| Convenience Stores | ||
| Others | ||
| On-Trade | Hotels | |
| Restaurants | ||
| Catering | ||
| By Geography | North America | United States |
| Canada | ||
| Mexico | ||
| Rest of North America | ||
| Europe | Germany | |
| United Kingdom | ||
| Italy | ||
| France | ||
| Spain | ||
| Netherlands | ||
| Poland | ||
| Belgium | ||
| Sweden | ||
| Rest of Europe | ||
| Asia-Pacific | China | |
| India | ||
| Japan | ||
| Australia | ||
| Indonesia | ||
| South Korea | ||
| Thailand | ||
| Singapore | ||
| Rest of Asia-Pacific | ||
| South America | Brazil | |
| Argentina | ||
| Colombia | ||
| Chile | ||
| Peru | ||
| Rest of South America | ||
| Middle East and Africa | South Africa | |
| Saudi Arabia | ||
| United Arab Emirates | ||
| Nigeria | ||
| Egypt | ||
| Morocco | ||
| Turkey | ||
| Rest of Middle East and Africa | ||
Key Questions Answered in the Report
What is the projected growth rate for sustainable seafood through 2032?
The Sustainable seafood market is forecast to grow at a 6.1% CAGR from 2027 to 2032, reaching USD 29.1 billion by 2032.
Which product category has the largest share of sustainable seafood sales?
Fish held 58.2% of value in 2026, supported by demand for established species such as salmon and tuna.
Which seafood format is growing fastest?
Canned seafood is forecast to grow at an 8.1% CAGR through 2032 as brands improve packaging and sourcing communication.
Which region is forecast to grow fastest?
Asia-Pacific is forecast to grow at an 8.5% CAGR through 2032, supported by aquaculture scale and growing certification activity.