
Streaming Consumer Behavior Market Size and Share
Market Overview
| Study Period | 2020 - 2031 |
|---|---|
| Market Size (2026) | USD 2.78 Billion |
| Market Size (2031) | USD 4.81 Billion |
| Growth Rate (2026 - 2031) | 11.59 % |
| Fastest Growing Market | Asia-Pacific |
| Largest Market | North America |
| Market Concentration | Medium |
Major Players *Disclaimer: Major Players sorted in no particular order Image © Mordor Intelligence. Reuse requires attribution under CC BY 4.0. | |
Streaming Consumer Behavior Market Analysis by Mordor Intelligence
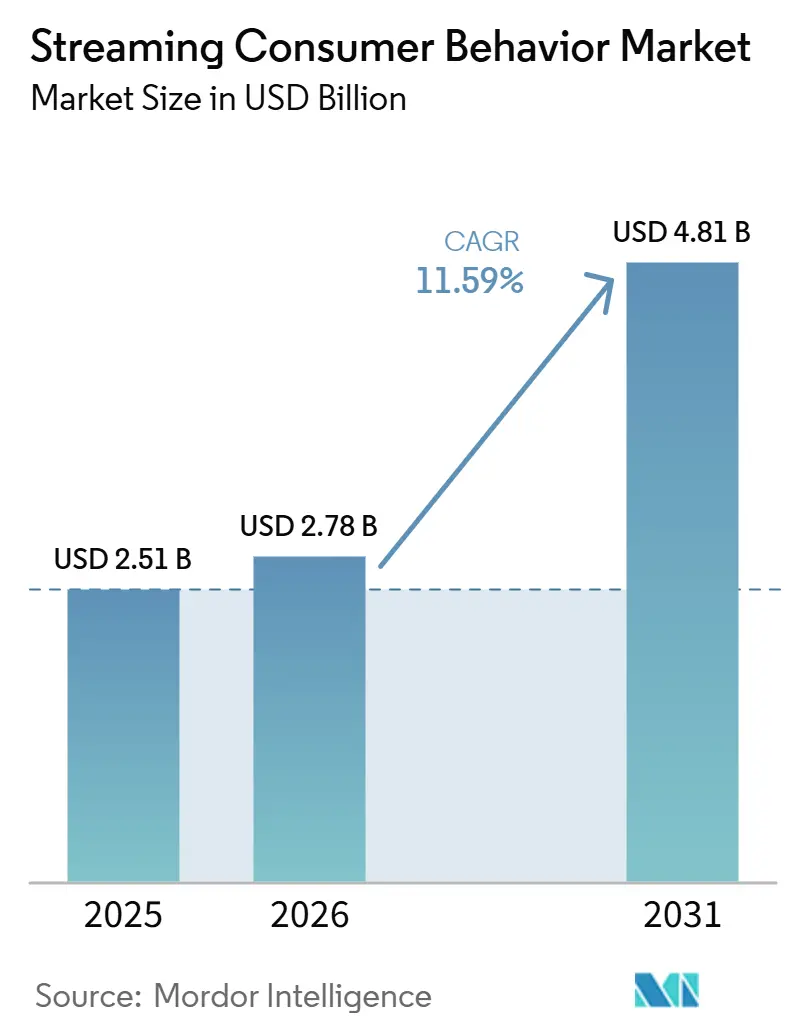
The Streaming Consumer Behavior Market size was valued at USD 2.51 billion in 2025 and is estimated to grow from USD 2.78 billion in 2026 to reach USD 4.81 billion by 2031, at a CAGR of 11.59% during the forecast period (2026-2031). Growth reflects a basic operational problem for streaming businesses. Viewing now occurs across connected TVs, mobile devices, browsers, and bundled services, making it harder to understand who watched, what they watched, and whether advertising changed an outcome. The Streaming Consumer Behavior Market therefore depends on tools that connect audience measurement, subscriber behavior, content demand, and campaign results. Connected TV advertising has made these capabilities more important because advertisers need reliable reach, frequency, and outcome reporting before they shift budgets from linear television. Privacy rules and fragmented platform data limit the reach of independent measurement providers, while also increasing the value of vendors that can manage consent and work with first-party data. Competition is split between specialized measurement firms and large data infrastructure providers, which gives buyers a choice between independent benchmarks and internally managed analytics systems.
Key Report Takeaways
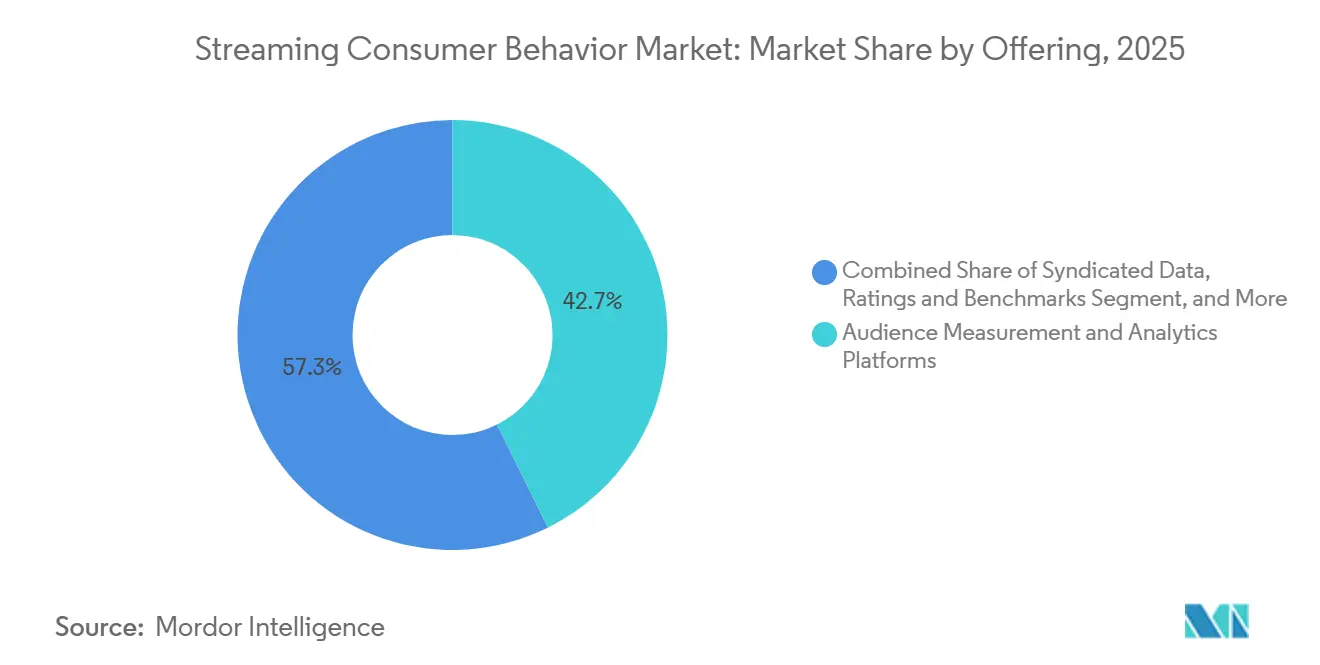
- By offering, Audience Measurement and Analytics Platforms held 42.68% of the Streaming Consumer Behavior Market share in 2025, while Syndicated Data Products, Ratings, and Benchmarks are projected to expand at a 12.42% CAGR through 2031.
- By application, Audience and Cross-Platform Viewing Measurement accounted for 31.24% of the Streaming Consumer Behavior Market share in 2025, while Advertising Audience and Campaign Effectiveness is expected to grow at a CAGR at 12.29% through 2031.
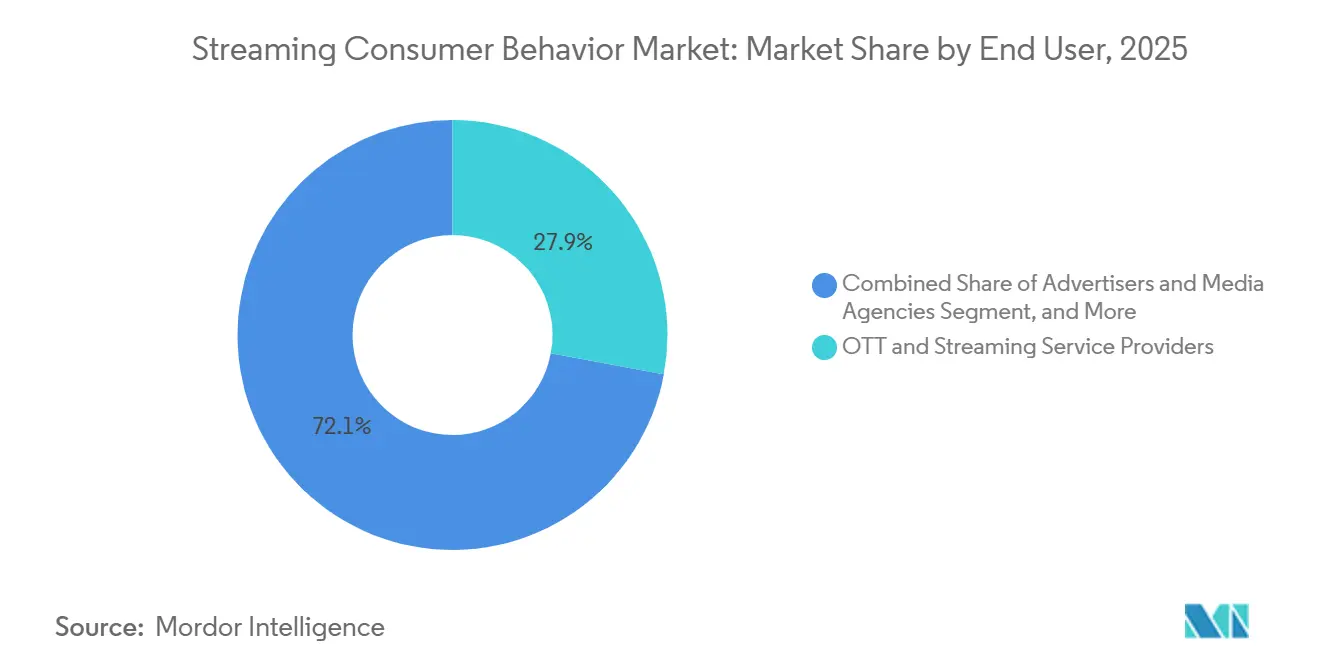
- By end user, OTT and Streaming Service Providers held 27.93% of the Streaming Consumer Behavior Market share in 2025, while Advertisers and Media Agencies are forecast to grow at a 12.37% CAGR through 2031.
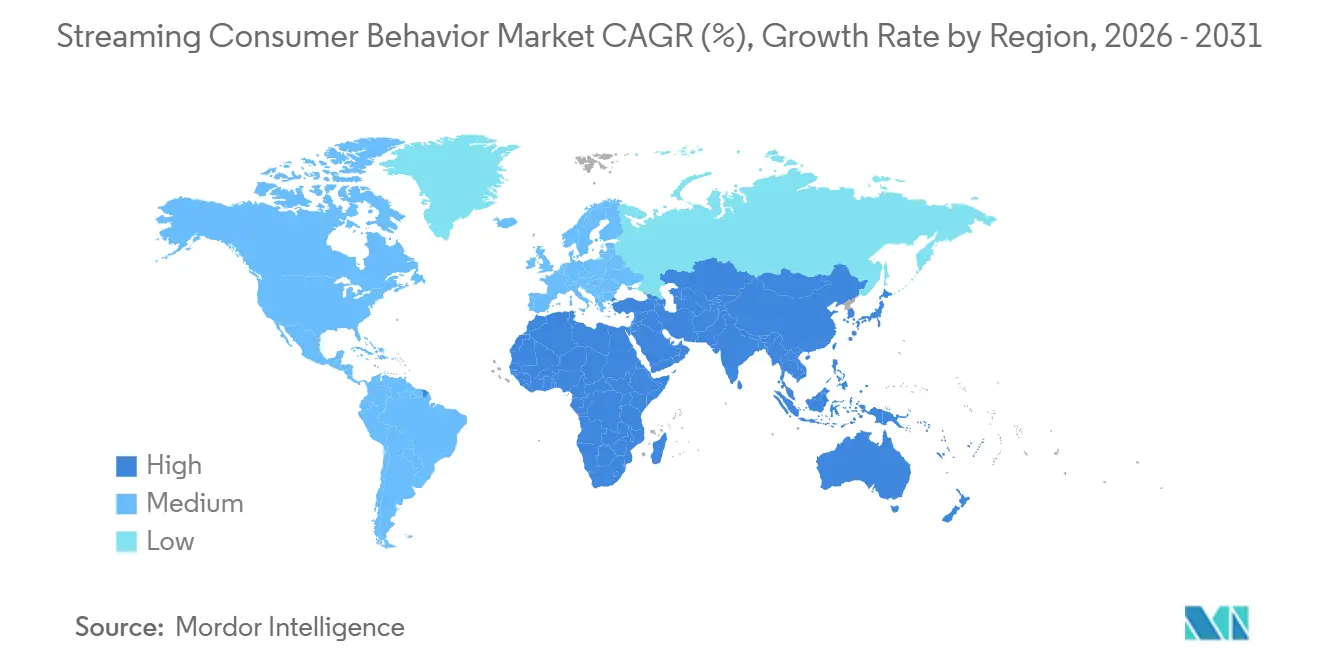
- By geography, North America accounted for 38.41% of revenue in 2025, while the Asia-Pacific is projected to grow at a 12.35% CAGR through 2031.
Note: Market size and forecast figures in this report are generated using Mordor Intelligence’s proprietary estimation framework, updated with the latest available data and insights as of January 2026.
Market Trends and Insights
Drivers Impact Analysis of Streaming Consumer Behavior Market*
| Driver | (~) % Impact on CAGR Forecast | Geographic Relevance | Impact Timeline |
|---|---|---|---|
| Rising Streaming Data Volumes and Measurement Complexity | +3.1% | Global | Short term (≤ 2 years) |
| Intensifying Platform Competition and Churn Economics | +2.4% | North America and Europe | Short term (≤ 2 years) |
| Expansion of Connected TV Advertising and Addressable Monetization | +2.0% | North America and Asia-Pacific | Medium term (2-4 years) |
| AI-Led Personalization and Predictive Audience Intelligence | +1.5% | Global | Medium term (2-4 years) |
| Creator-Led Discovery and Social-to-Streaming Attribution | +0.9% | North America and Asia-Pacific | Short term (≤ 2 years) |
| Smart-TV Automatic Content Recognition Expansion | +0.7% | North America and Europe | Medium term (2-4 years) |
| Source: Mordor Intelligence | |||
Rising Streaming Data Volumes and Measurement Complexity
The Streaming Consumer Behavior Market is supported by data volumes that are larger and less uniform than those used in traditional television measurement. Netflix stated that it processes 2 trillion events each day and ingests 3 petabytes of data in a 24-hour cycle, showing the scale at which personalization and measurement systems must operate. ACR data records activity at the television screen, while server-side logs describe sessions, and panel data relies on sampled households. These sources cannot be combined without clear methods for identity, timing, and duplication. The Joint Industry Committee reviewed Comscore, iSpot, and VideoAmp in its 2025 currency audit, which shows why independent validation matters when buyers and sellers use data for transactions.[1]Joint Industry Committee, “Guidelines for Transactability for the 2025-2026 Season,” Joint Industry Committee, assets.ctfassets.net This need for consistent, timely reconciliation supports demand for analytics platforms that can handle multiple measurement sources simultaneously.
Intensifying Platform Competition and Churn Economics
Platform competition has shifted the Streaming Consumer Behavior Market toward detailed retention analysis rather than broad subscriber reporting. The average U.S. streaming monthly churn rate reached 5.5% by early 2025, up from 2% in 2019, while premium SVOD churn remained at 4.6% throughout 2025. These figures point to a need to identify smaller groups of subscribers with different content preferences, payment behavior, and cancellation risks. Bundles can reduce cancellations for individual services, but they can also make it harder for studios and advertisers to determine which service or title created value. Nielsen introduced its Big Data + Panel approach in September 2025 as the first MRC-accredited national TV measurement service combining large-scale first-party data with panel measurement. The launch shows that measurement providers must update their methods as platform competition creates more complex audience paths.
Expansion of Connected TV Advertising and Addressable Monetization
Connected TV advertising is expanding the commercial use of the Streaming Consumer Behavior Market because buyers need evidence that campaigns reached the intended audience. U.S. CTV advertising spending stands at USD 37.95 billion in 2026, up 14.5% from 2025, and CTV upfront commitments of USD 17.73 billion exceeded primetime linear TV upfronts of USD 16.98 billion. Nearly 70% of CTV advertisers planned to increase spending in 2026 by an average of 17%, while 50% of CTV and OTT inventory was expected to be purchased programmatically. This shift requires measures of incremental reach, frequency, brand lift, and conversion, rather than relying solely on broad reach estimates. Analytics providers with platform-integrated data or ACR-supported signals can help advertisers connect exposure to outcomes while maintaining required data controls. The opportunity is strongest where ad-supported tiers and addressable inventory are already established.
AI-Led Personalization and Predictive Audience Intelligence
AI-led personalization is increasing the range of decisions addressed by the Streaming Consumer Behavior Market. Netflix described its Foundation Model as a way to distribute preference learning across multiple downstream personalization use cases rather than relying on many separate models. This approach can support content recommendations, acquisition decisions, advertising yield decisions, and retention activities using a related set of behavioral signals. Kaltura launched TV Genie in March 2025, featuring real-time viewer mood inference, automatic translation, and content discovery for media and telecommunications clients. Samba TV reported that its models draw on deterministic signals from 1.5 billion opted-in users and more than 907 billion independent monthly data signals. The practical benefit is faster interpretation of large audience datasets, although the results still depend on the quality of consented data and the methods used to validate outputs.
Restraints Impact Analysis of Streaming Consumer Behavior Market*
| Restraint | (~) % Impact on CAGR Forecast | Geographic Relevance | Impact Timeline |
|---|---|---|---|
| Divergent Privacy and Consent Requirements | -2.4% | North America and Europe | Short term (≤ 2 years) |
| Fragmented Measurement Standards and Walled Gardens | -1.8% | Global | Long term (≥ 4 years) |
| Subscription Fatigue and Consumer Value Compression | -1.1% | North America and Europe | Short term (≤ 2 years) |
| Default Tracking Restrictions and Signal Loss at the Device Layer | -0.7% | Global | Medium term (2-4 years) |
| Source: Mordor Intelligence | |||
Divergent Privacy and Consent Requirements
Divergent privacy rules constrain the Streaming Consumer Behavior Market by reducing the consistency of signals that analytics systems can use across regions. The European Data Protection Board finalized Guidelines 2/2023 in October 2024 and extended prior-consent requirements under the ePrivacy Directive to tracking pixels, URL-based tracking, IP-only tracking, and device fingerprinting. These techniques are often used to connect behavior across devices and services. In February 2026, the California Attorney General reached a USD 2.75 million CCPA settlement with The Walt Disney Company and required stronger treatment of opt-out signals across shared advertising systems. The action indicates that consent cannot be treated solely as a front-end notice, as it must carry through to the underlying advertising and data architecture. Regional differences also make it harder to compare panels and first-party datasets that were collected under different consent conditions.
Fragmented Measurement Standards and Walled Gardens
Fragmented standards limit the Streaming Consumer Behavior Market because major services do not always provide independent providers with the data needed for reconciliation. Platform-reported reach can differ from unduplicated cross-platform reach, particularly when the same viewer is counted on several services. The Joint Industry Committee has developed a Streaming Data Service using a federated clean-room approach on Snowflake infrastructure, but complete participation remained unavailable through 2025. Proprietary data can give large platforms control over measurement methods, yet it can also leave advertisers with inconsistent reports across publishers. The resulting gap creates a role for neutral providers, but it raises the cost and complexity of proving that their outputs are comparable. Delays and disputes over methodology show that common measurement standards will take time to establish.
*Our forecasts treat driver/restraint impacts as directional, not additive. The impact forecasts reflect baseline growth, mix effects, and variable interactions.
Streaming Consumer Behavior Market Segment Analysis
By Offering:
Measurement Platforms Lead While Syndicated Data ExpandsAudience Measurement and Analytics Platforms held 42.68% of the Streaming Consumer Behavior Market share in 2025. The segment leads because real-time audience intelligence supports programming, advertising planning, retention work, and inventory decisions within the same operational environment. Large streaming services need tools that can process viewing activity across devices and translate it into decisions that business teams can act on. Measurement platforms also provide the underlying data layer for reach calculations, cross-platform deduplication, and subscriber behavior models. Nielsen’s Big Data + Panel methodology became the first MRC-accredited national TV measurement service to combine large-scale first-party data with panel measurement in September 2025. Its accreditation illustrates why methodological review can be a significant barrier for newer providers. Buyers need confidence that data remains usable when it informs advertising transactions or content investment decisions. The segment is therefore anchored by the value of repeatable, validated measurement rather than data collection alone.
Syndicated Data, Ratings, and Benchmarks are projected to grow at a 12.42% CAGR through 2031, exceeding the growth of the leading offering category. The segment serves regional broadcasters and mid-sized streaming services that may not be able to build a complete proprietary measurement system. These buyers use external benchmarks to support content licensing discussions, advertising pricing, and audience-scale reporting. Parrot Analytics illustrates the category by measuring demand for titles across platforms and markets. Syndicated products can offer a common reference point when individual platform datasets cannot be shared or compared directly. The Streaming Consumer Behavior Market size for this segment is supported by the need for independent evidence in commercial negotiations, rather than by a single platform’s internal needs. Custom Research, Advisory, and Managed Analytics Services addresses a separate need for rights valuation, geographic entry planning, and detailed subscriber segmentation. This service category remains relevant when standard reports cannot reflect a buyer’s specific content portfolio or market conditions.



By Application:
Cross-Platform Measurement Leads, Campaign Analytics Grows FastestAudience and Cross-Platform Viewing Measurement held 31.24% of the Streaming Consumer Behavior Market share in 2025. It remains the foundation for understanding where audiences move between linear television, connected TV, mobile video, and subscription platforms. Content owners use these results to assess programming performance, while advertisers use them to control duplication across buys. The need is heightened when households subscribe to several services and viewing is split across different screens. A consistent cross-platform view can improve media planning, but it requires access to data that is often held by separate platforms. The Streaming Consumer Behavior Market continues to rely on this application because no other category can replace the basic task of identifying unduplicated audience exposure. It also provides inputs for content acquisition, scheduling, and frequency management. Its large share reflects the recurring nature of these measurement tasks across both advertising and subscription use cases.
Advertising Audience and Campaign Effectiveness is expected to expand at a 12.29% CAGR through 2031. The segment benefits from the shift in advertising budgets toward CTV and the replacement of gross rating point measures with conversion, lift, and incrementality metrics. Innovid introduced NIVO AI in 2026 and stated that it could improve the speed of CTV campaign launches by up to 90%. Faster campaign setup can be valuable, but buyers still need credible post-campaign measurement.[2]Innovid, “Innovid Introduces NIVO AI with Agents Driving 90% Improvement in Speed to Campaign Launch,” IAB SEA and India, iabseaindia.com Content Discovery, Preference, and Demand Intelligence serves studios and platforms deciding which titles to acquire or promote. The IAB’s 2025 creator economy report identified advanced attribution and consistent reporting as leading requirements, reinforcing the need to connect social discovery with first-party subscription data. Subscriber Acquisition, Retention, and Churn Analytics serves teams that need to understand cancellation risks and payment friction. These applications address different buyers, but each depends on reliable behavioral data and careful handling of privacy permissions.
By End User:
OTT Providers Lead While Advertisers and Agencies AccelerateOTT and Streaming Service Providers commanded 27.93% of the Streaming Consumer Behavior Market share in 2025. This group has broad analytics needs because it must manage acquisition, retention, content demand, advertising inventory, and cross-device viewing simultaneously. Services with both subscription and advertising revenue face a more complex challenge, as they must balance lifetime value, ad yield, content scheduling, and customer experience. Their internal teams also need timely evidence when deciding which titles to renew, how to price advertising, and when to intervene with at-risk subscribers. Comscore reported that total hours watched across major FAST services increased 43% year over year in 2025. This growth in ad-supported viewing adds to the number of consumption patterns that providers must measure. The Streaming Consumer Behavior Market is, therefore, closely tied to the operational demands of OTT platforms. Their leading share reflects both the number of use cases and the direct link between audience intelligence and platform revenue decisions.
Advertisers and media agencies are forecast to grow at a 12.37% CAGR through 2031. This group needs independent audience verification, brand lift measurement, and reach analysis as more campaign spending moves toward connected TV. Advertisers must often compare results from publishers that use different reporting systems, which strengthens the need for third-party tools and common standards. TelevisaUnivision entered a multi-year agreement with Nielsen in April 2026 that covers streaming, national TV, local TV, and radio in one media intelligence suite. The agreement shows how media organizations are seeking consolidated analytics as audiences fragment across formats. Broadcasters, Studios and Content Owners have related needs around rights valuation and content performance. Telecommunications Providers can use behavioral analytics to understand service engagement, while Smart-TV OEMs can use ACR data within applicable consent rules. Together, these end users extend demand beyond the streaming services that remain the largest buyer group.
Geography Analysis
The Americas Streaming Consumer Behavior Market
North America held 38.41% of the Streaming Consumer Behavior Market share in 2025. The region has a large installed base of connected TVs, ad-supported streaming tiers, and certified audience measurement providers. Its advanced advertising market makes it a leading location for tools that analyze reach, frequency, and campaign results. U.S. enforcement activity also makes privacy architecture a central procurement requirement. The California Attorney General’s February 2026 settlement with The Walt Disney Company showed that opt-out preferences must work across shared advertising infrastructure. This raises the importance of vendors that can manage consent at the system level. South America is an emerging area for structured audience measurement as streaming audiences and ad-supported services expand. The region’s potential hinges on better reporting across broadcasters, platforms, and advertisers.
Europe Streaming Consumer Behavior Market
Europe is shaped by the relationship between global platform scale and strict privacy requirements. U.S. streaming platforms held 75% of European online video viewing in a February 2026 analysis by the Digital Production Partnership and Mediavision. This concentration can limit the negotiating position of local broadcasters and restrict the development of independent local measurement currencies. SVOD use is already widespread in Western Europe, where many households hold several subscriptions. That pattern makes retention analytics and advertising attribution more relevant than simple subscriber acquisition reporting. RTL Ad Alliance found that 80% of respondents across 17 markets used streaming services at least monthly, while 68% used them at least weekly in 2026.[3] RTL Ad Alliance, “Living Room 2026 Whitepaper,” RTL Ad Alliance, rtl-adalliance.com GDPR and the EDPB guidance also constrain the data techniques available for cross-platform identity work.
APAC and MEA Streaming Consumer Behavior Market
Asia-Pacific is projected to grow at the fastest regional CAGR of 12.35% through 2031. India’s rising SVOD subscriptions and Southeast Asia’s mobile-first use of ad-supported streaming are driving demand for audience analytics designed for smaller screens and shared devices. The Asia Video Industry Association stated that India is projected to pass China as the largest SVOD subscription market by 2030. Japan and India are expected to be the largest contributors to incremental premium video revenue in the region. Mobile viewing creates a measurement challenge because methods designed around fixed television sets do not capture every viewing context. The Middle East is attracting more measurement investment as global platforms and regional operators expand their streaming services. Africa remains at an earlier stage, with South Africa providing the most established base for basic audience analytics infrastructure.

Competitive Landscape
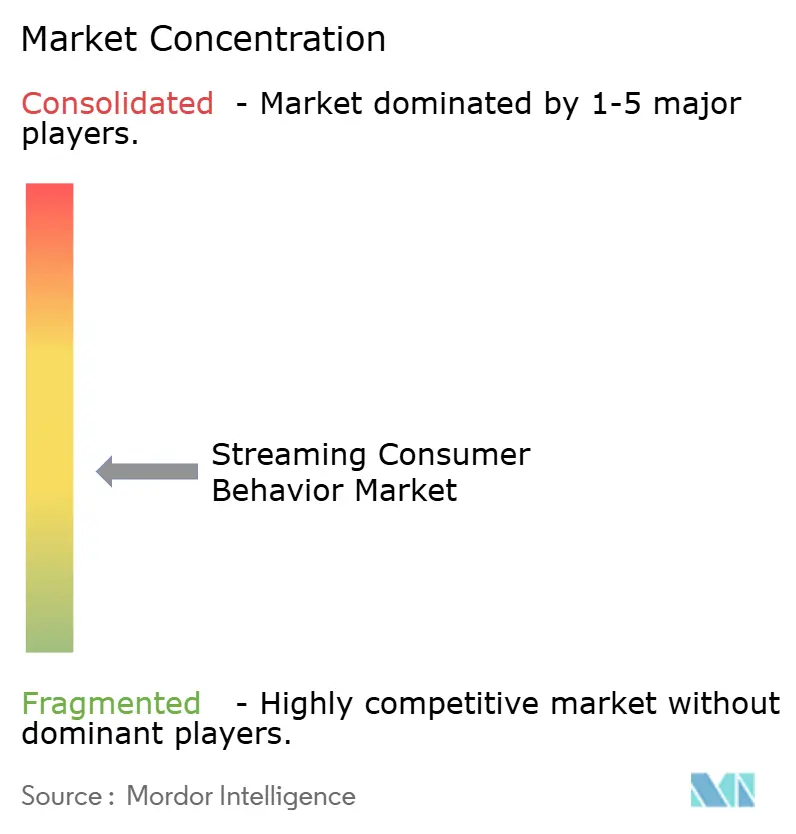
The Streaming Consumer Behavior Market is moderately fragmented and operates through 2 competitive layers. The first layer includes specialized measurement and analytics firms such as Nielsen, Comscore, Samba TV, and iSpot.TV, Parrot Analytics, Conviva, and Kantar Media. These companies compete through certification, panel scale, data coverage, and their ability to connect viewing across platforms. Comscore received MRC accreditation for demographic TV metrics across all 210 U.S. local markets in April 2025. This accreditation can matter to buyers who need comparable local-market measurement. The second layer includes AWS, Microsoft, Oracle, Salesforce, Snowflake, and Databricks. These providers compete by supplying the data infrastructure that clients use to run internal analytics systems. Their role can reduce reliance on external tools, but many buyers still need independent benchmarks for media transactions and campaign verification.
Strategic activity in 2025 and 2026 focused on expanding data capability and improving identity resolution. Samba TV acquired Bestever AI in June 2026 to advance its agentic AI advertising strategy. The deal moves the company beyond data collection toward tools that leverage audience signals for planning and campaign work. Samba TV also launched Project Gravity in May 2026 as an independent data activation platform connected with more than 40 advertising platforms.[4]Samba TV, “Samba TV Launches Project Gravity, an Independent Data Activation Platform for the Agentic Era,” Samba TV, globenewswire.com The platform is designed to support privacy-compliant signal activation without owning advertising inventory. Nielsen’s September 2025 Big Data + Panel launch represented a separate strategic move toward combining first-party data with panel-based measurement. These moves show that providers are seeking both broader data inputs and more usable outputs.
The competitive structure favors firms that can demonstrate methodological reliability while adapting to changing data rules. Independent measurement companies must secure cooperation from platforms, maintain accreditation, and show that their results are comparable across environments. Infrastructure providers have scale and deep technical resources, but they do not automatically offer neutral measurement accepted by all buyers and sellers. This leaves room for specialized firms that can provide verification without controlling media inventory. Mergers can add new capabilities, although they may also prompt questions about measurement neutrality. Platform-neutral identity systems are becoming important because buyers want to use data across several publishers without relying on any single walled garden. The Streaming Consumer Behavior Market will continue to reward companies that combine clear methods, trusted data handling, and practical reporting for commercial users. The number of established specialists and infrastructure firms suggests active competition rather than control by a small group of suppliers.
Streaming Consumer Behavior Industry Leaders
Nielsen Holdings plc
Comscore, Inc.
Kantar Media Audiences Limited
Samba TV, Inc.
iSpot.tv, Inc.
- *Disclaimer: Major Players sorted in no particular order
Streaming Consumer Behavior Market Companies Covered in this Report
- Nielsen Holdings plc
- Comscore, Inc.
- Kantar Media Audiences Limited
- Samba TV, Inc.
- iSpot.tv, Inc.
- TVision Insights, Inc.
- Parrot Analytics Limited
- Conviva, Inc.
- Google LLC
- Adobe Inc.
- Microsoft Corporation
- Amazon Web Services, Inc.
- Oracle Corporation
- Salesforce, Inc.
- Snowflake Inc.
- Databricks, Inc.
- Roku, Inc.
- Innovid Corp.
- Brightcove Inc.
- Kaltura, Inc.
- Amagi Media Labs Pvt. Ltd.

Recent Industry Developments in Streaming Consumer Behavior Market
- July 2026: Kaltura's platform delivered live TV streaming for the 2026 FIFA World Cup, supporting approximately 40 million registered devices across 6 production environments in Europe, Asia, and the Middle East, the company also previewed Agentic Avatar capabilities for live sports, real-time, conversational AI guidance embedded into TV and streaming interfaces.
- June 2026: Samba TV acquired Bestever AI, a GenAI advertising platform backed by Andreessen Horowitz (a16z), with the founding team joining to lead Samba's agentic AI product strategy, accelerating autonomous brand-audience research and real-time campaign analytics.
- May 2026: Amagi launched its In-Content Ads Marketplace through the ADS PLUS platform, enabling programmatic in-content advertising formats beyond traditional ad pods across hundreds of FAST channels with launch partners including Plex, TCL, and Telus.
- April 2026: Nielsen and TelevisaUnivision signed a new multi-year measurement and data agreement covering all TelevisaUnivision properties, national and local broadcast, cable, streaming, and radio, under a unified suite including Nielsen ONE Ads for Connected Television.


Global Streaming Consumer Behavior Market Report Scope
The Streaming Consumer Behavior Market studies how consumers discover, access, consume, and engage with streaming content across video, audio, gaming, and live-streaming platforms. The scope of the study covers key behavioral patterns, subscription preferences, viewing and listening habits, device usage, content preferences, platform engagement, churn factors, and the impact of pricing, personalization, and advertising on consumer decisions.
The Streaming Consumer Behavior Market Report is Segmented by Offering (Audience Measurement and Analytics Platforms, Syndicated Data, Ratings, and Benchmarks, and Custom Research, Advisory, and Managed Analytics Services), Application (Audience and Cross-Platform Viewing Measurement, Content Discovery, Preference, and Demand Intelligence, Subscriber Acquisition, Retention, and Churn Analytics, and Advertising Audience and Campaign Effectiveness), End User (OTT and Streaming Service Providers, Broadcasters, Television Networks, and Media Groups, Advertisers and Media Agencies, Studios, Content Owners, and Sports Rights Holders, Telecommunication, Pay-TV, and Internet Service Providers, and Smart-TV OEMs, Connected-Device Platforms, and Digital Distribution Platforms), and Geography (North America, South America, Europe, Asia-Pacific, Middle East, and Africa). The Market Forecasts are Provided in Terms of Value (USD).
| Audience Measurement and Analytics Platforms |
| Syndicated Data, Ratings and Benchmarks |
| Custom Research, Advisory, and Managed Analytics Services |
| Audience and Cross-Platform Viewing Measurement |
| Content Discovery, Preference, and Demand Intelligence |
| Subscriber Acquisition, Retention, and Churn Analytics |
| Advertising Audience and Campaign Effectiveness |
| OTT and Streaming Service Providers |
| Broadcasters, Television Networks, and Media Groups |
| Advertisers and Media Agencies |
| Studios, Content Owners, and Sports Rights Holders |
| Telecommunication, Pay-TV, and Internet Service Providers |
| Smart-TV OEMs, Connected-Device Platforms, and Digital Distribution Platforms |
| North America | United States |
| Canada | |
| Mexico | |
| South America | Brazil |
| Argentina | |
| Chile | |
| Rest of South America | |
| Europe | Germany |
| United Kingdom | |
| France | |
| Italy | |
| Spain | |
| Rest of Europe | |
| Asia-Pacific | China |
| Japan | |
| India | |
| South Korea | |
| Australia | |
| Rest of Asia-Pacific | |
| Middle East | Saudi Arabia |
| United Arab Emirates | |
| Qatar | |
| Rest of Middle East | |
| Africa | South Africa |
| Egypt | |
| Nigeria | |
| Rest of Africa |
| By Offering | Audience Measurement and Analytics Platforms | |
| Syndicated Data, Ratings and Benchmarks | ||
| Custom Research, Advisory, and Managed Analytics Services | ||
| By Application | Audience and Cross-Platform Viewing Measurement | |
| Content Discovery, Preference, and Demand Intelligence | ||
| Subscriber Acquisition, Retention, and Churn Analytics | ||
| Advertising Audience and Campaign Effectiveness | ||
| By End User | OTT and Streaming Service Providers | |
| Broadcasters, Television Networks, and Media Groups | ||
| Advertisers and Media Agencies | ||
| Studios, Content Owners, and Sports Rights Holders | ||
| Telecommunication, Pay-TV, and Internet Service Providers | ||
| Smart-TV OEMs, Connected-Device Platforms, and Digital Distribution Platforms | ||
| By Geography | North America | United States |
| Canada | ||
| Mexico | ||
| South America | Brazil | |
| Argentina | ||
| Chile | ||
| Rest of South America | ||
| Europe | Germany | |
| United Kingdom | ||
| France | ||
| Italy | ||
| Spain | ||
| Rest of Europe | ||
| Asia-Pacific | China | |
| Japan | ||
| India | ||
| South Korea | ||
| Australia | ||
| Rest of Asia-Pacific | ||
| Middle East | Saudi Arabia | |
| United Arab Emirates | ||
| Qatar | ||
| Rest of Middle East | ||
| Africa | South Africa | |
| Egypt | ||
| Nigeria | ||
| Rest of Africa | ||


Key Questions Answered in the Report
What is the size of the Streaming Consumer Behavior Market?
The Streaming Consumer Behavior Market was valued at USD 2.51 billion in 2025 and is estimated at USD 2.78 billion in 2026. It is projected to reach USD 4.81 billion by 2031 at an 11.59% CAGR.
What is driving demand for streaming consumer behavior analytics?
Connected TV advertising, multi-device viewing, subscriber retention needs, and AI-enabled personalization are increasing the need for reliable audience and behavior data.
Which offering category held the largest share in 2025?
Audience Measurement and Analytics Platforms led with 42.68% share in 2025 because streaming businesses use them across programming, advertising, and retention decisions.
Which application is growing fastest through 2031?
Advertising Audience and Campaign Effectiveness is expected to grow at a 12.29% CAGR as advertisers require stronger attribution and campaign outcome reporting for connected TV.
Which end-user group is expected to grow fastest?
Advertisers and Media Agencies is projected to expand at a 12.37% CAGR through 2031 as CTV spending raises demand for audience verification and reach analysis.
Page last updated on:





