
Spectacle Lens Market Size and Share
Market Overview
| Study Period | 2020 - 2031 |
|---|---|
| Market Size (2026) | USD 63.1 Billion |
| Market Size (2031) | USD 78.03 Billion |
| Growth Rate (2026 - 2031) | 4.34 % |
| Fastest Growing Market | Asia Pacific |
| Largest Market | Europe |
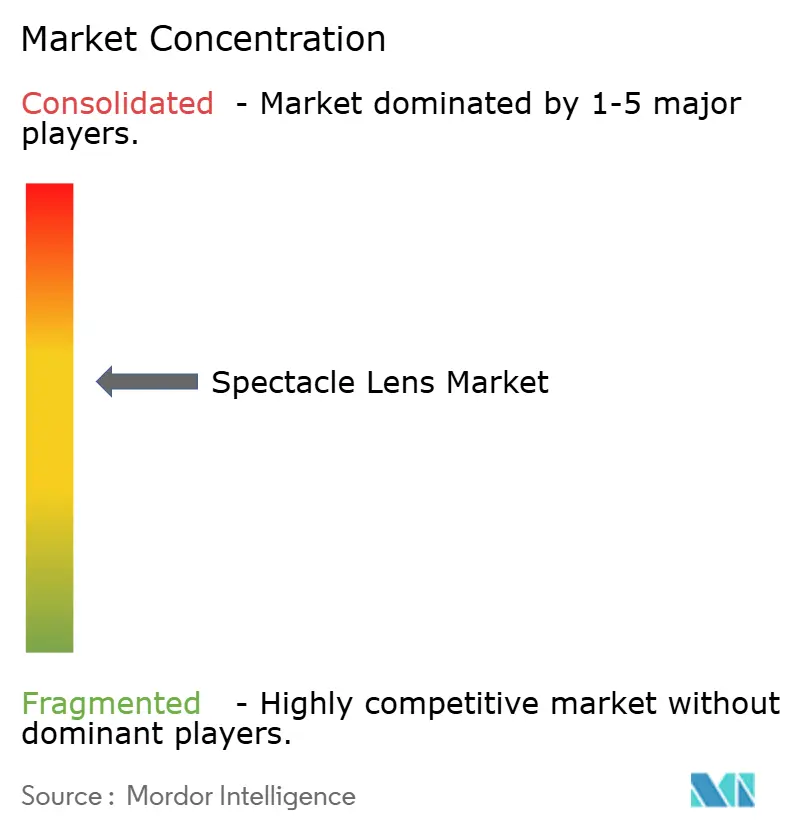
| Market Concentration | Medium |
Major Players *Disclaimer: Major Players sorted in no particular order Image © Mordor Intelligence. Reuse requires attribution under CC BY 4.0. | |
Spectacle Lens Market Analysis by Mordor Intelligence
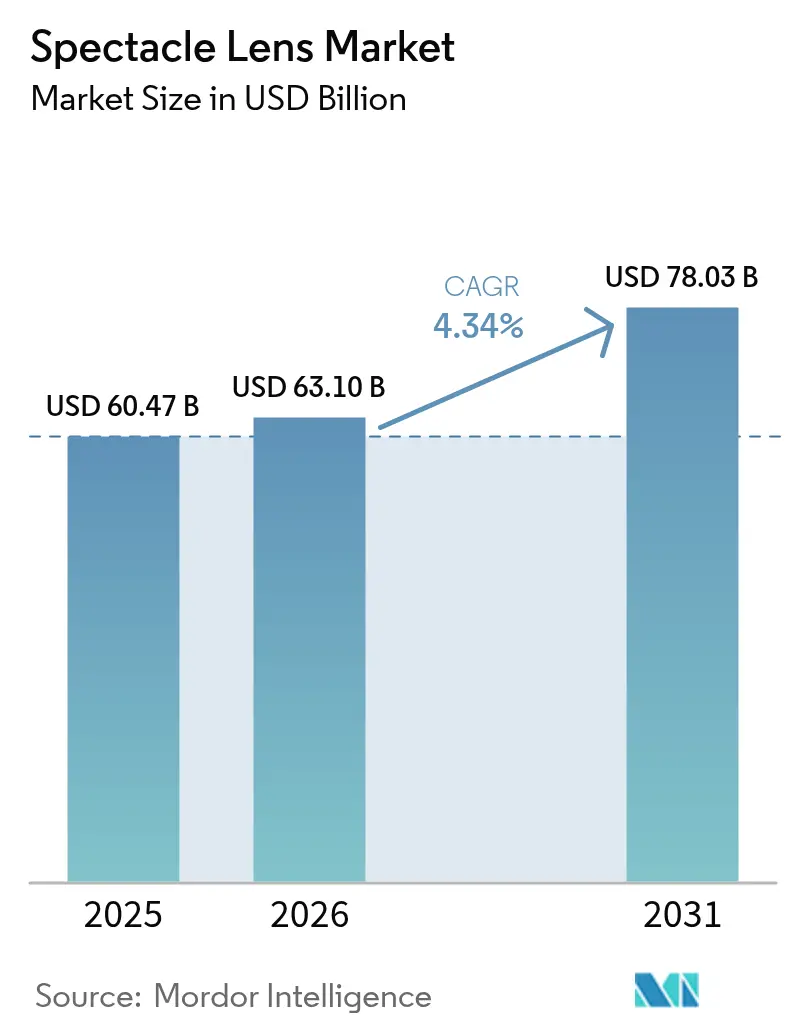
The spectacle lens market size is expected to grow from USD 60.47 billion in 2025 to USD 63.1 billion in 2026 and is forecast to reach USD 78.03 billion by 2031 at 4.34% CAGR over 2026-2031. This expansion is fueled by demographic aging that raises presbyopia prevalence, urban lifestyles that intensify digital-screen exposure, and a sustained upsurge in myopia cases across East and South-East Asia. Competitive differentiation centers on premium progressive technologies, AI-guided free-form surfacing, and multi-function coatings that merge clarity with ocular protection. Material innovation—especially in high-index plastics—and supply-chain investments by leading monomer suppliers are mitigating raw-material volatility while creating sustainability advantages. Consolidation among vertically integrated players, omnichannel retail strategies, and enterprise procurement programs further reinforce the spectacle lens market’s growth momentum.
Key Report Takeaways
- By lens type, single vision lenses held the largest 41.56% revenue share in 2025; progressive lenses are forecast to register the quickest 4.72% CAGR through 2031.
- By material, CR-39 resin dominated with 63.02% revenue share in 2025; high-index plastic (≥1.60) is expected to outpace other materials, although a precise CAGR has not been disclosed in the available data.
- By coating type, anti-reflective layers commanded 68.10% of 2025 revenue; UV-blocking coatings are projected to expand at the highest 4.92% CAGR to 2031.
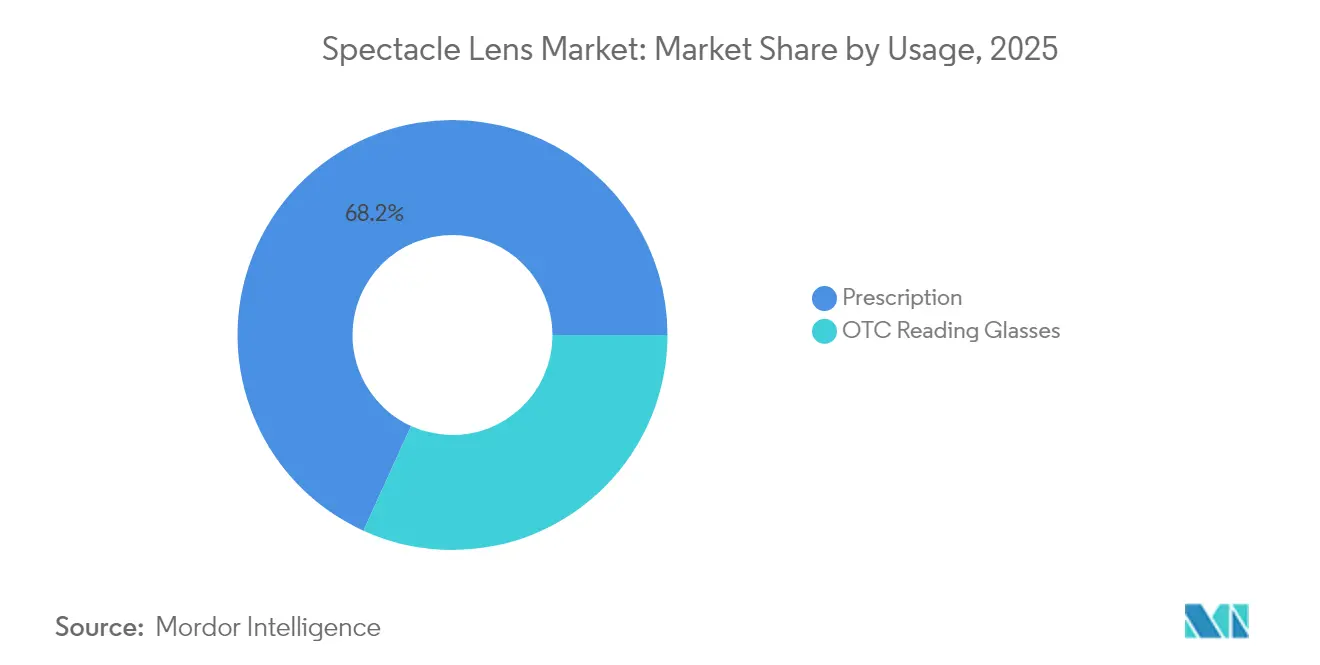
- By usage, prescription glasses accounted for 68.20% share in 2025 and are advancing at a 4.95% CAGR through 2031, making the segment both the largest and fastest growing within its category.
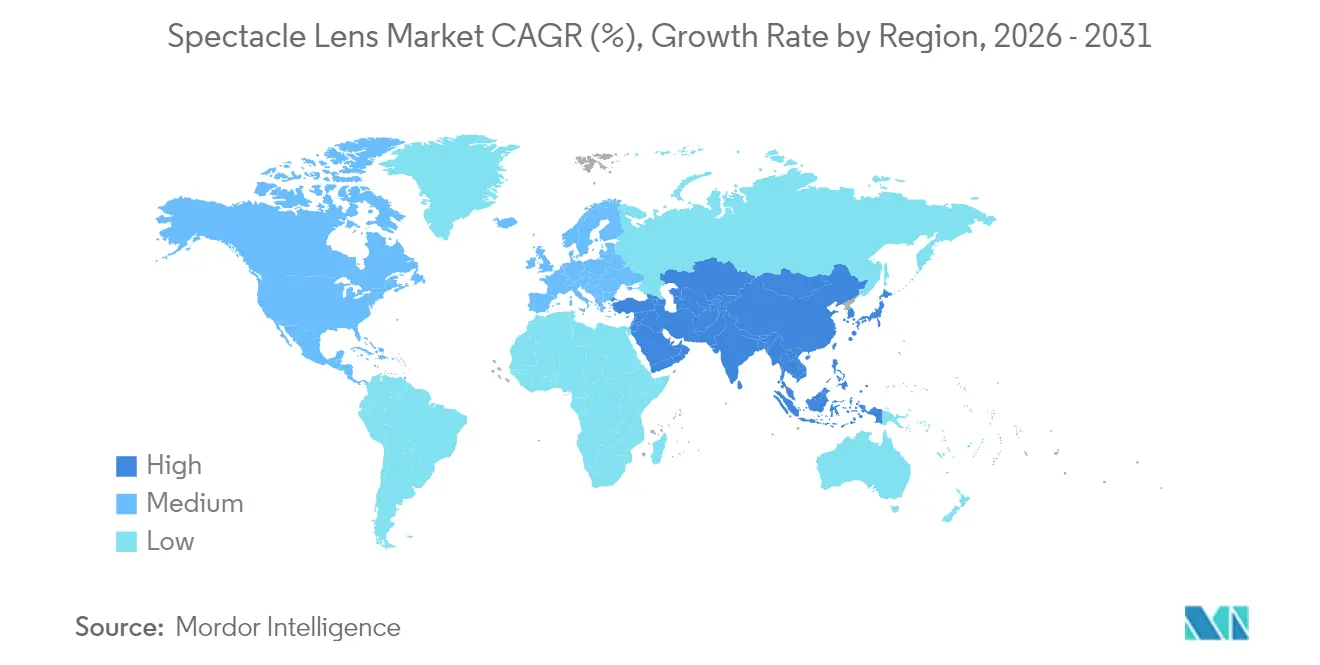
- By geography, North America led with 47.61% spectacle lens market share in 2025; Asia-Pacific is poised to deliver the strongest 5.05% regional CAGR through 2031.
Note: Market size and forecast figures in this report are generated using Mordor Intelligence’s proprietary estimation framework, updated with the latest available data and insights as of 2026.
Global Spectacle Lens Market Trends and Insights
Drivers Impact Analysis*
| Driver | (~) % Impact on CAGR Forecast | Geographic Relevance | Impact Timeline |
|---|---|---|---|
| Aging population & presbyopia prevalence | +1.2% | North America, Europe, China | Long term (≥ 4 years) |
| Rising digital-screen exposure | +0.8% | Urban APAC, global metros | Medium term (2-4 years) |
| Growing myopia prevalence | +0.9% | East & South-East Asia | Long term (≥ 4 years) |
| Premiumization in urban China & India | +0.6% | Tier-1 cities China/India | Medium term (2-4 years) |
| AI-enabled personalized surfacing | +0.4% | North America, EU | Short term (≤ 2 years) |
| Enterprise blue-light programs | +0.3% | Global corporates | Short term (≤ 2 years) |
| Source: Mordor Intelligence | |||


Aging Population & Presbyopia Prevalence
Global demographic shifts are materially increasing demand for presbyopia correction. China recorded 296.97 million citizens aged 60 and above in 2023, catalyzing uptake of premium progressive and trifocal designs. EuroEyes International’s 21% annual growth in trifocal surgeries from 2020–2024 underscores the commercial pull toward multifocal solutions. The FDA’s July 2025 approval of VIZZ eye drops introduces pharmaceutical competition but also heightens consumer awareness of presbyopia treatments. As non-surgical and surgical alternatives coexist, lens makers are leveraging lifestyle-oriented marketing that emphasizes seamless near-intermediate-distance vision. These trends collectively sustain long-term demand for complex lens geometries and reinforce the spectacle lens market’s resilience to refractive surgery uptake.
Rising Digital-Screen Exposure Among Gen-Z & Millennials
Average daily screen time now exceeds nine hours for urban Gen-Z cohorts, intensifying blue-light exposure and digital eye strain. The pandemic-driven shift to hybrid work further cemented near-work habits, accelerating myopic progression. ZEISS BlueGuard blocks 40% of hazardous blue wavelengths while halving digital reflections compared with legacy coatings. Zenni Optical’s Blokz+ Tints extend filtration to 92%, illustrating escalating functional expectations. Enterprises incorporate blue-light filters into wellness budgets, opening a high-volume B2B avenue with favorable margins. Collectively, heightened screen exposure is broadening the spectacle lens market beyond traditional refraction correction into preventive ocular health solutions.
Growing Prevalence of Myopia in Asia-Pacific
China’s 80% myopia prevalence among secondary students and projections that 50% of the global population will be myopic by 2050 present a formidable public-health and economic burden. Myopia-control spectacle designs employing defocusing and peripheral-vision modulation now complement orthokeratology and pharmacological approaches. Government policies encouraging outdoor activity and educational reforms highlight official recognition of the crisis. Yet eyeglass uptake remains below 25% among affected students, revealing substantial unmet need. For manufacturers, myopia control represents both a social obligation and a lucrative growth niche within the spectacle lens market.
Disposable-Income-Led Premiumization in Urban China & India
Rising affluence across Asia’s megacities is pivoting consumer preference toward high-index materials, anti-reflection surfaces, and bespoke progressive geometries. Enhanced visual aesthetics, comfort, and digital ergonomics are becoming key purchasing criteria. Expanding optical chains and digital-first retail models facilitate access to advanced offerings—illustrated by Warby Parker’s 13.3% revenue growth and 40-store expansion during 2024. This premiumization dynamic allows suppliers to defend margins and differentiate through design innovation and service experience, reinforcing the spectacle lens market’s long-term value trajectory.
Restraints Impact Analysis*
| Restraint | (~) % Impact on CAGR Forecast | Geographic Relevance | Impact Timeline |
|---|---|---|---|
| Shift toward contact lenses & refractive surgery | -0.7% | Developed markets | Medium term (2-4 years) |
| High price sensitivity in emerging economies | -0.5% | APAC, LatAm, Africa | Long term (≥ 4 years) |
| Counterfeit & low-quality lenses online | -0.3% | Emerging markets | Short term (≤ 2 years) |
| Volatile high-index monomer prices | -0.4% | Global | Short term (≤ 2 years) |
| Source: Mordor Intelligence | |||
Shift Toward Contact Lenses & Refractive Surgery
The U.S. contact-lens segment is projected to top USD 6 billion in 2025, reflecting consumer appetite for aesthetics and convenience. Orthokeratology is expanding at double-digit rates, offering overnight corneal reshaping appealing to active youth segments. Surgical alternatives such as AI-guided LASIK and SILK deliver permanent correction with shrinking recovery times. While these modalities capture share from low-to-mid prescription wearers, premium spectacle lenses maintain relevance among presbyopes, pediatric myopia cases, and users with contraindications for surgery. The restraint thus skews toward market segmentation rather than wholesale substitution, moderating—but not derailing—spectacle lens market growth.
High Price Sensitivity in Emerging Economies
Cost remains the principal adoption barrier in lower-income regions where consumers often settle for basic correction or forego eyewear entirely. Currency volatility exacerbates affordability gaps, especially for premium high-index or coated products. Local manufacturers’ low-price offerings intensify competition. Yet urbanization and expanding vision-care insurance schemes steadily improve purchasing power and distribution reach. For multinationals, balancing cost-down engineering with brand-appropriate quality is imperative to unlock volume potential across these sizable, young demographics.
*Our forecasts treat driver/restraint impacts as directional, not additive. The impact forecasts reflect baseline growth, mix effects, and variable interactions.
Segment Analysis
By Lens Type: Progressive Lenses Propel Value Creation
Progressive designs are the spectacle lens market’s primary value driver. Their 4.72% CAGR through 2031 exceeds all other categories, underpinned by global presbyopia growth and continuous design refinement. Nikon’s SeeMax Ultimate exemplifies personalization by factoring prescription, posture, and habitual reading distance into a unique free-form surface. Seiko’s Brilliance integrates TwinEye 360° modulation to enhance binocular balance. Single-vision lenses, though mature, retain the largest unit volume owing to widespread myopia correction needs. Myopia-control spectacles, incorporating defocus segments or peripheral power rings, represent a fast-emerging specialty, particularly across Chinese primary-school populations. The spectacle lens industry embeds AI analytics into progressive fitting protocols, bolstering practitioner confidence and patient satisfaction.
Unit economics differ markedly across the lens spectrum. Progressive and myopia-control lenses carry gross margins 2-4 times higher than basic single-vision products, incentivizing retailers to upsell. As technologies such as wavefront optimization migrate downward into mid-tier pricing, adoption spreads to cost-sensitive markets, propelling overall spectacle lens market penetration.



By Material: High-Index Momentum Accelerates
CR-39 retains 63.02% volume leadership given its optical clarity and low cost. Polycarbonate remains indispensable in pediatric and safety eyewear, meeting impact-resistance mandates. High-index plastics ≥ 1.60 offer thin, lightweight profiles that improve aesthetics for high prescriptions. Mitsubishi Gas Chemical’s IURESIN 1.74 monomer capacity expansion directly responds to robust demand for ultra-high refractive index options. Bio-based Episleaf introduces a sustainability narrative resonating with environmentally conscious consumers.
Material choice is increasingly aligned with fashion-driven rimless frames and larger lens diameters, where edge thickness compromises appearance. While high-index resin costs are 2-3 times higher than CR-39, willingness-to-pay rises in tandem with disposable incomes and premium retail positioning. Supply-chain resilience initiatives—multi-sourcing critical monomers, investing in regional polymerization plants—help cushion price swings and secure availability, stabilizing margins in the spectacle lens market.
By Coating Type: Multi-Functionality Takes Center Stage
Anti-reflective layers hold 68.10% share, a testament to their baseline utility in improving contrast and aesthetics. Blue-light-filter coatings, recording a 4.88% CAGR, piggyback on both consumer wellness narratives and corporate procurement programs. Hoya’s Hi-Vision Meiryo delivers 56% lower reflectance and 2.5× scratch resistance versus category benchmarks. Rodenstock’s Solitaire LayR minimizes distracting green residuals, replacing them with subtler blue reflections. Hydrophobic and anti-fog nanolayers cater to outdoor workers and mask wearers, increasing relevance post-pandemic.
The trend is toward stacked coatings that merge reflection control, scratch hardening, UV filtration, and blue-light attenuation in a single stack. This multifunction integration raises average selling price yet simplifies consumer choice, fortifying the spectacle lens market’s premium tier. Regulatory adherence to Vision Council and ISO scratch tests preserves product credibility.
By Usage: Prescription Glasses Remain Core
Prescription eyewear captured 68.20% of the spectacle lens market size in 2025, supported by mandatory eye-examination protocols and insurance coverage in mature economies. Growth remains robust at 4.95% CAGR through 2031 due to aging populations and under-penetration in emerging markets. Over-the-counter readers fulfill basic near-vision needs but lack the customized power progression and prismatic corrections increasingly demanded by knowledge-worker cohorts. Warby Parker’s digital-first, store-enabled model illustrates how modern retail can straddle convenience and professional service, drawing incremental users into the prescription funnel.
Hybrid order pathways—remote prescription renewal apps, virtual try-on augmented reality, and rapid polycarbonate edging robots—drive frictionless consumer journeys. These technologies cement spectacles as the primary personalized vision-correction modality despite contact-lens and surgical alternatives.
By Distribution Channel: Omnichannel Integration Deepens
Brick-and-mortar opticals anchor the spectacle lens market via on-site refraction, PD measurement, and immediate frame trial. Company-owned chains like LensCrafters ensure brand homogeneity and capture full margin. E-commerce platforms extend reach, especially for replacement lenses and frame refresh purchases. Virtual fitting accuracy now approaches in-store precision, and courier networks deliver prescription eyewear within 72 hours in many urban centers. Eye-care clinics and hospital dispensing counters dominate complex prescription fulfillment and progressive fitting in developing markets where retail optometry remains nascent.
Successful brands synchronize inventory, pricing, and loyalty programs across online and offline touchpoints. For instance, consumers can start with a virtual frame selection, finish measurements in store, and obtain post-sale customer support via chatbots, creating a seamless loop that elevates overall satisfaction and lifetime value.
Geography Analysis
North America, with 47.61% spectacle lens market share in 2025, benefits from mature insurance systems, strong progressive uptake, and early adoption of AI-driven surfacing tools. Corporate wellness subsidies amplify blue-light-lens volumes, while continuous aging of the baby-boom demographic safeguards baseline demand. The United States exhibits robust premiumization, with high-index purchases outpacing low-gain single-vision units. Canada’s public health integration sustains routine eye-examinations, whereas Mexico’s rising middle class unlocks mid-tier growth potential. Expansion remains steady at a 5.04% regional CAGR, propelled more by product mix enhancements than unit growth.
Asia-Pacific is the fastest-growing hub, mirroring demographic tidal forces—both rising myopia among youngsters and burgeoning presbyopia among seniors. China’s urban retirees pursue trifocal replacements and digital-ready progressives, while India’s megacities embrace high-index aesthetics. Japan leads in AI-fabrication expertise, selling export licenses to neighboring lens labs. Southeast Asian markets, still under-penetrated, absorb affordable CR-39 progressives bundled with photochromic coatings. Regional supply-chain localization, including new monomer plants by Mitsui Chemicals, secures availability of advanced materials, buttressing the spectacle lens market’s 5.05% CAGR.
Europe remains a sophisticated but slower-growing region in absolute volume terms. Stringent CE and ISO standards underpin consumer trust and foster innovation such as electro-active lens prototypes developed through Zeiss-Mitsui IP agreements. Aging populations in Germany, Italy, and Spain bolster progressive uptake. Environmental regulations spur adoption of bio-derived polymers and solvent-free coatings. Economic uncertainties post-Brexit and variable reimbursement ceilings challenge pricing strategies, yet the market’s affinity for quality and sustainability keeps premium lenses in demand.

Regulatory Landscape
Spectacle lenses fall under medical-device and product-safety frameworks that differ by jurisdiction, which affects labeling, traceability, and quality controls. In the United States, prescription spectacle lenses are regulated as Class I medical devices and are generally exempt from 510(k), but they still need to meet FDA impact-resistance requirements under 21 CFR 801.410, along with related manufacturer and initial distributor registration and quality-system expectations.
In Europe, oversight is guided by the EU Medical Device Regulation (MDR) 2017/745 and the ongoing UDI build-out: Commission Delegated Regulation (EU) 2025/1920 introduced a Master UDI-DI assignment approach for spectacle lenses to limit Eudamed data proliferation, with application from 1 November 2028. The Medical Device Coordination Group (MDCG) added implementation detail through guidance updates (including a Rev.1 update issued in March 2026), while conformity for finished lenses is commonly supported against ISO 8980-series requirements (including ISO 8980-1 and ISO 8980-2, and ISO 8980-3:2022 for transmittance). Australia also uses a distinct pathway, with prescription spectacle lenses exempt from inclusion in the ARTG as of 15 June 2024.
Value Chain Analysis
The spectacle lens value chain runs from upstream chemical inputs to patient-facing dispensing. Upstream activities include monomer and resin synthesis (including high-index MR-type materials), additive and coating chemistries, and blank production. Midstream, lens makers carry out casting or injection, free-form surfacing and edging, and multi-layer coating (anti-reflective, scratch-resistant, UV, and blue-light stacks), then complete inspection and packaging aligned with applicable ISO and FDA requirements. Downstream channels include wholesalers and independent labs, vertically integrated brand-owned lab networks, optical retail chains, and eye-care clinics or hospital dispensaries, alongside e-commerce models that combine remote ordering with local fitting and verification.
Manufacturing scale remains concentrated in Asia. China accounts for the majority of global spectacle lens and frame output by volume, while critical specialty inputs are tied to suppliers in Japan and China. Vertical integration is prominent, with large players controlling multiple steps from materials and processing to retail storefronts, which supports margin capture and faster execution of premium progressives and coated products. The chain is also exposed to resin price volatility, cross-border logistics disruptions, and compliance-driven process requirements, pushing investment toward automation, multi-sourcing of key inputs, and regional lab footprints closer to end markets.
Competitive Landscape
EssilorLuxottica dominates through end-to-end control ranging from monomer synthesis to retail storefronts. The 2025 agreement to purchase Optegra’s 70-hospital network illustrates a med-tech pivot that blurs lines between device, diagnostic, and service. Hoya and Zeiss invest heavily in wavefront and electro-active R&D, aiming to leapfrog with next-generation adaptive optics. Nikon and Rodenstock focus on bespoke progressive algorithms, courting high-net-worth urbanites.
Smaller challengers exploit niche positions—myopia-control lens startups forge academic alliances, while D2C disruptors harness data-driven personalization and reduced overhead to compete on value. Patent fortification and ISO-compliant quality systems remain entry barriers. Meanwhile, supply-side consolidation in high-index monomer production by Mitsui Chemicals and Mitsubishi Gas Chemical shapes cost structures for the entire spectacle lens market.
Spectacle Lens Industry Leaders
Carl Zeiss AG (Carl Zeiss Meditec AG)
EssilorLuxottica (Essilor)
Hoya Corporation (Seiko Optical Products Co., Ltd.)
Nikon Corporation
Rodenstock GmbH
- *Disclaimer: Major Players sorted in no particular order

Market Opportunities and Future Outlook
Myopia management is emerging as a high-evidence commercialization lane for spectacle lenses, supported by clinical readouts and category specialization in pediatric eye care. In May 2026, Hoya Vision Care highlighted 12-month clinical results for MiYOSMART iQ at ARVO 2026, reporting halted progression in 9 out of 10 children. That outcome reinforces practitioner confidence and creates room in protocols that combine refraction correction with myopia-control optics. The clinical momentum aligns with the report scope emphasis on myopia prevalence in Asia-Pacific, supporting premium lens mix expansion beyond conventional single-vision replacement cycles.
Manufacturing and supply resilience is also an opportunity as retailers and labs invest in localized capacity, automation, and shorter lead times for personalized surfacing and coating stacks. In May 2026, Specsavers began a GBP 7 million expansion of its Vision Labs site in Kidderminster, targeting a 22% increase in weekly lens output (from 139,000 to 169,000 units) through more automated production. Optimax Eyewear Group also reported a 50% capacity increase at its Atlanta facility in March 2026. Separately, the EU move to a Master UDI-DI construct under Delegated Regulation (EU) 2025/1920, mandatory from 1 November 2028, establishes a clearer compliance workstream for individualized lens configurations, encouraging earlier investment in serialization-ready data systems and label management that can be carried into omnichannel fulfillment models.
Recent Industry Developments
- June 2026: EssilorLuxottica signed a long-term joint development agreement with Applied Materials to advance AR optics and intelligent lens platforms. The collaboration combines optical know-how with materials and manufacturing technology, supporting roadmap work that bridges premium ophthalmic lenses and smart eyewear components.
- July 2025: The FDA cleared VIZZ (aceclidine 1.44%) eye drops as a drug therapy for presbyopia. The approval introduces a non-lens alternative for near-vision correction, leading lens makers and retailers to sharpen value propositions around progressive performance, coatings, and wear-all-day convenience.
- May 2024: Warby Parker expanded its physical retail footprint by adding stores alongside its digital-first model. The continued store buildout strengthens exam-to-dispense pathways and supports higher conversion for prescription lenses, which remains the largest usage segment in the market.


Research Methodology Framework and Report Scope
Market Definition and Coverage
For this study, the spectacle lens market covers the value of ophthalmic lenses used in eyeglasses, including prescription and ready-made reading lenses, across retail and professional dispensing channels.
Scope exclusions: We exclude frames, complete eyewear bundles priced as a set, contact lenses, and surgical or clinical vision correction services.
Segmentation Overview
- By Lens Type
- Single Vision
- Bifocal
- Trifocal
- Progressive
- Myopia-Control
- By Material
- CR-39 (Resin)
- Polycarbonate
- High-Index Plastic (≥1.60)
- Glass
- By Coating Type
- Anti-Reflective
- Scratch-Resistant
- UV-Blocking
- Blue-Light-Filtering
- Anti-Fog / Hydrophobic
- By Usage
- Prescription Glasses
- OTC Reading Glasses
- By Distribution Channel
- Offline Optical Retail
- Company-Owned Stores
- E-commerce Platforms
- Eye-Care Clinics & Hospitals
- By Geography
- North America
- United States
- Canada
- Mexico
- Europe
- Germany
- United Kingdom
- France
- Italy
- Spain
- Rest of Europe
- Asia-Pacific
- China
- India
- Japan
- South Korea
- Australia
- Rest of Asia-Pacific
- South America
- Brazil
- Argentina
- Rest of South America
- Middle East and Africa
- GCC
- South Africa
- Rest of Middle East and Africa
- North America
Data Sources, Market Sizing, and Validation
Desk Research
Desk work starts by building a fact base on vision needs and eyewear usage, then mapping how that demand converts into lens shipments and average selling prices. Public sources such as the World Health Organization, the US CDC (vision health statistics), the OECD health data portal, and national health ministries are used to anchor trends like myopia, presbyopia, and eye exam frequency. We also review trade statistics and customs portals in key countries to sense-check lens and lens blank movements (by material codes where available), followed by optical association releases that indicate changes in channel mix.
To keep the model anchored in real operating decisions, we review company annual reports, investor presentations, and reputable press for capacity additions, lab network expansion, and price repositioning in premium coatings. Patent databases are scanned to understand adoption direction for coatings and myopia-control designs, which helps when assumptions need a logic check. Where public reporting is thin, we rely on a paid subscription for company financials and intelligence to keep revenue context consistent at the parent-company level. The sources listed here are illustrative only, and many other public and paid references were used for data collection, validation, and clarification.
Primary Interviews and Surveys
Primary work is used to turn desk signals into practical inputs, including typical lens replacement cycles, mix splits between single vision and progressive designs, and how coating attachment rates differ by channel. We speak with lens manufacturers, optical labs, distributors, and dispensing outlets across major geographies so the pricing ladders and volume assumptions reflect what is actually sold, not only what is advertised.
Distribution of primary research fieldwork respondents
| Company type | Respondent position | Region |
|---|---|---|
| Top tier: 27% | CXOs: 12% | APAC: 38% |
| Mid tier: 56% | Functional/Unit leaders: 38% | EMEA: 37% |
| Smaller Players: 17% | Managers: 50% | Americas: 25% |
Market-Sizing & Forecasting
Sizing is built using top-down demand reconstruction, where vision-impaired and presbyopic population pools are translated into corrected users, then converted into annual lens demand through replacement cycles and exam cadence. The totals are corroborated using selective bottom-up approximations, including sampled price points by lens index and coating, channel checks on pair volumes, and sanity checks against supplier and lab throughput discussions.
A few inputs drive most of the model output, including the share of adults using prescription eyewear, progressive lens penetration within presbyopia correction, the mix shift toward high-index materials, coating attachment rates (anti-reflective, scratch resistant, UV, blue-light), and average selling price movement by region after currency normalization. When data is missing for smaller countries, we interpolate using comparable markets with similar income levels, optical retail density, and age structure, then re-check those outputs with interview feedback.
For forecasting, scenario analysis is used so the base case growth links to practical drivers that respondents can validate, including myopia progression in younger cohorts, aging-driven presbyopia, and premiumization in coatings and lens designs. This is supported by short series smoothing on historical demand indicators, with assumptions adjusted when channel feedback indicates a step-change in pricing or utilization.
Data Validation & Update Cycle
Model outputs are checked against independent signals, including macro health indicators, trade flow direction, and observable channel shifts in premium lens uptake. Variances are reviewed in a stepwise manner, where outliers are traced back to a small set of drivers such as replacement rate, lens mix, or pricing, then corrected only when the supporting evidence is consistent.
Before sign-off, the work is reviewed internally with a second analyst pass focusing on arithmetic integrity, unit consistency, and the logic linking drivers to totals. Reports are refreshed annually, and interim updates are made when material events occur, such as pricing resets, regulatory changes affecting optical retail, or major capacity additions. Right before delivery, a final review is completed so clients receive the most current view available.
Mordor Intelligence's Spectacle Lens Market Size Versus Other Published Estimates
Published market values for spectacle lenses can differ even when the topic sounds identical, because each publisher chooses its own counting point, currency timing, and what is treated as a lens sale versus an adjacent product or service. Differences also appear when one study emphasizes retail value at the consumer level and another leans closer to manufacturer pricing.
Some external estimates lean on factory-gate lens values or include broader lens-related services bundled with the product. In Mordor Intelligence, the market is counted as the value of spectacle lenses sold for eyeglasses, and frames, contact lenses, and surgical vision correction are kept out so the total stays tied to lens demand drivers like replacement cycles and coating attachment rates.
Benchmark comparison
| Source | Market Size | Gaps in Research Methodology |
|---|---|---|
| Mordor Intelligence | USD 60.47 B (2025) | |
| Global Research Publisher A | USD 62.02 B (2025) | Often presented closer to factory-gate values and may blend lens-linked services sold with the product, which can lift totals versus a strict lens-only retail value view. |
| Analytics Firm B | USD 63.35 B (2024) | Uses a different base year and growth setup, and can reflect a wider premiumization assumption on coatings and index mix, which shifts the average price level used in the build. |
Taken together, the spread is mainly explained by the price point selected (consumer value versus factory-gate) and small but important scope choices around what is counted as a lens sale. By keeping the inputs traceable to a defined corrected-user pool, lens mix, and realistic pricing ladders, the estimate stays repeatable and easier to reconcile with real-world channel signals.


Key Questions Answered in the Report
How large is the spectacle lens market in 2026?
The spectacle lens market size stands at USD 63.1 billion in 2026, with a forecast value of USD 78.03 billion by 2031 at a 4.34% CAGR.
Which region contributes the highest revenue?
North America leads, accounting for 47.61% of global revenue in 2025 on the back of mature insurance coverage and premium lens adoption.
What is the fastest-growing lens type?
Progressive lenses are expanding at a 4.72% CAGR thanks to rising presbyopia prevalence and AI-aided personalization.
Why are blue-light-filter coatings gaining traction?
Longer screen exposure among Gen-Z and hybrid-work professionals has spurred corporate wellness programs, boosting demand for lenses that reduce digital eye strain.
How does AI influence product development?
AI platforms analyze wearer data to create hyper-personalized free-form surfaces, shorten design cycles, and improve first-fit success rates for progressives.
Are high-index materials worth the premium?
High-index plastics provide thinner, lighter lenses for strong prescriptions, enhancing aesthetics and comfort; expanding capacity in Japan and Europe is making them more accessible.
Page last updated on:


 Your data is secure and never sold or shared.


