
Market Overview
| Study Period | 2021 - 2031 |
|---|---|
| Forecast Data Period | 2026 - 2031 |
| Base Year Market Size (2025) | 9.32 gigawatt |
| Market Volume (2026) | 10.37 gigawatt |
| Market Volume (2031) | 15.42 gigawatt |
| Growth Rate (2026 - 2031) | 8.26 % |
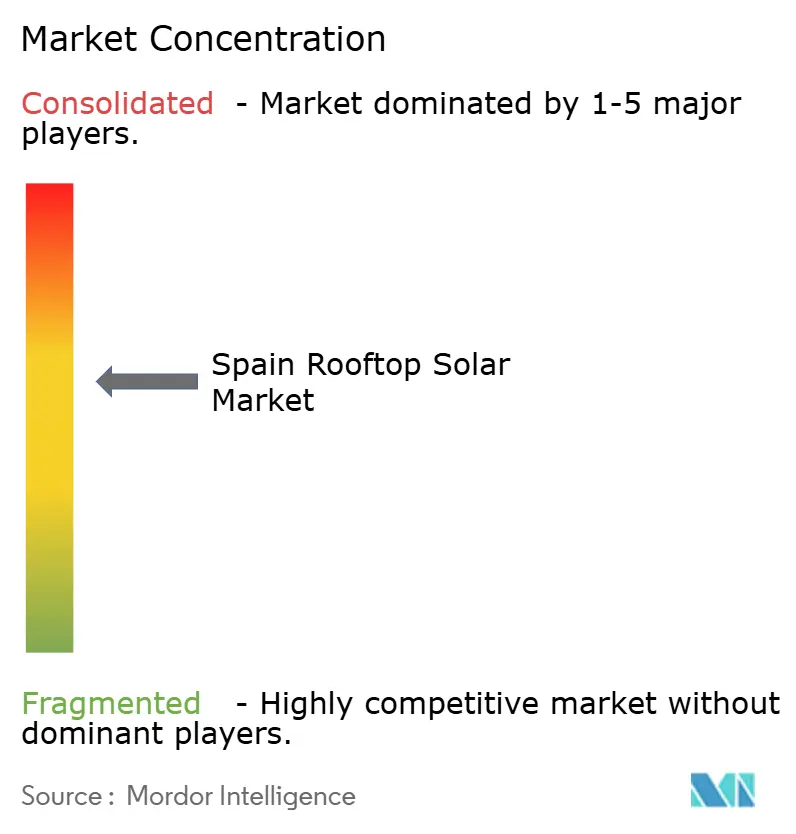
| Market Concentration | Medium |
Major Players *Disclaimer: Major Players sorted in no particular order Image © Mordor Intelligence. Reuse requires attribution under CC BY 4.0. | |
Spain Rooftop Solar Market Analysis by Mordor Intelligence
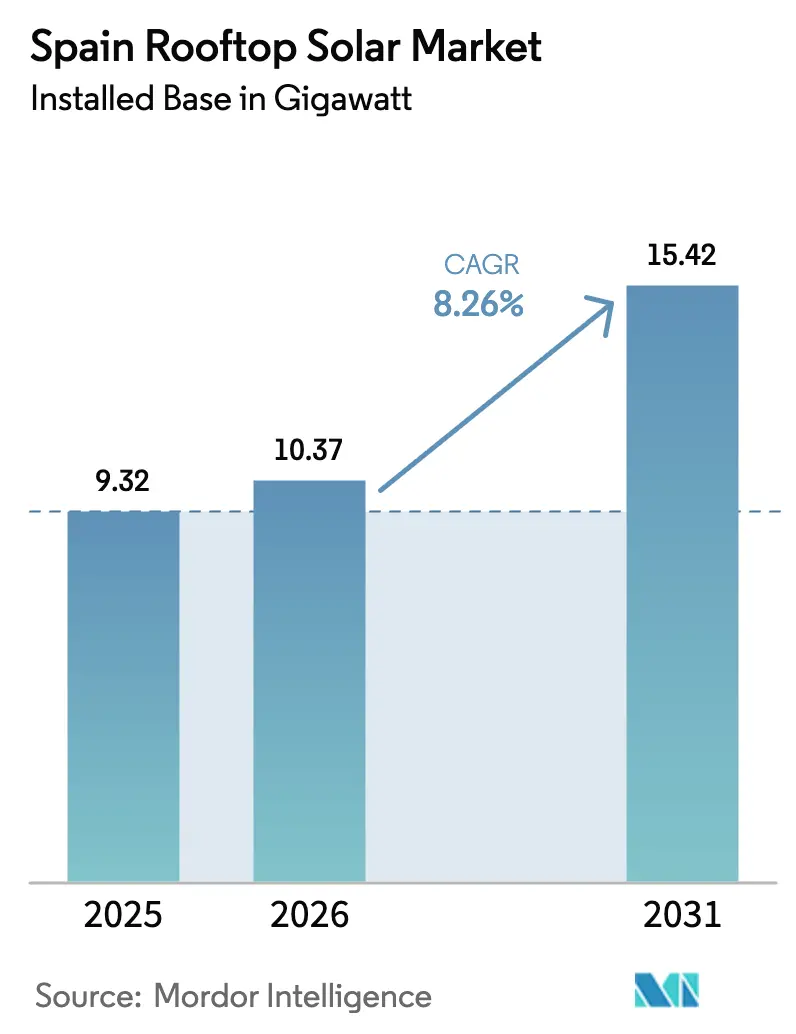
The Spain Rooftop Solar Market size in terms of installed base is projected to be 9.32 gigawatt in 2025, 10.37 gigawatt in 2026, and reach 15.42 gigawatt by 2031, growing at a CAGR of 8.26% from 2026 to 2031.
Industrial and commercial facilities drive this momentum as corporate buyers lock in self-generated power to curb exposure to wholesale-price swings and to satisfy Scope 2 decarbonization targets. Falling module prices, streamlined net-metering rules, and fresh European Green Deal grants have shifted rooftop photovoltaics from a climate gesture to a boardroom strategy. Spain’s 2024 milestone, solar becoming the country’s single-largest power source at 32,043 MW, validates the maturity and resilience of the Spain solar rooftop market. Yet grid-access bottlenecks, municipal red tape, and structural constraints on aging roofs temper the otherwise upbeat trajectory for stakeholders across the Spain solar rooftop market.
Key Report Takeaways
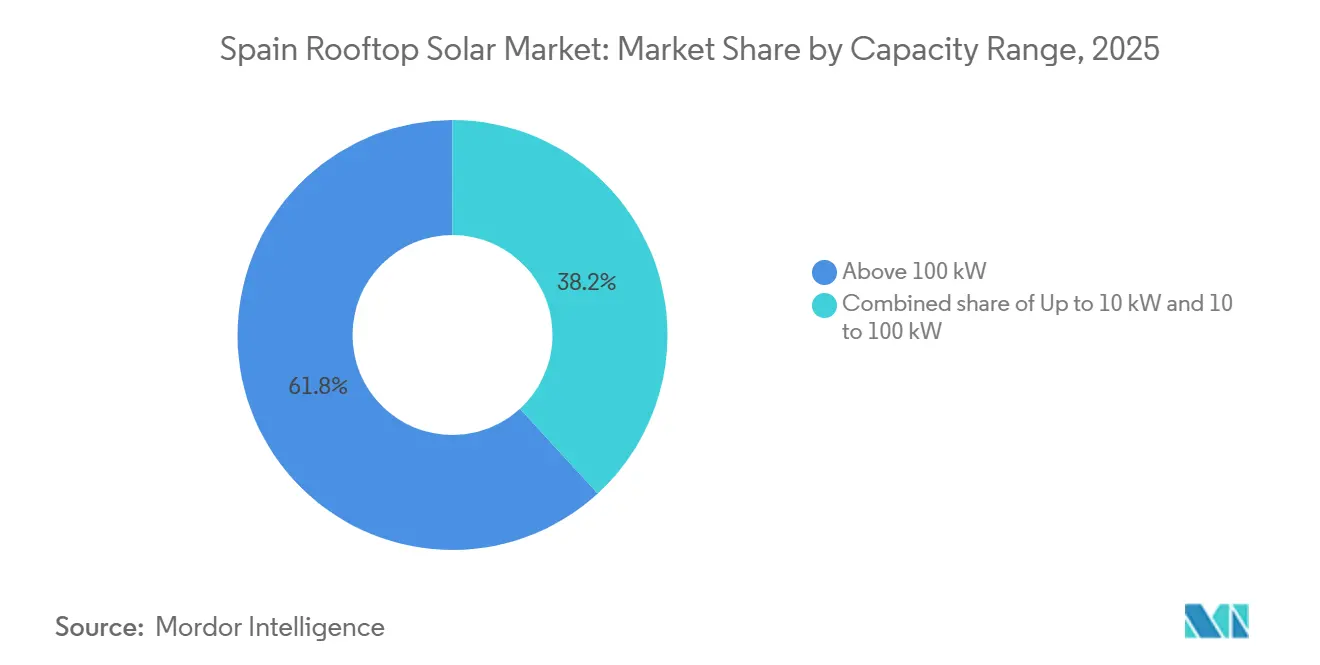
- By capacity range, installations above 100 kW captured 61.8% of Spain's solar rooftop market share in 2025 and are forecast to rise at an 11.1% CAGR through 2031.
- By installation type, retrofit systems commanded 83.5% of the Spanish solar rooftop market size in 2025, while new-build integration is tracking a 10.2% CAGR over the same horizon.
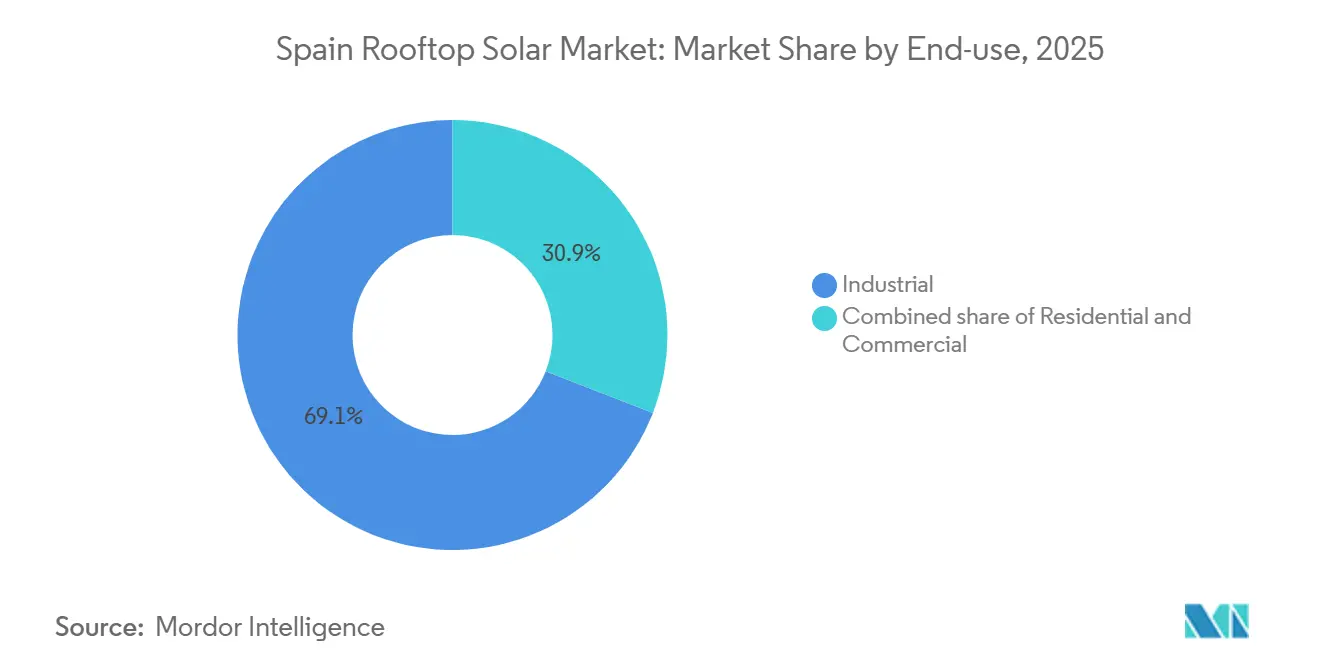
- By end-use, industrial sites accounted for 69.1% of cumulative capacity in 2025 and are projected to expand at a 10.4% CAGR to 2031.
Note: Market size and forecast figures in this report are generated using Mordor Intelligence’s proprietary estimation framework, updated with the latest available data and insights as of January 2026.
Spain Rooftop Solar Market Trends and Insights
Drivers Impact Analysis*
| Driver | (~) % Impact on CAGR Forecast | Geographic Relevance | Impact Timeline |
|---|---|---|---|
| Net-metering expansion & surplus compensation scheme | +2.1% | National, with early gains in Catalonia, Madrid, Andalusia | Medium term (2-4 years) |
| Declining module & BOS costs | +1.8% | Global impact, amplified in price-sensitive Spanish regions | Short term (≤ 2 years) |
| Corporate sustainability & PPAs proliferation | +1.5% | National, concentrated in industrial hubs like Basque Country, Valencia | Medium term (2-4 years) |
| EU Green Deal funds allocation | +1.2% | National, with priority regions receiving enhanced support | Long term (≥ 4 years) |
| Grid-interactive smart-inverter mandate | +0.9% | National rollout, starting with major metropolitan areas | Medium term (2-4 years) |
| Rising self-consumption cooperatives | +0.7% | Regional clusters in Catalonia, Valencia, Balearic Islands | Long term (≥ 4 years) |
| Source: Mordor Intelligence | |||
Net-metering expansion & surplus compensation scheme
Royal Decree 244/2019 eliminated the “sun tax,” allowing prosumers to credit excess power at retail rates, a windfall for multi-megawatt industrial arrays that routinely over-generate on weekends. The law also green-lights collective self-consumption within 2,000 m, enabling factory clusters to pool rooftops and share one grid interconnection. Industrial taxpayers turbo-charge returns through accelerated depreciation, lifting internal rates of return even before energy savings kick in.[1]Endesa, “IRPF Deduction for Solar Panels 2025,” endesa.com These mechanisms helped self-consumption capacity overtake nuclear in 2023, with 7,154 MW online versus 7,117 MW for reactors, most of it sitting on factory roofs.
Declining module & BOS costs
Panel prices slid 17% in 2023, and large orders for 600-W modules now clear customs for as little as USD 0.17/W. Commercial-grade inverters and aluminum racking fell in tandem, pulling the levelized cost of industrial rooftop electricity down to USD 0.044/kWh, on par with ground-mount projects.[2]International Renewable Energy Agency, “Solar PV Cost Reduction 2024,” irena.org Spain’s inverter plants, rated at 82.1 GW per year, shield supply chains from freight shocks and let EPC firms lock in fixed-price contracts despite global volatility. A EUR 750 million (USD 825 million) manufacturing grant further anchors component sourcing at home.
Corporate sustainability & PPAs proliferation
Iberdrola signed more than 900 MW of PPAs in 2023 alone, many tagged specifically to on-roof arrays for multinational tenants that aim to decarbonize without occupying land. Tesla’s 57 MW deal with Zelestra and Apple’s 134 MWp contract with ib vogt epitomize how corporate heavyweights favor Spain solar rooftop market projects that marry brand optics with clean-energy procurement.[3]PV Tech, “Plenitude Starts Operations of 330 MW,” pv-tech.org As the EU’s Corporate Sustainability Reporting Directive takes hold, industrial buyers are expected to double on-site solar adoption by 2027.
EU Green Deal funds allocation
Spain’s Recovery Plan steers EUR 931 million (USD 1.02 billion) into grid upgrades that eliminate capacity claws for factory-scale rooftops, while a separate EUR 700 million storage aid scheme smooths variable output. Former coal regions earn bonus points for shovel-ready solar factories, redirecting skilled miners into module assembly lines and inverter testing floors.
Restraints Impact Analysis*
| Restraint | (~) % Impact on CAGR Forecast | Geographic Relevance | Impact Timeline |
|---|---|---|---|
| Lengthy municipal permitting cycles | -0.8% | National, most severe in major cities and heritage-rich regions | Short term (≤ 2 years) |
| Rooftop structural load limitations in pre-2000 buildings | -0.6% | Urban centers with older building stock, particularly Madrid, Barcelona | Medium term (2-4 years) |
| Scarce skilled rooftop-installer workforce | -0.5% | National, acute in rural and island regions | Medium term (2-4 years) |
| Anti-glare & aesthetic restrictions in heritage zones | -0.3% | Historic city centers, UNESCO sites, protected cultural areas | Long term (≥ 4 years) |
| Source: Mordor Intelligence | |||
Grid-interactive smart-inverter mandate
Town-hall approval for a 2 MW Barcelona retrofit can exceed 14 months, as planners juggle fire-safety reports, structural affidavits, and visual-impact statements. Brussels warned Spain that such delays jeopardize REPowerEU milestones. Girona’s seven-year saga to clear a mid-scale plant frightened risk-averse industrial CFOs, adding soft costs equal to 6% of total project spend.
Scarce skilled rooftop-installer workforce
Solar payrolls rose 59 % in 2024, yet chronic shortages persist for high-voltage electricians and licensed structural engineers. Industrial jobs, unlike residential installs, demand experience with 800 V strings, arc-flash mitigation, and thermal-imaging diagnostics, a skill set rare outside metros.[4]El Español, “Empresas Buscan Profesionales Cualificados,” elespanol.com
*Our forecasts treat driver/restraint impacts as directional, not additive. The impact forecasts reflect baseline growth, mix effects, and variable interactions.
Segment Analysis
By Capacity Range: Above 100 kW Systems Power Ahead
Spain's solar rooftop market size for arrays above 100 kW reached 5.76 GW in 2025, equal to 61.8% of total installed capacity. Within this cohort, multi-megawatt industrial roofs are logging 11.1% CAGR on the back of bulk component pricing and single interconnection fees that dilute per-kilowatt soft costs. The Spain solar rooftop market size for 10–100 kW projects stood at 2.41 GW, addressing warehouses and supermarkets that value net-metering without three-year grid studies.
Economies of scale slash installed outlays to EUR 0.68/W for 5-MW rooftops, 34% below residential benchmarks. Overdimensioning modules to inverter ratings boosts yield without extra BOS hardware. Meanwhile, under-10 kW systems lose share as subsidy caps shrink, though they remain vital in suburban feed-in clusters. Continual smart-inverter firmware updates let >100 kW systems offer voltage ride-through and synthetic inertia, turning factory roofs into microgrids that double as grid assets during contingency events.



By Installation Type: Retrofit Dominates but New-build Gathers Pace
Retrofit projects occupied 83.5% of Spain's solar rooftop market share in 2025, leveraging an enormous base of 210 million m² of existing industrial roofs. Fast-track audits identify steel-truss halls capable of hosting 4–7 kg/m² additional load, ideal for portrait-tilt configurations. Spain's solar rooftop market size for new-build integration totaled 1.54 GW, yet is climbing on the back of stricter Technical Building Code mandates requiring renewable electricity coverage.
Retrofits appeal to CFOs because performance can be benchmarked against historical load curves, letting them peg PPAs to 90 % self-consumption ratios. Nonetheless, developers increasingly influence architects pre-permit, embedding cable trays and south-facing parapets that cut future retro-work by 15 %. Building-integrated photovoltaics now appear on chilled-storage facades, marrying insulation with energy yield in one envelope layer. New-build adoption accelerates as rating agencies factor embodied carbon into lending spreads, nudging logisticians to solar-ready roof decks from day one.
By End-use: Industrial Hegemony
Industrial sites held 69.1% of cumulative capacity in 2025, more than double commercial allocations and dwarfing residential uptake. Cement plants, bottling lines, and vehicle-assembly halls each surpassed 10 MW rooftop arrays last year, turning their net-site emissions trajectories decisively downward. Spain's solar rooftop market share for industrial users is projected to grow at another 10.4% CAGR, reaching nearly 12 GW by 2031.
Commercial estates such as outlet malls and airport terminals prioritize 91 kW average system sizes that match daytime HVAC loads. They unlock 5-year paybacks through accelerated depreciation and self-consumption offsets. Residential adoption plateaus as power tariffs ease, yet battery-plus-solar bundles sustain niche growth among eco-centric homeowners. Industrial first movers deploy energy-management software that orchestrates solar generation, chill-water storage, and EV truck chargers, demonstrating the integrative frontier of the Spain solar rooftop industry.
Geography Analysis
Extremadura, Castile-La Mancha, and Andalusia collectively host 70 % of national rooftop wattage thanks to 1,800 kWh/m² insolation, vast logistics footprints, and extra-fast permitting windows. Extremadura’s regional decree waives municipal fees for systems above 100 kW installed on pre-registered industrial zones, compressing paperwork to 60 days. Castile-La Mancha piggybacks battery grants onto solar subsidies, pushing many wineries to adopt 2 h storage buffers.
Catalonia and Valencia accelerate via industrial cooperatives that share high-capacity feeders and leverage local steel fabrication for racking kits. Madrid’s 7,139 ha of untapped roofs could produce 32,163 GWh annually, enough to cover four-fifths of 2050 demand if grid-tie upgrades keep pace. Islands face diesel-priced tariffs above EUR 0.25/kWh; hence, the Balearics have earmarked EUR 700 million (USD 770 million) to subsidize behind-the-meter arrays, boosting self-consumption to 35% of peak-day load.
Former coal regions in Asturias and León realign workforces from shuttered mines to inverter QA labs, supported by NextGenerationEU reskilling funds. Grid planners schedule 110/30 kV substation upgrades adjacent to industrial parks, ensuring volt-variance stays within ±5 % even after 500 MW of new rooftop capacity fires up by 2028.
Regulatory Landscape
Spain continues to anchor rooftop self-consumption under Royal Decree 244/2019, which removed the prior deterrents to behind-the-meter solar and formalized surplus compensation and collective self-consumption mechanics. The regulatory framework was further updated with Royal Decree-Law 7/2026 (March 2026), which transposes EU Directive 2023/2413 and refreshes provisions affecting grid access, administrative processing, and fiscal measures for distributed renewables.
RDL 7/2026 includes enabling measures for rooftop-led schemes, such as a mandated follow-on royal decree (within three months) to regulate Renewable Energy Communities and Citizen Energy Communities. It also introduces procedural provisions, including automatic suspension of certain administrative milestones during legal injunctions. On network charges, CNMC Circular 3/2024 sets transmission and distribution tolls for 2024-2026, shaping the economics of self-consumption and exports. The same 2026 package maintains time-bound fiscal measures, including temporary VAT reductions on electricity and natural gas until June 30, 2026, and it enables simplified environmental assessment pathways for selected self-consumption projects in consolidated industrial areas.
Competitive Landscape
Iberdrola tops Spain solar rooftop market rankings with 5,055 MW across 43 plants, including Europe’s 550 MW Núñez de Balboa hybrid that combines land-adjacent trackers with brewery-roof arrays. Endesa eyes a 49.99 % asset divestiture to recycle capital, yet will retain O&M contracts, preserving annuity streams. Zelestra scales fastest, ballooning its pipeline from 7 GW in 2021 to 19 GW in 2025, a third of which sits on industrial roofs.
Market fragmentation persists among EPCs; fewer than 25 % of Spain’s 4,100 licensed installers handle arrays above 500 kW. Selectra’s 2025 client survey ranked Avenir Energía (9.2/10) and Samara (8.7/10) best for industrial change-management support. Foreign OEMs, SunPower, and SMA deploy performance-guarantee packages that offset bankability concerns for financiers underwriting 15-year PPAs. Joint ventures proliferate: racking maker Gonvarri pairs with Ferrovial to bundle steel supply and EPC, shaving 5 % off turnkey quotes.
M&A heats up as asset managers chase stable euro-denominated cash flows, with BayWa r.e.’s 60 MWp portfolio sale to KGAL and Ib Vogt’s 110 MW hand-off to NextEnergy Capital closing in July 2025. Expect installer roll-ups as private-equity firms arbitrage fragmented service territories.
Spain Rooftop Solar Industry Leaders
X-ELIO Energy
Repsol SA
Acciona SA
Endesa SA
Iberdrola SA
- *Disclaimer: Major Players sorted in no particular order

Market Opportunities and Future Outlook
Regulatory changes in 2026 widen the practical scope for rooftop and near-rooftop self-consumption, particularly for industrial and multi-tenant sites. Under RDL 7/2026, the maximum distance for collective self-consumption increases from 2 km to 5 km for photovoltaic and wind systems up to 5 MW, which expands the feasible radius for shared schemes across industrial estates and residential blocks. The rule also lowers the approval threshold in neighborhood communities to one-third of owners. Together, these changes create openings for aggregators, EPCs, and utilities to structure collective self-consumption, metering, and billing across multiple offtakers through a single grid interconnection.
The recent project pipeline provides concrete signs of demand for larger behind-the-meter assets and hybrid configurations. In June 2026, Repsol Petróleo, S.A. secured simplified environmental approval for an industrial self-consumption project in Puertollano, pairing a 48.02 MW photovoltaic installation with a 4 MW LFP battery, which supports the case for coupling industrial-area PV with storage where self-consumption ratios and operational continuity are priorities. On delivery models, Endesa X has commissioned turnkey self-consumption capacity for industrial customers (7.4 MWp across Kronospan plants in Burgos and Salas). Separately, Iberdrola España and Neinor Homes launched a Madrid pilot covering self-consumption and electrification for more than 160 newly built single-family homes, pointing to market appetite for standardized utility-led packages that combine rooftop PV with broader electrification and energy services. Fiscal support also underpins conversion activity, with the IRPF deduction for self-consumption extended through December 31, 2026, and municipalities using IBI and ICIO incentives (up to 50% IBI reductions and up to 95% ICIO exemptions) that can be reflected in point-of-sale economics for developers and installers.
Recent Industry Developments
- June 2026: Alight expanded onsite solar partnership with Lear Corp at the Lear European Electronics headquarters in Valls, Spain, adding a 1.4 MW carport system to the existing 1 MW rooftop installation. The expansion strengthens industrial self-consumption capacity and integrated solar solutions for automotive sites.
- March 2025: Stellantis Group (with Prosolia Energy) unveiled a rooftop solar facility at the Vigo plant for self-consumption, the largest rooftop installation at the site. This demonstrates scale-up of self-consumption and potential impact on local grid dynamics.
- January 2025: X-ELIO, with Tion Renewables, sold a 50 MW solar plant located in Almeria, Spain. Asset monetization and portfolio deployment signal for capital recycling in rooftop solar sector.


Research Methodology Framework and Report Scope
Market Definition and Coverage
For this study, the Spain rooftop solar market covers photovoltaic systems installed on rooftops in Spain and counted as installed capacity, including residential, commercial, and industrial rooftop applications.
Scope exclusions: Ground-mounted utility solar farms, floating PV, and non-rooftop building-integrated solar surfaces are excluded from this market sizing.
Segmentation Overview
- By Capacity Range
- Up to 10 kW
- 10 to 100 kW
- Above 100 kW
- By Installation Type
- New-build
- Retrofit
- By End-use
- Residential
- Commercial
- Industrial
Data Sources, Market Sizing, and Validation
Desk Research
We started by mapping Spain rooftop PV activity using public energy and policy data, then aligned it to how rooftop capacity is recorded over time. For anchoring, we used official statistics and tracker-style publications from Spain's energy ministry, national grid and market operator reporting, and EU level energy datasets. For technical definitions and sizing, we referenced sources such as IEA PVPS fact sheets and documents from standards bodies that describe PV system sizing and typical cost baselines.
To keep the model grounded, we also reviewed import and trade releases, installer and association updates (including UNEF summary material), and audited company reports and investor presentations that discuss rooftop pipelines and commissioning timing. A paid subscription for company financials and intelligence was used selectively to normalize installer and EPC revenue context, and a patent database was checked lightly to corroborate technology change signals. The desk sources referenced here are illustrative only, and many other public documents and clarifications were used during data collection and validation.
Primary Interviews and Surveys
Next, we validated assumptions through expert calls and short surveys with rooftop developers, EPCs, distributors, financiers, and large system buyers, to confirm what is actually being installed and when commissioning happens. Since this is a country market, we centered fieldwork on Spain-wide activity, and we used interviews to pressure test cost ranges, permitting timelines, typical system sizing, and the split between retrofit and new-build rooftop projects.
Distribution of primary research fieldwork respondents
| Company type | Respondent position |
|---|---|
| Top tier: 38% | CXOs: 21% |
| Mid tier: 41% | Functional/Unit leaders: 38% |
| Smaller Players: 21% | Managers: 41% |
Market-Sizing & Forecasting
Sizing was built using a top-down demand pool approach, where official rooftop and self-consumption capacity reporting is reconstructed into an annual installed base, then carried forward by expected additions and retirements. We corroborated totals with selective bottom-up checks, including sampled system sizes by customer type, installer throughput discussions, and a volume times typical cost sanity check when respondents provided cost bands.
Key inputs that shaped the model included reported rooftop PV cumulative capacity and yearly additions in Spain, the observed mix across industrial, commercial, and residential rooftop installations, typical rooftop system size ranges (the notes include bands up to 10 kW, 10 to 100 kW, and above 100 kW), and cost benchmarks from public technical summaries such as EUR per watt ranges for building-applied PV. We also tracked policy and grid-connection signals that influence commissioning timing, since rooftop deployments in Spain can shift quickly when incentives change.
For forecasting, we used scenario analysis because adoption depends on power prices, financing appetite, and permitting speed, which do not move in a straight line. Where bottom-up coverage was uneven, we filled gaps using conservative penetration assumptions and then re-tested them with expert feedback, so the final series stays aligned with the observed rooftop build rate.
Data Validation & Update Cycle
To validate results, we compared model outputs against independent signals such as official rooftop/self-consumption totals, yearly installation announcements, and cost trend movements. We also reviewed the time series for unusual jumps that did not match policy or grid realities. When variances appeared, we re-contacted sources to confirm whether the change reflected a reporting revision, a commissioning delay, or a real demand shift.
Before sign-off, the model goes through multiple analyst reviews, where key assumptions are challenged and recalculated to ensure they still connect back to the same observable indicators. Reports refresh annually, with interim updates when major policy changes or installation slowdowns show up in public tracking, and a final pre-delivery review is performed so clients get the most current view.
Mordor Intelligence's Spain Rooftop Solar Market Size Compared With Other Published Estimates
Different published market sizes for Spain rooftop solar can look far apart because the unit of measurement is not always consistent, and the time window can shift as well. Some sources publish capacity in GW, while others publish spending in USD, and the two do not convert cleanly unless pricing and installation mix are stated clearly.
The main gap comes from mixing value-based sizing with installed-capacity sizing, while Mordor Intelligence keeps the headline series in GW installed base and avoids inflating the numbers with system cost or financing assumptions. Differences also show up when one estimate includes off-grid rooftops or applies aggressive cost-per-watt changes year to year, while another stays closer to observed rooftop additions and commissioning timing.
Benchmark comparison
| Source | Market Size | Gaps in Research Methodology |
|---|---|---|
| Mordor Intelligence | USD 9.32 B (2025) | |
| Industry Research Publisher A | USD 1.80 B (2026) | This figure is reported in USD value terms and is tied to assumed system pricing and ownership or financing models, which can understate or overstate the market if the cost-per-watt path differs from what installers actually see. |
| Solar Trade Journal B | USD 8.14 B (2024) | This estimate is derived from total rooftop capacity and annual additions, then converted to a value number using implied cost bands, which can drift if industrial versus residential mix shifts or if EUR to USD conversion timing differs. |
The spread in the table is mostly explained by what is being counted, capacity installed versus dollars spent, and how pricing and currency timing are treated. By keeping assumptions tied to observable rooftop additions and by re-checking key inputs with field interviews, the model stays transparent and easier to replicate year to year.


Key Questions Answered in the Report
How big will Spain’s rooftop PV fleet be by 2031?
Installed capacity is projected at 15.42 GW, up from 10.37 GW in 2026.
Why do installations above 100 kW dominate capacity?
Large roofs deliver 30–40 % lower per-kW costs and qualify for streamlined PPAs, so they captured 61.8% of 2025 capacity.
Which incentive cuts payback the most for factories?
Net-metering paired with accelerated depreciation can trim industrial rooftop payback to under 5 years.
What is the main bottleneck for new industrial arrays?
Municipal permitting delays add up to 14 months in some cities, eroding IRR by roughly 1 percentage point.
Are storage systems common on rooftops?
Batteries accompany 26 % of new residential arrays and a growing share of mega-roof projects as grid-service revenues improve.
Page last updated on:


 Your data is secure and never sold or shared.


