Spain Data Center Market Size and Share
Market Overview
| Study Period | 2020 - 2031 |
|---|---|
| Forecast Data Period | 2026 - 2031 |
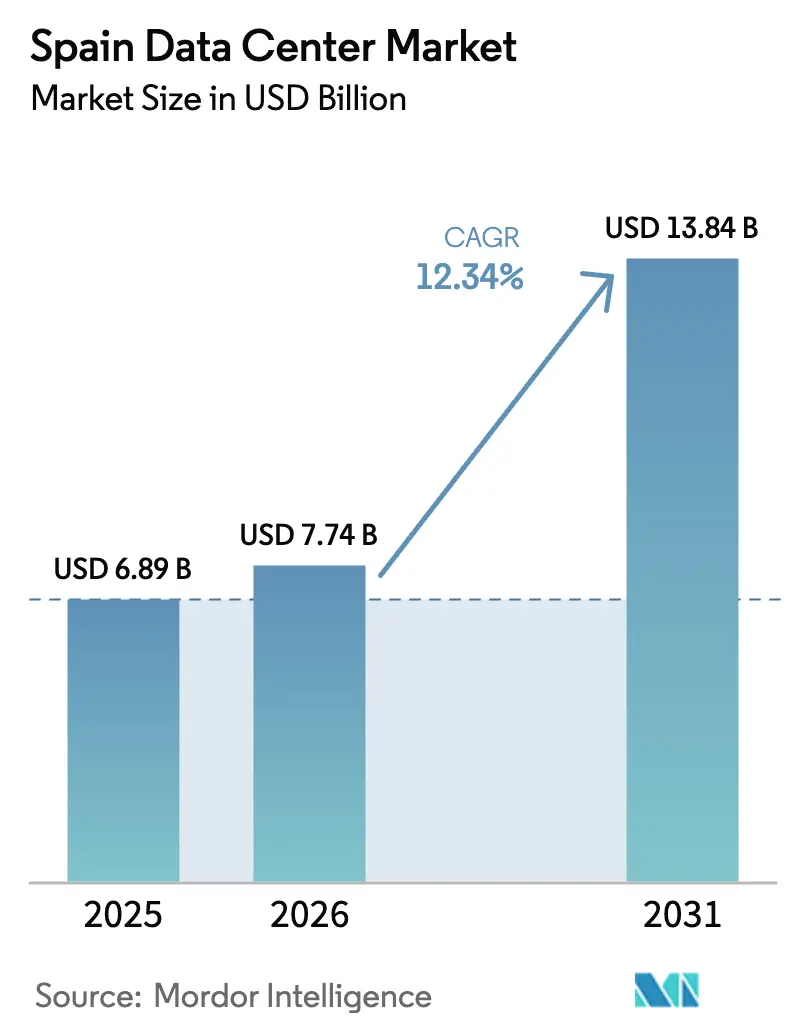
| Base Year Market Size (2025) | USD 6.89 Billion |
| Market Size (2026) | USD 7.74 Billion |
| Market Size (2031) | USD 13.84 Billion |
| Growth Rate (2026 - 2031) | 12.34% CAGR |
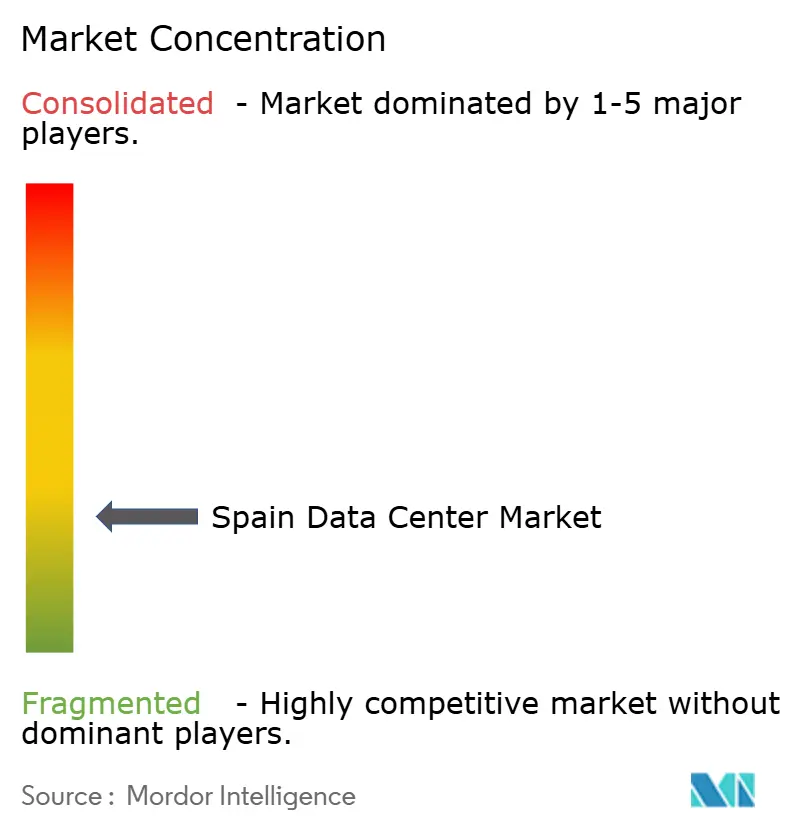
| Market Concentration | Low |
Major Players *Disclaimer: Major Players sorted in no particular order Image © Mordor Intelligence. Reuse requires attribution under CC BY 4.0. | |
Spain Data Center Market Analysis by Mordor Intelligence
Spain Data Center Market size market size in 2026 is estimated at USD 7.74 billion, growing from 2025 value of USD 6.89 billion with 2031 projections showing USD 13.84 billion, growing at 12.34% CAGR over 2026-2031. In terms of the IT load capacity, the market is expected to grow from 1.64 thousand megawatts in 2025 to 4.79 thousand megawatts by 2030, at a CAGR of 23.92% during the forecast period (2025-2030). The market segment shares and estimates are calculated and reported in terms of MW. Strong hyperscale commitments, rapid expansion of submarine cables, and abundant availability of renewable power position Spain as Southern Europe’s digital infrastructure hub. Operators benefit from direct long-term power-purchase agreements priced below prevailing European averages, a factor that sustains competitive colocation pricing even while national electricity tariffs remain volatile. At the same time, Spain’s role as a landing point for transatlantic systems such as Grace Hopper and Anjana reduces latency to the Americas and attracts cloud providers seeking geographic diversity. Public-sector incentives that channel EUR 6.625 billion (USD 7.42 billion) per year into grid upgrades through 2030 further mitigate infrastructure bottlenecks. Overall, the Spain data center market enjoys a favorable confluence of capital inflows, policy support, and demand from both domestic enterprises and global hyperscalers.
Key Report Takeaways
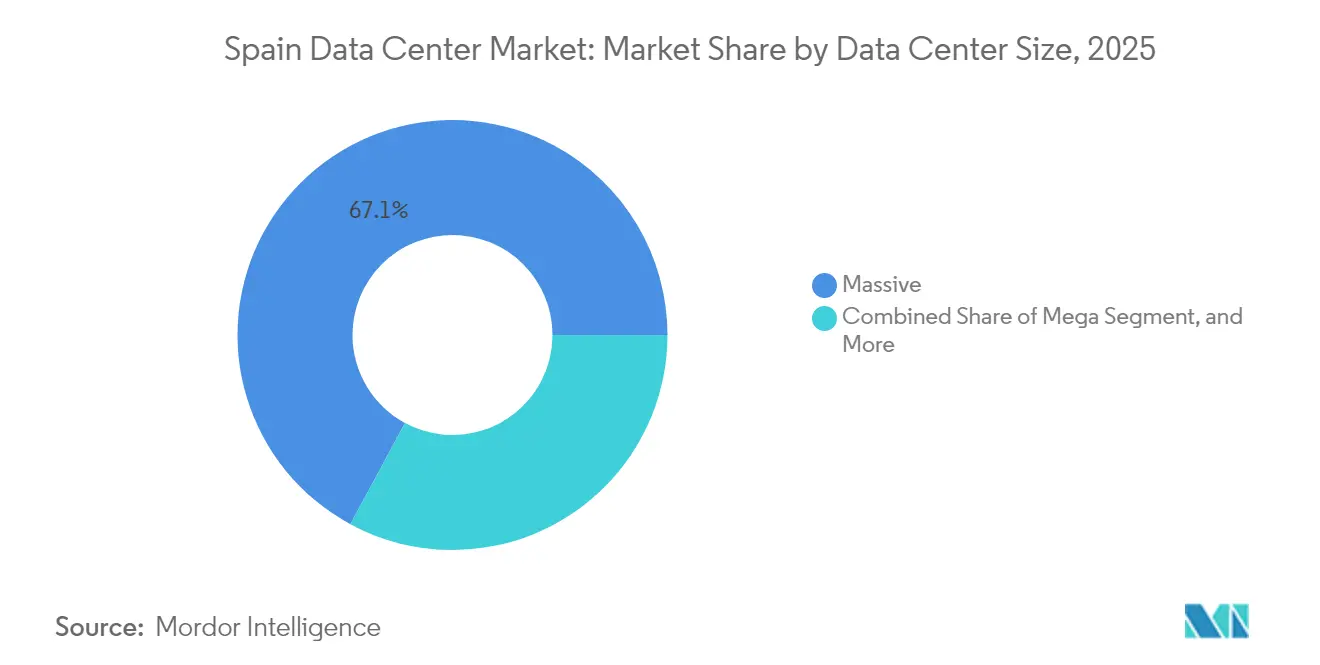
- By data center size, massive facilities held 67.12% of Spain data center market share in 2025, while edge sites are advancing at a 24.10% CAGR through 2031.
- By tier type, Tier 4 captured 61.02% of 2025 capacity in the Spain data center market; the same tier is projected to expand at 23.10% CAGR to 2031.
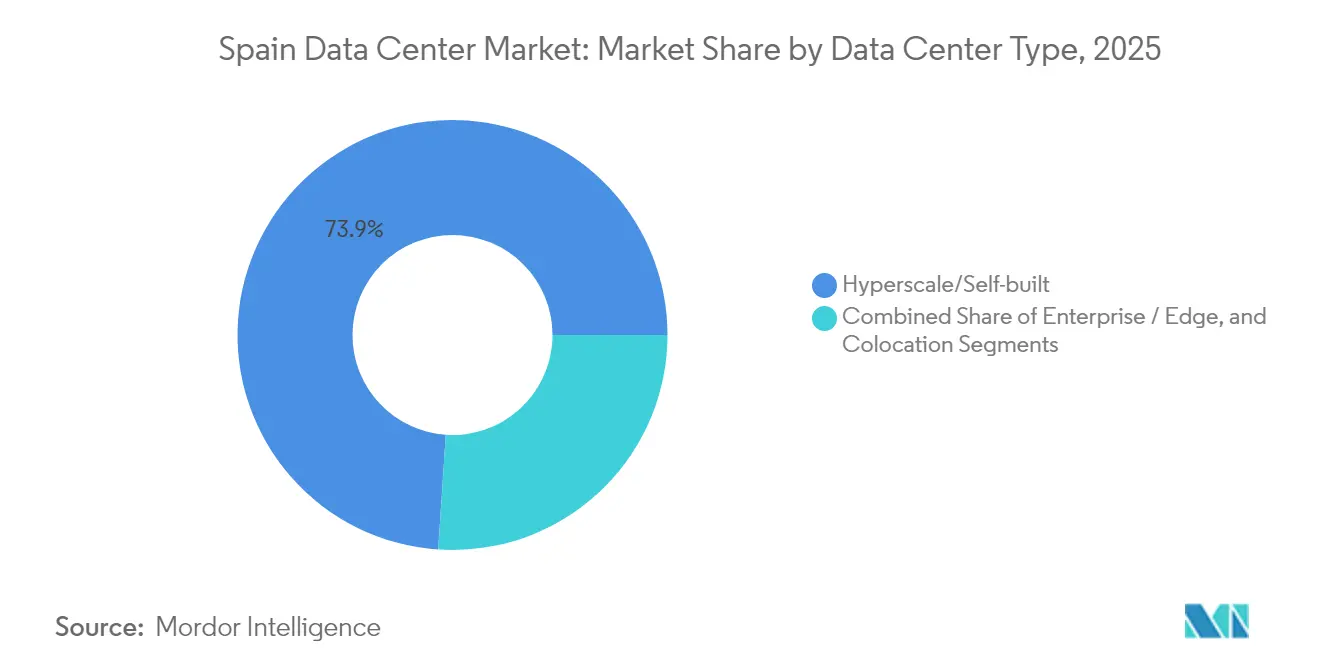
- By data center type, hyperscale and self-built sites controlled 73.94% of capacity in 2025 in the Spain data center market, yet edge deployments are rising at a 25.35% CAGR during the forecast period.
- By end user, IT and telecom companies accounted for 54.76% of installed capacity in 2025 in the Spain data center market, whereas BFSI requirements are poised for a 23.20% CAGR through 2031.
- By hotspot, Madrid commanded 43.62% of capacity in 2025 in the Spain data center market, but the Rest of Spain segment is projected to grow fastest at 24.85% CAGR.
Note: Market size and forecast figures in this report are generated using Mordor Intelligence’s proprietary estimation framework, updated with the latest available data and insights as of 2026.
Spain Data Center Market Trends and Insights
Drivers Impact Analysis*
| Driver | (~) % Impact on CAGR Forecast | Geographic Relevance | Impact Timeline |
|---|---|---|---|
| Surge in hyperscale cloud deployments by US tech giants | +8.5% | Madrid, Aragon, Barcelona | Medium term (2-4 years) |
| Growing digitalization of Spanish enterprises boosting colocation demand | +6.2% | National, concentrated in Madrid and Barcelona | Long term (≥ 4 years) |
| Government renewable-energy incentives lowering PUE targets for new builds | +4.1% | Aragon, Extremadura, Castilla-La Mancha | Medium term (2-4 years) |
| Rising submarine cable landings creating low-latency gateway role for Spain | +3.8% | Bilbao, Santander, Barcelona | Long term (≥ 4 years) |
| Spain–Latin America traffic corridors fostering edge hubs | +2.9% | Northern Spain, Madrid interconnection points | Long term (≥ 4 years) |
| Expansion of 5G private networks in auto-manufacturing corridors | +2.1% | Madrid, Barcelona, Valencia | Short term (≤ 2 years) |
| Source: Mordor Intelligence | |||
Surge in Hyperscale Cloud Deployments by US Tech Giants
Record-setting capital commitments are reshaping the Spain data center market, led by Microsoft’s EUR 7.16 billion (USD 8.02 billion) Aragon campus and AWS’s EUR 15.7 billion (USD 17.58 billion) multi-site expansion. Google’s operational Madrid region, anchored by the Grace Hopper cable in Bilbao, bypasses congested Northern European routes and strengthens transatlantic redundancy. Meta is investing EUR 750 million (USD 840 million) in Talavera de la Reina while deploying the Anjana cable into Santander, further enlarging Spain’s hyperscale ecosystem. Collectively, these projects add more than 1 GW of new capacity and are expected to stimulate an estimated EUR 10.7 billion in GDP contribution through 2030. Their willingness to self-build reinforces long-term infrastructure resilience and underpins the doubling of Spain's data center market capacity this decade.
Growing Digitalization of Spanish Enterprises Boosting Colocation Demand
Enterprise cloud penetration in Spain stands at 27.2%, compared to the 38.9% EU average, leaving a sizable adoption gap. The government’s EUR 26.7 billion (USD 29.90 billion) Digital Decade program targets SMEs, driving demand for managed services and increasing rack absorption in Madrid and Barcelona. AI adoption already outpaces Europe, with a 9.3% annual growth rate that requires GPU-optimized colocation suites and high-density power designs. BFSI institutions are accelerating their uptake due to NIS2 cybersecurity mandates that favor domestic hosting, while Spain’s aspiration to serve as a European cybersecurity hub deepens enterprise reliance on local data centers. As companies migrate workloads, colocation occupancy in core campuses has surpassed 85%, and pre-leasing for upcoming builds continues to rise.
Government Renewable-Energy Incentives Lowering PUE Targets for New Builds
Spain aims for 74% renewable electricity generation by 2030 and has introduced EUR 750 million (USD 840 million) in manufacturing incentives for solar and storage technologies.[1]Ministerio para la Transición Ecológica y el Reto Demográfico, “El MITECO lanza a consulta pública nuevas ayudas a la fabricación de tecnologías renovables y almacenamiento,” miteco.gob.es Data center operators secure long-term power contracts at rates up to 50% below EU averages, enabling PUE targets under 1.3. Merlin Properties utilizes waterless cooling in its 600 MW roadmap, and Digital Realty has implemented closed-loop refrigeration to minimize water consumption in drought-prone areas. Academic studies show Barcelona facilities achieving a 1.311 PUE with solar integration, while 200 kWp rooftop systems deliver four-year payback periods. Coupled with EU sustainability reporting for sites above 500 kW, renewable incentives strengthen operators’ environmental credentials and cost competitiveness.
Rising Submarine Cable Landings Creating Low-Latency Gateway Role for Spain
The Grace Hopper system delivers 24 fiber pairs and 480 Tbps theoretical capacity into Bilbao, trimming latency to U.S. East Coast locations by 15-20 ms. Meta’s Anjana route offers direct Santander-Myrtle Beach connectivity, and EllaLink’s Brazil-Portugal link achieves 50% latency savings compared with North American transits. [2]Thomas Lanaute, “Connecting Latin America to the World: Why the Iberian Peninsula is the Superior Choice,” BSO, bso.coCombined with projects such as 2Africa and Medusa, Spain hosts nine active or planned transatlantic and Mediterranean systems, outpacing other Southern European nations. This density supports content distribution, financial trading, and sovereign AI initiatives that require predictable latency, thereby fortifying the Span data center market as a continental gateway.
Restraints Impact Analysis*
| Restraint | (~) % Impact on CAGR Forecast | Geographic Relevance | Impact Timeline |
|---|---|---|---|
| Shortage of skilled data-center engineers inflating OPEX | -3.7% | Madrid and Barcelona | Medium term (2-4 years) |
| High electricity prices and grid congestion in Madrid hotspot | -2.9% | Madrid metropolitan area | Short term (≤ 2 years) |
| Lengthy municipal permitting tied to power-infrastructure upgrades | -2.4% | Urban centers | Medium term (2-4 years) |
| Pricing pressure from emerging Portuguese colocation campuses | -1.8% | Iberian Peninsula | Medium term (2-4 years) |
| Source: Mordor Intelligence | |||
Shortage of Skilled Data-Center Engineers Inflating OPEX
The industry must attract 2,000 additional specialists by 2026; however, ICT employment in Spain accounts for only 4.4% of the labor force, which is below the EU average of 4.8%. Roles in cooling optimization, AI infrastructure, and network automation remain hardest to fill, pushing wage premiums as high as 30% above national engineering averages. AWS and Microsoft have launched training programs, which are expected to support 86,500 indirect jobs. However, onboarding cycles are lengthening commissioning timelines and increasing operating costs for new sites. Persistent gaps could delay capacity ramp-ups and hinder the growth momentum of the Spanish data center market.
High Electricity Prices and Grid Congestion in Madrid Hotspot
Madrid’s data center pipeline exceeds the guaranteed grid capacity by more than four times, forcing operators to compete for limited transmission nodes under new government auction rules. Applications now require EUR 40,000 per MW in performance bonds, and unused allocations expire if 50% of the capacity is not utilized within the first period.[3]Clifford Chance, “Regulatory challenges for data centres in Spain,” cliffordchance.com As a result, 19 large projects have migrated toward Aragon, where ample renewable generation alleviates constraints. While national investment of EUR 6.625 billion (USD 7.42 billion) per year in grid upgrades provides relief, near-term congestion pressures moderate Madrid’s share gains in the Spain data center market.
*Our forecasts treat driver/restraint impacts as directional, not additive. The impact forecasts reflect baseline growth, mix effects, and variable interactions.
Segment Analysis
By Data Center Size: Massive Facilities Lead as Edge Momentum Builds
Massive sites above 50 MW captured 67.12% of installed capacity in 2025, confirming the scale-seeking nature of hyperscalers that anchor the Spain data center market share for this size class. Landmark projects include Microsoft’s 300 MW first-phase build in Aragon and Blackstone’s 500 MW Zaragoza campus, each supported by multi-gigawatt renewable pipelines. These deployments enhance Spain data center market size economics through purchasing power on land and energy, while enabling direct interconnect fabrics for AI workloads. Simultaneously, nationwide 5G coverage of 96% and multi-municipality private network rollouts trigger demand for distributed compute nodes that are tolerant of 20-40 kW racks.
Growth tipping to 24.10% CAGR in the edge category signals structural diversification. Telecom carriers, such as Telefónica, have initiated micro-data-center initiatives within existing central offices, and regional operator Templus plans to establish 20 sites by late 2025 to capitalize on latency-sensitive video analytics and IoT telemetry. Medium and large facilities fill the gap for enterprises requiring scale between single-cabinet colocation and hyperscale builds. Small sites, meanwhile, serve provincial governments and healthcare trusts that need secure on-premise extensions. The holistic size continuum indicates that the Spain data center market is evolving into a multi-tier ecosystem comparable with Northern European benchmarks.


By Tier Type: Tier 4 Sites Dominate, Validating Premium Uptime Demand
Tier 4 facilities represented 61.02% of capacity in 2025 and are projected to grow at 23.10% CAGR, reflecting end-user preference for mission-critical resiliency standards in the Spain data center market size expansion. Financial institutions reacting to PSD2 and NIS2 mandates favor dual-fed power and concurrently maintainable cooling, reinforcing the country’s status as a compliance-focused hosting destination. Operators such as Iron Mountain highlight their ENS and ISO 27001 accreditations, which command pricing premiums and ensure rapid pre-leasing.
Tier 1 and Tier 2 assets, often retrofit telecom exchanges, serve back-up, development, and content-delivery roles where intermittent downtime carries lower business risk. Mid-tier density continues to decline as edge nodes prioritize lightweight deployments over traditional single-story halls. The growing Tier 4 tilt shows that Spain data center market share gains skew toward operators able to fund redundant transformers, ultra-efficient UPS, and advanced fire-suppression systems, aligning with the EU’s twin goals of cybersecurity and sustainability.
By Data Center Type: Hyperscale Ownership Prevails but Edge Rises Rapidly
Hyperscale and self-built campuses constituted 73.94% of capacity in 2025, underscoring how cloud majors prefer direct control over core digital infrastructure in the Spain data center market. Direct land purchases and in-house switchgear allow operators to meet software-defined network requirements and PUE targets under 1.2. Wholesale colocation remains in demand for secondary workloads and multi-cloud failover, while retail cages cater to SMEs that require secure footprints without incurring capital expenditure.
Edge facilities are projected to clock a 25.35% forecast CAGR as AI inference, real-time analytics, and AR/VR experiences migrate closer to users. Spain’s ranking of 12th globally, with 20 private-network customers, hints at steady traction in manufacturing corridors and logistics hubs. Non-utilized colocation space offers expansion buffers; however, rising power-density requirements accelerate capacity drawdowns, tightening vacancy in legacy halls. The interplay between mega-campuses and micro-nodes illustrates a barbell dynamic that funnels investment into opposite ends of the size spectrum within the Spain data center market.
By End User: IT and Telecom Lead, BFSI Expands Fastest
IT and telecom firms held 54.76% of the installed capacity in 2025, leveraging Spain’s submarine cable density and cross-continental peering to deliver global content with sub-50 ms round-trip latency. Carrier-neutral campuses around Madrid’s edge rings host dense internet-exchange fabrics, elevating Spain data center market share for telecom workloads. Digital-first streaming platforms also favor Barcelona for low-latency regional delivery.
BFSI workloads are expected to register a 23.20% CAGR through 2031 as banks localize core systems to meet data sovereignty rules. Spanish lenders with Latin American footprints benefit from Madrid’s direct connections to São Paulo and Bogotá, reducing transaction latency and ensuring regulatory alignment across both continents. Manufacturing demand grows in parallel with Industry 4.0 adoption; MasOrange’s private 5G deployment in Barcelona Port exemplifies the trend toward localized computing for autonomous vehicles and robotics. Government, e-commerce, and healthcare each represent smaller yet strategic slices of Spain data center industry growth as digital-public-service mandates widen.
Geography Analysis
Madrid controlled 43.62% of 2025 national capacity despite grid saturation, confirming its role as Spain’s gateway for intra-European and trans-Atlantic traffic. The metro hosts Iron Mountain’s 79 MW campus in San Fernando de Henares and Digital Realty’s interconnected estates totaling more than 200 MW. However, new auction rules and transmission-node constraints anchor near-term expansions, leading to longer development timelines.
Barcelona stands as the second-largest cluster, buoyed by Digital Realty’s EUR 230 million (USD 257.6 million) BCN1 project in Sant Adrià de Besòs that will add 21 MW of edge-optimized capacity in 2026. The city benefits from direct Mediterranean cable landings, strong enterprise presence, and slightly less congested power grids compared with the capital. Its proximity to France and Italy enhances peering economics, making it a favored locale for AI inference workloads.
The Rest of Spain region records the fastest trajectory at 24.85% CAGR, led by Aragon’s wave of commitments from Microsoft, AWS, and Blackstone worth more than EUR 30 billion (USD 33.6 billion). Renewable-rich Extremadura and Castilla-La Mancha host next-generation AI campuses of 1 GW each, while Galicia explores wind-powered facilities linked to northern fiber corridors. As a result, Spain data center market size in secondary regions could quadruple by 2031, balancing national capacity and reducing over-reliance on Madrid.
Competitive Landscape
Spain’s data center market is moderately concentrated, with the top five operators estimated to control 65-70% of installed load. Aermont Capital’s EUR 1 billion (USD 1.12 billion) acquisition of Nabiax in November 2024 exemplifies private-equity interest in carrier-neutral assets. Merlin Properties pursues a EUR 2.4 billion (USD 2.69 billion) pipeline spanning 274 MW and differentiates with water-efficient cooling and onsite solar procurement, while Digital Realty focuses on metro-edge synergy through its BCN1 project.
Competitive dynamics hinge on access to electrical capacity, prompting alliances with utilities such as Iberdrola, which seeks a EUR 1.7-2.0 billion (USD 1.90-2.24 billion) partner for a 200 MW portfolio. Technological moats include liquid-immersion cooling for AI racks and AI-enabled power-management systems that dynamically adjust load factors in real-time, supporting sub-1.3 PUE targets in hot-summer climates. New entrants, such as Templus and ACS, leverage brownfield industrial plots in secondary cities to sidestep Madrid’s grid queues and capture edge-compute demand.
Strategic moves illustrate a shift from location-centric to resource-centric competition. Operators secure dedicated renewable generation through 10-15-year PPAs, reducing exposure to market tariffs and meeting clients’ Scope 2 targets. M&A also accelerates scale: CVC’s purchase of Adam Ecotech adds small-to-medium colocation assets, and Blackstone’s Zaragoza campus underscores global investor appetite for hyperscale landbanks. Overall, the Spain data center market balances consolidation among incumbents with greenfield proliferation by capital-rich challengers.
Spain Data Center Industry Leaders
Equinix Inc.
Amazon Web Services Inc.
Microsoft Corporation
Digital Realty Trust Inc.
CyrusOne LLC
- *Disclaimer: Major Players sorted in no particular order

Recent Industry Developments
- June 2025: ACS and Benbros Energy secured regional-interest approval for a EUR 1.254 billion (USD 1.40 billion), 150 MW facility in Zaragoza, with expansion potential to 300 MW by 2028.
- May 2025: Edge-focused operator Templus announced a EUR 300 million (USD 336 million) program to reach 20 live sites across Spain by year-end 2025
- April 2025: ACS revealed additional multi-site data center plans in Aragon to capitalize on surplus renewable-generation capacity.
- January 2025: Meta committed EUR 750 million (USD 840 million) to construct a data center in Talavera de la Reina, strengthening its Spanish infrastructure footprint.


Spain Data Center Market Report Scope
Madrid are covered as segments by Hotspot. Large, Massive, Medium, Mega, Small are covered as segments by Data Center Size. Tier 1 and 2, Tier 3, Tier 4 are covered as segments by Tier Type. Non-Utilized, Utilized are covered as segments by Absorption.| Large |
| Massive |
| Medium |
| Mega |
| Small |
| Tier 1 and 2 |
| Tier 3 |
| Tier 4 |
| Hyperscale / Self-built | ||
| Enterprise / Edge | ||
| Colocation | Non-Utilized | |
| Utilized | Retail Colocation | |
| Wholesale Colocation | ||
| BFSI |
| IT and ITES |
| E-Commerce |
| Government |
| Manufacturing |
| Media and Entertainment |
| Telecom |
| Other End Users |
| Madrid |
| Barcelona |
| Rest of Spain |
| By Data Center Size | Large | ||
| Massive | |||
| Medium | |||
| Mega | |||
| Small | |||
| By Tier Type | Tier 1 and 2 | ||
| Tier 3 | |||
| Tier 4 | |||
| By Data Center Type | Hyperscale / Self-built | ||
| Enterprise / Edge | |||
| Colocation | Non-Utilized | ||
| Utilized | Retail Colocation | ||
| Wholesale Colocation | |||
| By End User | BFSI | ||
| IT and ITES | |||
| E-Commerce | |||
| Government | |||
| Manufacturing | |||
| Media and Entertainment | |||
| Telecom | |||
| Other End Users | |||
| By Hotspot | Madrid | ||
| Barcelona | |||
| Rest of Spain | |||


Market Definition
- IT LOAD CAPACITY - The IT load capacity or installed capacity, refers to the amount of energy consumed by servers and network equipments placed in a rack installed. It is measured in megawatt (MW).
- ABSORPTION RATE - It denotes the extend to which the data center capacity has been leased out. For instance, a 100 MW DC has leased out 75 MW, then absorption rate would be 75%. It is also referred as utilization rate and leased-out capacity.
- RAISED FLOOR SPACE - It is an elevated space build over the floor. This gap between the original floor and the elevated floor is used to accommodate wiring, cooling, and other data center equipment. This arrangement assist in having proper wiring and cooling infrastructure. It is measured in square feet (ft^2).
- DATA CENTER SIZE - Data Center Size is segmented based on the raised floor space allocated to the data center facilities. Mega DC - # of Racks must be more than 9000 or RFS (raised floor space) must be more than 225001 Sq. ft; Massive DC - # of Racks must be in between 9000 and 3001 or RFS must be in between 225000 Sq. ft and 75001 Sq. ft; Large DC - # of Racks must be in between 3000 and 801 or RFS must be in between 75000 Sq. ft and 20001 Sq. ft; Medium DC # of Racks must be in between 800 and 201 or RFS must be in between 20000 Sq. ft and 5001 Sq. ft; Small DC - # of Racks must be less than 200 or RFS must be less than 5000 Sq. ft.
- TIER TYPE - According to Uptime Institute the data centers are classified into four tiers based on the proficiencies of redundant equipment of the data center infrastructure. In this segment the data center are segmented as Tier 1,Tier 2, Tier 3 and Tier 4.
- COLOCATION TYPE - The segment is segregated into 3 categories namely Retail, Wholesale and Hyperscale Colocation service. The categorization is done based on the amount of IT load leased out to potential customers. Retail colocation service has leased capacity less than 250 kW; Wholesale colocation services has leased capacity between 251 kW and 4 MW and Hyperscale colocation services has leased capacity more than 4 MW.
- END CONSUMERS - The Data Center Market operates on a B2B basis. BFSI, Government, Cloud Operators, Media and Entertainment, E-Commerce, Telecom and Manufacturing are the major end-consumers in the market studied. The scope only includes colocation service operators catering to the increasing digitalization of the end-user industries.
| Keyword | Definition |
|---|---|
| Rack Unit | Generally referred as U or RU, it is the unit of measurement for the server unit housed in the racks in the data center. 1U is equal to 1.75 inches. |
| Rack Density | It defines the amount of power consumed by the equipment and server housed in a rack. It is measured in kilowatt (kW). This factor plays a critical role in data center design and, cooling and power planning. |
| IT Load Capacity | The IT load capacity or installed capacity, refers to the amount of energy consumed by servers and network equipment placed in a rack installed. It is measured in megawatt (MW). |
| Absorption Rate | It denotes how much of the data center capacity has been leased out. For instance, if a 100 MW DC has leased out 75 MW, then the absorption rate would be 75%. It is also referred to as utilization rate and leased-out capacity. |
| Raised Floor Space | It is an elevated space built over the floor. This gap between the original floor and the elevated floor is used to accommodate wiring, cooling, and other data center equipment. This arrangement assists in having proper wiring and cooling infrastructure. It is measured in square feet/meter. |
| Computer Room Air Conditioner (CRAC) | It is a device used to monitor and maintain the temperature, air circulation, and humidity inside the server room in the data center. |
| Aisle | It is the open space between the rows of racks. This open space is critical for maintaining the optimal temperature (20-25 °C) in the server room. There are primarily two aisles inside the server room, a hot aisle and a cold aisle. |
| Cold Aisle | It is the aisle wherein the front of the rack faces the aisle. Here, chilled air is directed into the aisle so that it can enter the front of the racks and maintain the temperature. |
| Hot Aisle | It is the aisle where the back of the racks faces the aisle. Here, the heat dissipated from the equipment’s in the rack is directed to the outlet vent of the CRAC. |
| Critical Load | It includes the servers and other computer equipment whose uptime is critical for data center operation. |
| Power Usage Effectiveness (PUE) | It is a metric which defines the efficiency of a data center. It is calculated by: (𝑇𝑜𝑡𝑎𝑙 𝐷𝑎𝑡𝑎 𝐶𝑒𝑛𝑡𝑒𝑟 𝐸𝑛𝑒𝑟𝑔𝑦 𝐶𝑜𝑛𝑠𝑢𝑚𝑝𝑡𝑖𝑜𝑛)/(𝑇𝑜𝑡𝑎𝑙 𝐼𝑇 𝐸𝑞𝑢𝑖𝑝𝑚𝑒𝑛𝑡 𝐸𝑛𝑒𝑟𝑔𝑦 𝐶𝑜𝑛𝑠𝑢𝑚𝑝𝑡𝑖𝑜𝑛). Further, a data center with a PUE of 1.2-1.5 is considered highly efficient, whereas, a data center with a PUE >2 is considered highly inefficient. |
| Redundancy | It is defined as a system design wherein additional component (UPS, generators, CRAC) is added so that in case of power outage, equipment failure, the IT equipment should not be affected. |
| Uninterruptible Power Supply (UPS) | It is a device that is connected in series with the utility power supply, storing energy in batteries such that the supply from UPS is continuous to IT equipment even during utility power is snapped. The UPS primarily supports the IT equipment only. |
| Generators | Just like UPS, generators are placed in the data center to ensure an uninterrupted power supply, avoiding downtime. Data center facilities have diesel generators and commonly, 48-hour diesel is stored in the facility to prevent disruption. |
| N | It denotes the tools and equipment required for a data center to function at full load. Only "N" indicates that there is no backup to the equipment in the event of any failure. |
| N+1 | Referred to as 'Need plus one', it denotes the additional equipment setup available to avoid downtime in case of failure. A data center is considered N+1 when there is one additional unit for every 4 components. For instance, if a data center has 4 UPS systems, then for to achieve N+1, an additional UPS system would be required. |
| 2N | It refers to fully redundant design wherein two independent power distribution system is deployed. Therefore, in the event of a complete failure of one distribution system, the other system will still supply power to the data center. |
| In-Row Cooling | It is the cooling design system installed between racks in a row where it draws warm air from the hot aisle and supplies cool air to the cold aisle, thereby maintaining the temperature. |
| Tier 1 | Tier classification determines the preparedness of a data center facility to sustain data center operation. A data center is classified as Tier 1 data center when it has a non-redundant (N) power component (UPS, generators), cooling components, and power distribution system (from utility power grids). The Tier 1 data center has an uptime of 99.67% and an annual downtime of <28.8 hours. |
| Tier 2 | A data center is classified as Tier 2 data center when it has a redundant power and cooling components (N+1) and a single non-redundant distribution system. Redundant components include extra generators, UPS, chillers, heat rejection equipment, and fuel tanks. The Tier 2 data center has an uptime of 99.74% and an annual downtime of <22 hours. |
| Tier 3 | A data center having redundant power and cooling components and multiple power distribution systems is referred to as a Tier 3 data center. The facility is resistant to planned (facility maintenance) and unplanned (power outage, cooling failure) disruption. The Tier 3 data center has an uptime of 99.98% and an annual downtime of <1.6 hours. |
| Tier 4 | It is the most tolerant type of data center. A Tier 4 data center has multiple, independent redundant power and cooling components and multiple power distribution paths. All IT equipment are dual powered, making them fault tolerant in case of any disruption, thereby ensuring interrupted operation. The Tier 4 data center has an uptime of 99.74% and an annual downtime of <26.3 minutes. |
| Small Data Center | Data center that has floor space area of ≤ 5,000 Sq. ft or the number of racks that can be installed is ≤ 200 is classified as a small data center. |
| Medium Data Center | Data center which has floor space area between 5,001-20,000 Sq. ft, or the number of racks that can be installed is between 201-800, is classified as a medium data center. |
| Large Data Center | Data center which has floor space area between 20,001-75,000 Sq. ft, or the number of racks that can be installed is between 801-3,000, is classified as a large data center. |
| Massive Data Center | Data center which has floor space area between 75,001-225,000 Sq. ft, or the number of racks that can be installed is between 3001-9,000, is classified as a massive data center. |
| Mega Data Center | Data center that has a floor space area of ≥ 225,001 Sq. ft or the number of racks that can be installed is ≥ 9001 is classified as a mega data center. |
| Retail Colocation | It refers to those customers who have a capacity requirement of 250 kW or less. These services are majorly opted by small and medium enterprises (SMEs). |
| Wholesale Colocation | It refers to those customers who have a capacity requirement between 250 kW to 4 MW. These services are majorly opted by medium to large enterprises. |
| Hyperscale Colocation | It refers to those customers who have a capacity requirement greater than 4 MW. The hyperscale demand primarily originates from large-scale cloud players, IT companies, BFSI, and OTT players (like Netflix, Hulu, and HBO+). |
| Mobile Data Speed | It is the mobile internet speed a user experiences via their smartphones. This speed is primarily dependent on the carrier technology being used in the smartphone. The carrier technologies available in the market are 2G, 3G, 4G, and 5G, where 2G provides the slowest speed while 5G is the fastest. |
| Fiber Connectivity Network | It is a network of optical fiber cables deployed across the country, connecting rural and urban regions with high-speed internet connection. It is measured in kilometer (km). |
| Data Traffic per Smartphone | It is a measure of average data consumption by a smartphone user in a month. It is measured in gigabyte (GB). |
| Broadband Data Speed | It is the internet speed that is supplied over the fixed cable connection. Commonly, copper cable and optic fiber cable are used in both residential and commercial use. Here, optic cable fiber provides faster internet speed than copper cable. |
| Submarine Cable | A submarine cable is a fiber optic cable laid down at two or more landing points. Through this cable, communication and internet connectivity between countries across the globe is established. These cables can transmit 100-200 terabits per second (Tbps) from one point to another. |
| Carbon Footprint | It is the measure of carbon dioxide generated during the regular operation of a data center. Since, coal, and oil & gas are the primary source of power generation, consumption of this power contributes to carbon emissions. Data center operators are incorporating renewable energy sources to curb the carbon footprint emerging in their facilities. |


Research Methodology
Mordor Intelligence follows a four-step methodology in all our reports.
- Step-1: Identify Key Variables: In order to build a robust forecasting methodology, the variables and factors identified in Step-1 are tested against available historical market numbers. Through an iterative process, the variables required for market forecast are set and the model is built on the basis of these variables.
- Step-2: Build a Market Model: Market-size estimations for the forecast years are in nominal terms. Inflation is not a part of the pricing, and the average selling price (ASP) is kept constant throughout the forecast period for each country.
- Step-3: Validate and Finalize: In this important step, all market numbers, variables and analyst calls are validated through an extensive network of primary research experts from the market studied. The respondents are selected across levels and functions to generate a holistic picture of the market studied.
- Step-4: Research Outputs: Syndicated Reports, Custom Consulting Assignments, Databases & Subscription Platforms


