
Market Overview
| Study Period | 2021 - 2031 |
|---|---|
| Forecast Data Period | 2026 - 2031 |
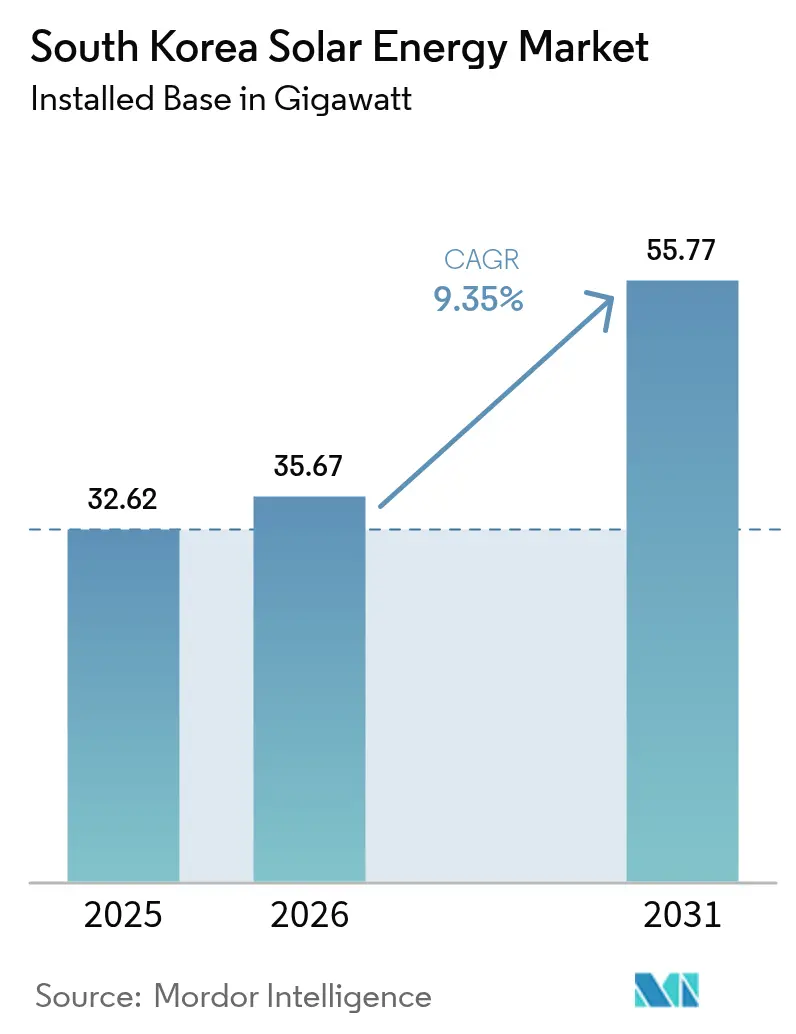
| Base Year Market Size (2025) | 32.62 gigawatt |
| Market Volume (2026) | 35.67 gigawatt |
| Market Volume (2031) | 55.77 gigawatt |
| Growth Rate (2026 - 2031) | 9.35 % |
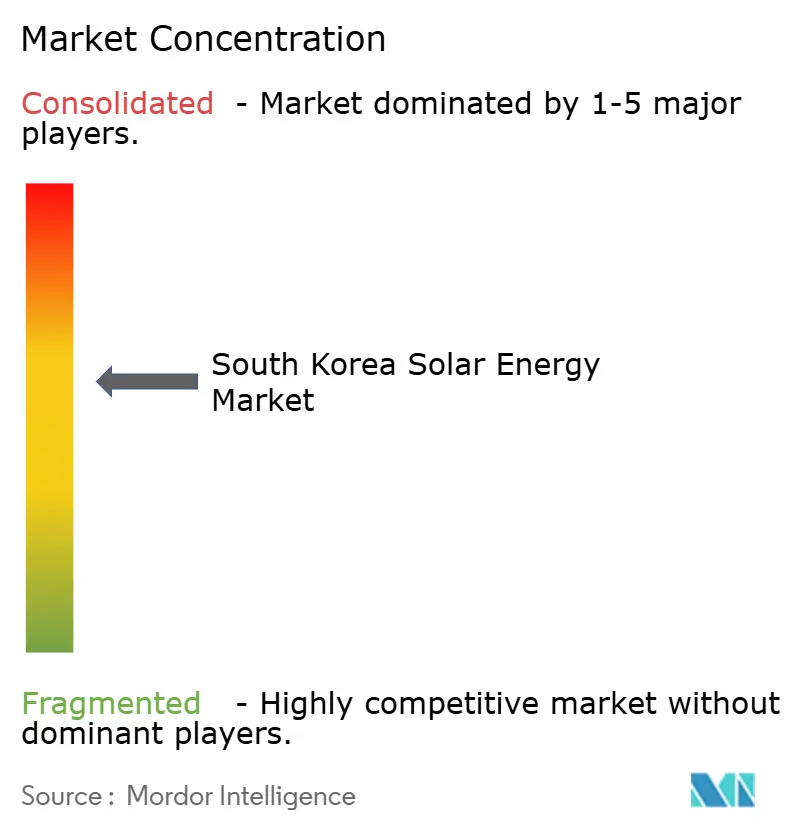
| Market Concentration | Medium |
Major Players *Disclaimer: Major Players sorted in no particular order Image © Mordor Intelligence. Reuse requires attribution under CC BY 4.0. | |
South Korea Solar Energy Market Analysis by Mordor Intelligence
The South Korea Solar Energy Market size in 2026 is estimated at 35.67 gigawatt, growing from 2025 value of 32.62 gigawatt with 2031 projections showing 55.77 gigawatt, growing at 9.35% CAGR over 2026-2031.
This growth trajectory is underpinned by the 11th Basic Plan for Electricity Supply and Demand, which lifts the national renewable-generation target from roughly 10% in 2025 to 30.2% by 2030 and allocates 72 GW exclusively to solar by decade-end. Three structural forces are central: escalating Renewable Portfolio Standard (RPS) penalties that exceed the cost of new photovoltaic (PV) procurement, export-sector RE100 commitments that sharpen demand for long-term power purchase agreements, and a steady fall in mono-crystalline module prices that has pushed utility-scale levelized cost of electricity (LCOE) below KRW 80 per kWh (USD 0.06 per kWh) for many projects. Land-use setbacks ranging from 300 m to 1,000 m, Korea Electric Power Corporation’s (KEPCO) debt-driven cap-ex squeeze, and rising curtailment in Jeolla and Chungcheong provinces, however, temper otherwise robust fundamentals.
Key Report Takeaways
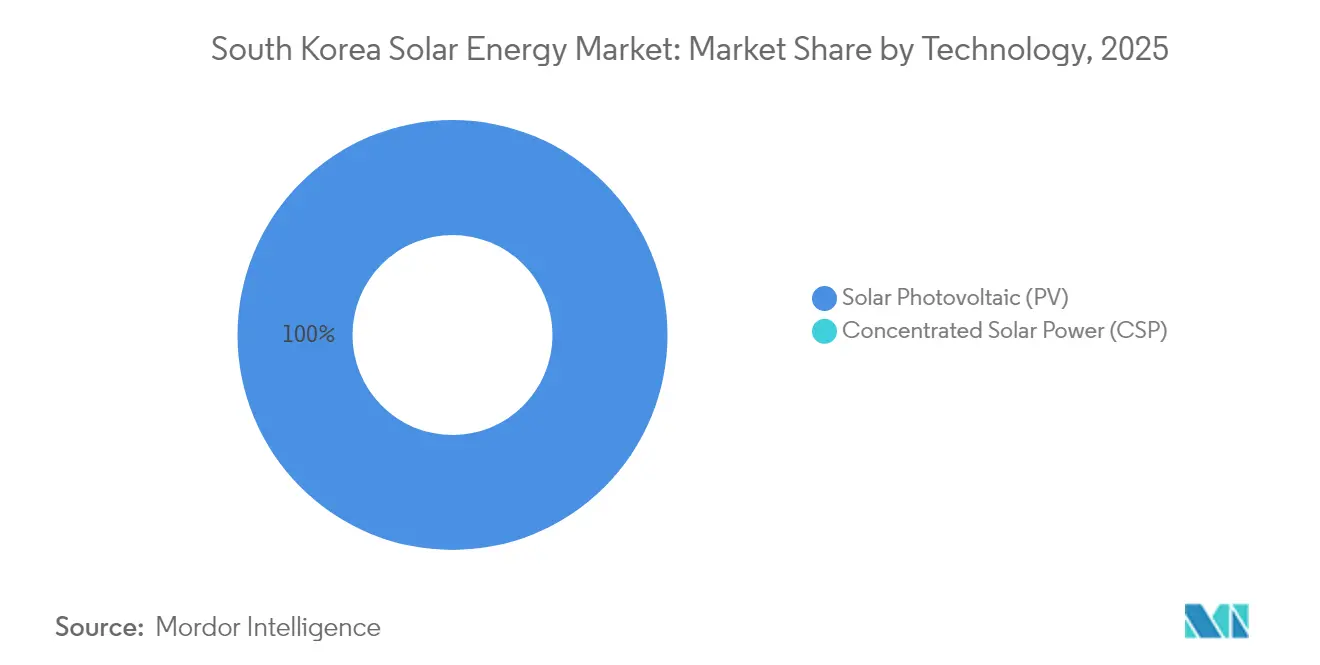
- By technology, photovoltaic systems held 100.00% of the South Korean solar energy market share in 2025; their installed base is forecast to expand at a 9.55% CAGR through 2031.
- By grid type, on-grid projects controlled 99.44% of the South Korean solar energy market size in 2025, while the off-grid niche is advancing at 13.3% CAGR on island-electrification demand.
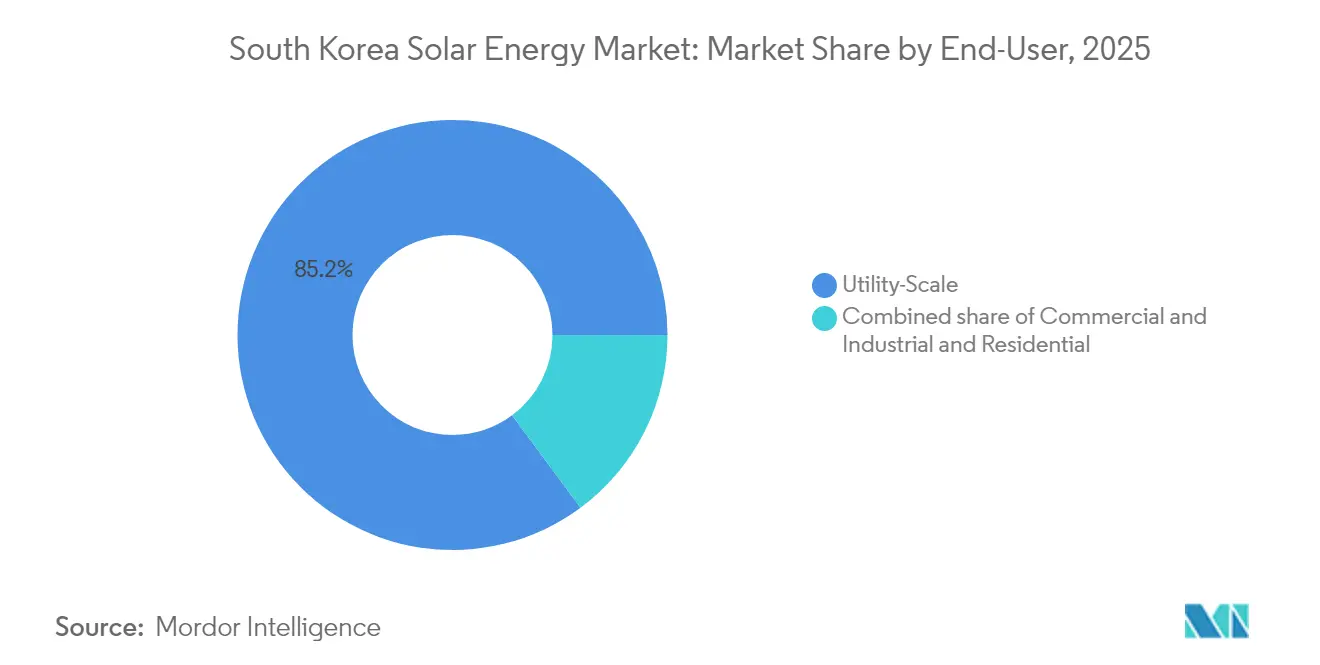
- By end-user, utility-scale installations accounted for 85.15% of the South Korean solar energy market share in 2025 and are expected to grow at 10.2% through 2031.
Note: Market size and forecast figures in this report are generated using Mordor Intelligence’s proprietary estimation framework, updated with the latest available data and insights as of 2026.
South Korea Solar Energy Market Trends and Insights
Drivers Impact Analysis*
| Driver | (~) % Impact on CAGR Forecast | Geographic Relevance | Impact Timeline |
|---|---|---|---|
| Aggressive Renewable Portfolio Standard targets to 2030 | +2.8% | National; highest in Jeolla, Gyeongsang, Chungcheong | Medium term (2-4 years) |
| Corporate RE100 demand from semiconductor and battery exporters | +1.9% | National; industrial clusters in Gyeonggi, Chungcheong | Short term (≤ 2 years) |
| Declining LCOE of high-efficiency PV modules | +2.1% | National | Short term (≤ 2 years) |
| Commercialization of perovskite-silicon tandem cells | +1.4% | National; R&D hubs in Ulsan, Daejeon | Long term (≥ 4 years) |
| Floating-solar and agrophotovoltaic land-use innovations | +1.2% | Coastal and agricultural provinces | Medium term (2-4 years) |
| Solar-plus-storage tenders under the 11th Plan | +1.5% | Grid-constrained regions | Medium term (2-4 years) |
| Source: Mordor Intelligence | |||
Aggressive Renewable Portfolio Standard (RPS) targets to 2030
The revised Renewable Portfolio Standard raises the minimum renewable purchase obligation on generators above 500 MW from 12.5% in 2025 to 25% in 2026, creating an immediate and enforceable floor for solar demand. Utilities risk penalties higher than renewable procurement costs, so forward contracting for solar certificates has intensified. The South Korean solar energy market benefits because compliance demand is volume-based, not price-based, insulating planned projects from commodity-price volatility. The Eleventh Basic Plan further commits to 77.2 GW of solar by 2038, encouraging developers to accelerate build schedules to capture attractive renewable energy certificate pricing well before the target year.[1]“Long-Term Electricity Supply and Demand Basic Plan (11th Draft),” Enerdata, enerdata.net Provincial governments in Gyeonggi and Jeolla are already issuing competitive tenders aligned with the RPS trajectory, making these regions short-cycle growth hotspots.
Corporate RE100 demand from semiconductor & battery exporters
Export-oriented industries now link market access to renewable procurement, and Samsung Electronics alone consumes more power each year than the nation’s entire 2024 renewable output. Eight SK Group affiliates formalized RE100 pledges in 2025, signaling that renewable sourcing has become a condition for supply-chain participation rather than a CSR initiative.[2]“RE100 Progress and South Korean Corporate Signatories,” RE100, there100.org European original equipment manufacturers, notably BMW and Volvo, mandate RE100 compliance for parts suppliers, and the South Korean solar energy market responds with surging demand for Korea Renewable Energy Guarantees of Origin (K-REGOs). Direct power purchase agreements allow corporates to bypass the regulated tariff mechanism and secure on-site or near-site solar assets that satisfy global climate-auditing protocols, solidifying a premium segment of long-term offtake contracts.
Declining LCOE of mono-PERC & TOPCon modules
Average selling prices for mono-PERC and TOPCon modules dropped following the 2024 polysilicon oversupply, and South Korean manufacturers took advantage of compatible production line conversions that lower per-watt costs to 0.44 CNY/W without fresh capital expenditure. Lower module prices compress overall project budgets, reduce the levelized cost of electricity, and widen internal-rate-of-return thresholds, which in turn attract new pools of domestic pension capital. Project sponsors are now bundling rooftop and carport installations with behind-the-meter battery systems to meet complex load profiles, demonstrating that cost declines translate into broader application diversity as well as lower wholesale prices.
Commercialisation of perovskite-silicon tandem cells (local R&D edge)
Hanwha Q cells announced a validated 28.6% conversion efficiency on a commercially scalable tandem cell, lifting potential output by 15% over conventional mono-PERC modules. A pilot line in Jincheon aims for mass production in 2026, and the Ministry of Trade, Industry, and Energy coordinates funding across public research institutes and suppliers to secure intellectual property advantages. Domestic manufacturers regard tandem cells as critical to preserving export competitiveness against Chinese cost leadership in standard silicon products. The South Korea solar energy market, therefore, gains a technology lever that can reduce land intensity, a vital benefit given domestic land-use resistance and setback ordinances.
Restraints Impact Analysis*
| Restraint | (~) % Impact on CAGR Forecast | Geographic Relevance | Impact Timeline |
|---|---|---|---|
| "Solar-distancing" land regulations (300-1,000 m setbacks) | -1.6% | National, acute in Gyeonggi, Gangwon provinces | Short term (≤ 2 years) |
| KEPCO tariff deficit limiting grid upgrades | -1.3% | National, critical in Jeolla, Chungcheong | Medium term (2-4 years) |
| Sub-10% renewable share keeps policy ambition modest | -0.7% | National | Medium term (2-4 years) |
| PV curtailment risk in Jeolla & Chungcheong provinces | -0.9% | Regional, concentrated in Jeolla, Chungcheong | Short term (≤ 2 years) |
| Source: Mordor Intelligence | |||
“Solar-distancing” land regulations (300-1,000 m setbacks)
Local ordinances introduced in 2024 require setbacks of 300-1,000 m between solar projects and the nearest residence, eliminating 17,000 km² of potential sites and shrinking deployable land by 69.6%.[3]S. Kim, “Municipal Setbacks Reduce Solar Developable Area by 70 %,” Solutions for Our Climate, sfo.or.kr The Ministry of Trade, Industry, and Energy found no adverse health or environmental impacts from PV arrays, yet 112 of 229 municipalities enforce the rules, often influenced by visual-impact concerns rather than science. Developers must complete extra environmental impact statements and negotiate local referenda, adding six to nine months to permitting timelines and raising soft costs. Constitutional appeals are pending, and an eventual legal resolution could unlock constrained capacity, but near-term schedules remain at risk.
KEPCO tariff deficit limiting grid upgrades
Regulated retail tariffs did not fully reflect 2024 fossil-fuel price spikes, leaving Korea Electric Power Corporation with record operating losses of KRW 13.1 trillion. The utility now struggles to fund 500-kV transmission upgrades essential for evacuating solar output from resource-rich southwestern provinces. Renewable generators currently receive curtailment notices in Jeolla and Chungcheong whenever solar penetration exceeds 20% of midday demand, a scenario that already occurred on 42 spring days in 2024. Without a predictable path to cost-reflective tariffs, grid-expansion capex is likely to trail renewable build-out.
*Our forecasts treat driver/restraint impacts as directional, not additive. The impact forecasts reflect baseline growth, mix effects, and variable interactions.
Segment Analysis
By Technology: Photovoltaic Hegemony amid Tandem-Cell Upswing
Photovoltaic systems accounted for the entire South Korean solar energy market size in 2025 and are set to expand at a 9.55% CAGR to 2031. Concentrated Solar Power remains absent because direct-normal irradiance averages only 3.8 kWh/m²/day, well below the 5.5 kWh viability threshold. Mono-PERC modules held 38% of shipments in 2024, while TOPCon technology rose to 62% on 22.5% cell efficiency and strong bifacial response. Hanwha Q CELLS and OCI are piloting perovskite-silicon tandem product lines with commercial release targeted for 2027. Thin-film solutions hold under 1% share, hindered by lower efficiency and limited local supply chains.
Floating PV is the standout sub-segment. The Saemangeum project uses high-density polyethylene floats rated for 50-year storms and expects full 2.1 GW completion by 2026, enough to serve 1.2 million households. Reservoir-based output gains 8%-12% from module cooling, while bifacial designs capture 18% albedo uplift. Agrophotovoltaic towers mounted 3 m above crops produced 600 kWh per installed kW and retained 85% vegetable yield in Chungcheong trials, illustrating a dual-use path around restrictive land codes.



By Grid Type: On-Grid Supremacy with Niche Off-Grid Momentum
On-grid installations represented 99.44% of 2025 capacity, anchored by large utility parks and commercial rooftops monetizing feed-in credits. Off-grid arrays, just 0.56% today, are scaling at 13.3% CAGR as islands swap diesel for solar-battery microgrids that achieve LCOE around KRW 120 per kWh (USD 0.09 per kWh) versus diesel’s KRW 250 per kWh. The 8 MW Ulleungdo microgrid cut diesel use by 72% and trimmed resident tariffs by 38% after commissioning in February 2025. Military bases in Gangwon added 12 MW of islanded rooftop PV in 2024 to assure uninterrupted power during grid faults.
Telecom-tower conversions extend off-grid economics: SK Telecom and KT retrofitted 1,200 remote sites in 2024, slicing operating costs by KRW 18 million (USD 13,500) per tower. Financing remains tight for sub-5 MW projects, so Korea Development Bank opened a KRW 500 billion green-loan window at 2.5% to de-risk rural microgrids.
By End-User: Utility-Scale Dominance, C&I Catch-Up
Utility-scale parks possessed 85.15% of capacity in 2025 and are forecast at a 10.2% CAGR to 2031 as RPS compliance forces coal incumbents to procure green power. The 500 MW Yeongam farm uses single-axis trackers to lift yield 18% and sells under a 20-year PPA at KRW 92 per kWh (USD 0.07 per kWh), below grid parity. Four-hour storage add-ons qualify for a KRW 15 per kWh capacity bonus, raising IRR to almost 9%.
Commercial-and-industrial (C&I) rooftops are gathering pace on RE100 compliance needs. Samsung’s Pyeongtaek mega-fab switched on 50 MW of bifacial panels in March 2025, meeting 12% of its internal load. SK Hynix locked in 2 GW of solar supply via PPAs in November 2024 at KRW 95 per kWh (USD 0.07 per kWh). Direct wheeling is still barred, but MOTIE’s Gyeonggi pilot platform could open a path around KEPCO’s administrative surcharge. Residential uptake lags, limited by a 10 kW net-metering cap that pays wholesale, roughly 40% below retail, and stretches payback to roughly 12 years.
Geography Analysis
Jeolla and Chungcheong provinces account for more than 38% of cumulative solar generation because flat former salt-pond land offers inexpensive plots, yet they now suffer the nation’s highest curtailment ratios during spring shoulder months. The South Korean solar energy market responds with battery deployment co-located at new solar farms, a strategy underscored by provincial RFPs that reward projects proposing at least 20% storage-to-solar capacity. Jeju Island hosts a technology testbed where Korea Electric Power Corporation demonstrates automated EMS platforms capable of real-time ramp-rate control, providing a blueprint for mainland adoption in 2027.
Gyeonggi and Incheon, South Korea’s industrial heartland, display limited vacant land but high corporate power demand. Rooftop and car-port systems attached to semiconductor fabs and logistics centers dominate new capacity additions, supplemented by virtual power-purchase deals that draw electrons from distant ground-mounted plants. The Seoul metropolitan government adopted a “solar-friendly building code” in 2024 that mandates PV-ready roofs on all new public buildings, a policy expected to add 500 MW of mid-scale capacity by 2028. The South Korean solar energy market embeds these urban measures into long-term demand forecasts, acknowledging that rooftop adoption partially offsets slower rural ground-mount approvals.
Coastal regions such as Saemangeum and South Jeolla transition toward floating solar arrays. The 2.1 GW Saemangeum project is staged for full commissioning in 2025 and will supply commercial off-takers located hundreds of kilometers inland via high-voltage direct-current links. K-water’s 3 MW Cheongpung Lake plant provides remote-monitoring data proving that wave-induced accelerations remain within module mechanical limits, a prerequisite for scaling to gigawatt projects. Agrophotovoltaic pilots in Chungbuk reveal negligible yield impact on shade-tolerant grape varieties, suggesting that 20,000 hectares of farmland could host dual-use arrays by 2030. Collectively, these regional initiatives underscore the geography-specific diversification required to meet the Eleventh Plan’s 77.2 GW solar target.
Regulatory Landscape
South Korea solar deployment is shaped by national power planning and renewable procurement frameworks led by the Ministry of Trade, Industry, and Energy (MOTIE), with market administration spanning Korea Electric Power Corporation (KEPCO) grid connection rules and Korea Energy Agency (KEA) procurement programs. The Renewable Portfolio Standard (RPS) remains a key compliance driver in the current structure, and the report baseline reflects the step-up in the renewable purchase obligation for generators above 500 MW to 25% in 2026, reinforcing volume-based demand for solar certificates and contracted supply.
In 2026, the Ministry of Climate, Energy and Environment (MCEE) advanced reforms that move renewable procurement toward a government-led auction and contract market approach, shifting emphasis from REC-linked revenue to longer-tenor awarded contracts. At the same time, KEA opened applications for the 2026 solar fixed-price contract tender, adding module carbon-emissions assessment as a scored criterion. The government also signaled localization requirements for state-supported solar projects to reduce supply chain dependence, increasing compliance and documentation expectations for module sourcing in public procurements.
Competitive Landscape
Domestic supply chains are moderately concentrated around vertically integrated conglomerates that leverage balance-sheet strength to finance R&D and global expansion. Hanwha Q cells maintains 8.4 GW of annual production and secures differentiated positioning through its record 28.6% tandem-cell efficiency. OCI Holdings focuses on high-purity polysilicon and secured a 120 MW solar-plus-480 MWh-storage EPC contract with CPS Energy in Texas, illustrating outbound project development momentum. LS Electric specializes in system integration and energy-storage solutions and recently closed Korea’s largest industrial ESS portfolio at 175 MWh for SeAH Group, enhancing its domestic footprint.
Competition intensifies as policy backs perovskite commercialization. Hanwha’s planned USD 1.28 billion tandem investment and its USD 88 million bid for REC Silicon indicate a drive to secure upstream feedstock independence. Meanwhile, LG Energy Solution pivots from EV-centric revenues toward utility-scale lithium-iron-phosphate cells, evidenced by a 1 GWh Polish ESS contract signed in May 2025 that builds experiential know-how transferable to the South Korean solar energy market. Start-ups occupy technology niches, such as string inverter diagnostics and real-time performance analytics, supplying critical digital services to larger EPCs without confronting them on a capex scale.
Industry rivalry also expands on the policy front. Domestic agencies tie R&D funding to global patent filings, prompting companies to accelerate intellectual-property races in perovskite encapsulation and floating-platform anti-corrosion treatments. Because the top five module, materials, and system-integration firms hold an estimated 58% of national solar hardware revenue, market power remains balanced. Buyers still benefit from competitive solicitations that regularly attract foreign EPC consortia, especially for syndicated floating solar and offshore microgrid packages.
South Korea Solar Energy Industry Leaders
Hyundai Corporation
S Energy Co. Ltd
LS Electric Co. Ltd
Hanwha Q cells
OCI Holdings
- *Disclaimer: Major Players sorted in no particular order

Market Opportunities and Future Outlook
Opportunities are concentrated where policy mechanisms and corporate demand translate into bankable offtake and contracted development pipelines. The corporate RE100 channel already supports long-duration contracting, with direct PPA announcements in 2026 (including a 100 MW solar direct PPA by SK Eternix) and renewable power supply arrangements brokered with major builders and developers. This is creating room for rooftop and near-load C&I systems, aggregation platforms, and standardized contract structures that address credit, settlement, and traceability needs through K-REGOs and verified renewable supply.
On the supply and project-development side, MCEE’s 2026 policy direction emphasized scaling national renewable capacity and lowering solar contract prices over time, while KEA tenders that include carbon scoring create a differentiated lane for lower-footprint modules and domestically sourced components. In grid-constrained provinces where curtailment risk is higher, near-term demand is also building for solar-plus-storage configurations that can fit tender designs and provincial RFP scoring tied to dispatchable capability. Floating solar and agrophotovoltaics continue to be practical development routes around municipal setback constraints, while government-backed R&D calls in 2026 for solar and wind support commercialization pathways for higher-efficiency cells and BOS innovations that reduce land intensity and improve yields in space-constrained industrial regions.
Recent Industry Developments
- June 2026: Bright Energy Partners and Hyundai Engineering and Construction signed an MOU to jointly develop and supply 1.6 GW of solar renewable energy for corporate RE100 demand. The partnership formalizes a scaled development channel that links project origination, EPC execution, and long-term offtake structuring, supporting larger corporate procurement volumes.
- May 2026: Hanwha Qcells was selected to supply domestically manufactured solar cells and modules for a 400 MW solar project in Haenam County, South Jeolla Province, cited as South Korea's largest single-site solar project. The award strengthens localization-led procurement momentum and raises the competitive bar for module qualification in large utility-scale builds.
- October 2024: The Ministry of Trade, Industry, and Energy opened auctions for 2.8 GW of renewables, including a 1 GW solar tranche. The auction design expanded the near-term contracting pipeline for utility-scale PV and reinforced competitive procurement as a route to capacity additions.


Research Methodology Framework and Report Scope
Market Definition and Coverage
For this study, the market covers solar power in South Korea measured through installed generation capacity, counting operational PV and CSP systems and the capacity added through new grid and project connections.
Scope exclusions: We do not size upstream equipment manufacturing revenues, raw material supply, or power trading margins that sit outside solar asset deployment.
Segmentation Overview
- By Technology
- Solar Photovoltaic (PV)
- Concentrated Solar Power (CSP)
- By Grid Type
- On-Grid
- Off-Grid
- By End-User
- Utility-Scale
- Commercial and Industrial (C&I)
- Residential
- By Component (Qualitative Analysis)
- Solar Modules/Panels
- Inverters (String, Central, Micro)
- Mounting and Tracking Systems
- Balance-of-System and Electricals
- Energy Storage and Hybrid Integration
Data Sources, Market Sizing, and Validation
Desk Research
Desk research was used to set the factual base for the market model and to keep yearly capacity movements realistic for South Korea. We leaned on public energy statistics and policy documents, including data releases from Korea Energy Agency, Korea Electric Power Corporation, and the Ministry of Trade, Industry and Energy, followed by grid and market operator publications such as Korea Power Exchange.
To cross-check build rates and technology mix, we also referred to sources such as IEA country and renewables datasets, IRENA capacity series, and peer-reviewed journal articles that track PV performance and land-use constraints. Company presentations, project announcements, and reputable press were reviewed to sense-check large project timelines, and a paid subscription for company financials and a patent database was used selectively when public splits were not clearly stated. These desk research sources are illustrative, and many other public documents were also reviewed for data collection, validation, and clarification.
Primary Interviews and Surveys
Primary work was used to pressure-test the South Korea capacity story with people who see permitting steps, EPC activity, and grid connection queues firsthand. We spoke with a mix of developers, EPC contractors, component suppliers, financiers, and end users across utility-scale, C&I rooftops, and residential installs, and we compared responses until the same assumptions repeated across multiple interviews. Where inputs diverged, follow-ups were used to confirm which pipeline was firm versus aspirational, and which pricing and lead times were being observed in the market.
Distribution of primary research fieldwork respondents
| Company type | Respondent position |
|---|---|
| Top tier: 36% | CXOs: 16% |
| Mid tier: 48% | Functional/Unit leaders: 39% |
| Smaller Players: 16% | Managers: 45% |
Market-Sizing & Forecasting
The core sizing uses a top-down capacity accounting approach where published installed base, annual additions, and retirements are reconstructed into a consistent time series for South Korea. Those totals are then corroborated using selective bottom-up approximations, such as sampling announced project capacities, checking typical commissioning lags, and comparing implied annual additions with supplier and EPC activity signals, before the final numbers are locked.
Key inputs that shape the model include annual PV and CSP capacity additions, grid connection and commissioning timelines, utility-scale versus rooftop mix, policy support signals (including renewable obligations and auction volumes), and module and BOS price direction that affects project pacing. Where project pipelines were disclosed without clear dates, we applied conservative commissioning curves and then adjusted them based on repeated feedback from interviews.
For forecasting, scenario analysis is used because policy cadence, grid constraints, and land availability can change the run-rate quickly. The base case is built from a stable additions pathway supported by expert consensus on permitting speed, connection delays, and expected tender volumes, and then stressed with a slower and faster case to keep the forecast range practical.
Data Validation & Update Cycle
Validation is done in layers so a single data series does not drive the outcome. Model outputs are compared against independent signals, such as public capacity releases, major project commissioning news, and observed tender activity, and then variance checks are run to spot jumps that do not match known policy or grid events.
Before sign-off, the logic and calculations are reviewed by another analyst, and any unusual movement triggers a re-check of assumptions and, where needed, a short re-contact with market participants. Reports are refreshed annually, with interim updates when material events occur, and a final pre-delivery review is done so clients receive the latest updated view.
Mordor Intelligence's South Korea Solar Energy Market Estimate Compared With Other Published Estimates
Published estimates for South Korea solar can look far apart because some sources size revenues, while others size installed capacity, and the two do not move in lockstep year to year. Differences also come from how rooftop and utility projects are timed, and whether CSP is treated as meaningful or largely excluded.
The main gap comes from unit choice and what is counted as market activity, where Mordor Intelligence expresses the market in installed GW and counts capacity only after commissioning and grid connection, instead of converting generation or equipment sales into a USD value using broad price assumptions.
Benchmark comparison
| Source | Market Size | Gaps in Research Methodology |
|---|---|---|
| Mordor Intelligence | USD 35.67 B (2026) | |
| Trade Publisher A | USD 2.20 B (2024) | Uses revenue sizing and folds in pricing and value-chain assumptions, which can inflate or compress totals depending on module price cycles and how services are counted. |
| Industry Research Group B | USD 3.20 B (2024) | Focuses on the PV market in USD and may include equipment and component revenues, so the total shifts with ASP changes even if installed capacity growth is steady. |
The table shows that the spread is mostly explained by capacity versus revenue measurement and by which parts of the solar value chain are included. By keeping the model anchored to observable commissioning and installed base movements, the resulting market size stays traceable to clear capacity drivers and repeatable checks.


Key Questions Answered in the Report
How large is the South Korea solar energy market in 2026?
Installed capacity reached 35.67 GW in 2026 and is forecast to climb to 55.77 GW by 2031.
What CAGR is expected for South Korea's solar build-out to 2031?
Capacity is projected to advance at a 9.35% CAGR during 2026-2031.
Which segment leads new installations?
Utility-scale plants dominate with 85.15% share in 2025 and a forward CAGR of 10.2%.
Why is floating solar growing quickly in South Korea?
Reservoir-mounted arrays bypass land-use setbacks and deliver 8%-12% higher energy yield due to evaporative cooling.
How do RPS penalties affect project economics?
Utilities face fines of KRW 150 per kWh for renewable shortfalls, making solar procurement cheaper than non-compliance.
What is the main bottleneck to further capacity additions?
KEPCO's debt-driven cap-ex constraints delay transmission upgrades, triggering curtailment in high-penetration provinces.
Page last updated on:





